Beats 6.5.0 released
The Beats 6.5 release is here! This is probably our most feature rich minor release since we’ve started the Beats project. Central config, dedicated UIs for visualizing Beats data, two net-new Beats, Heartbeat GA, and the list goes on and on. A lot of the new functionality is introduced as Beta, so we look forward to your early feedback on these features.
Beats central management (Beta)
You can now control your Beats from Kibana! You can enable and configure Filebeat and Metricbeat modules, stop modules, and re-configure the output. It’s all controlled via configuration tags, so it’s easy to manage tens of thousands of Beats (if you are wondering, yes, there are many deployments with tens of thousands of Beats).
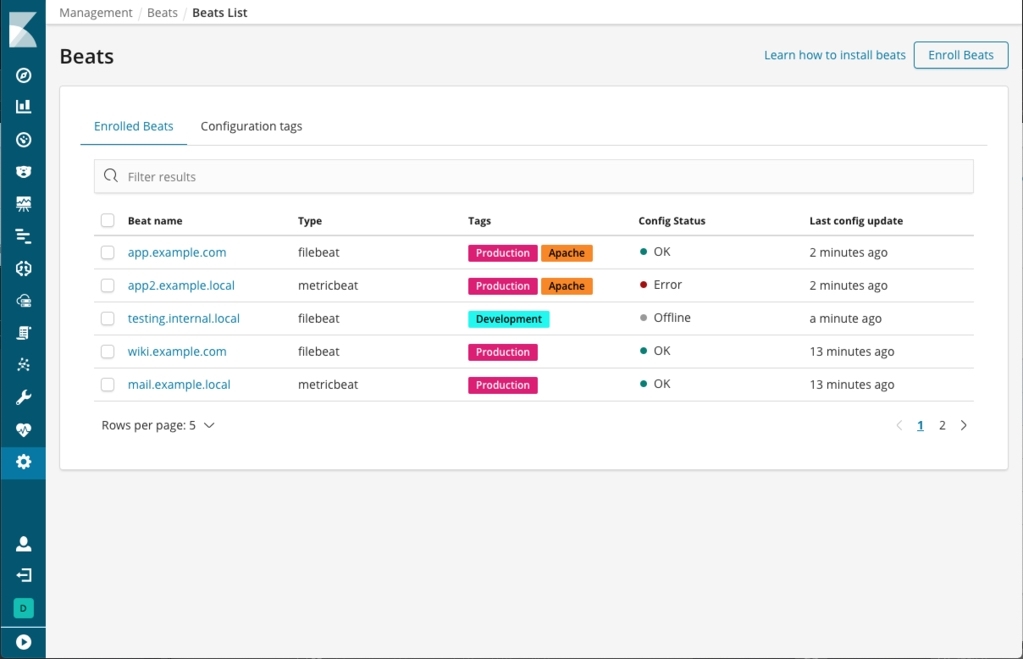
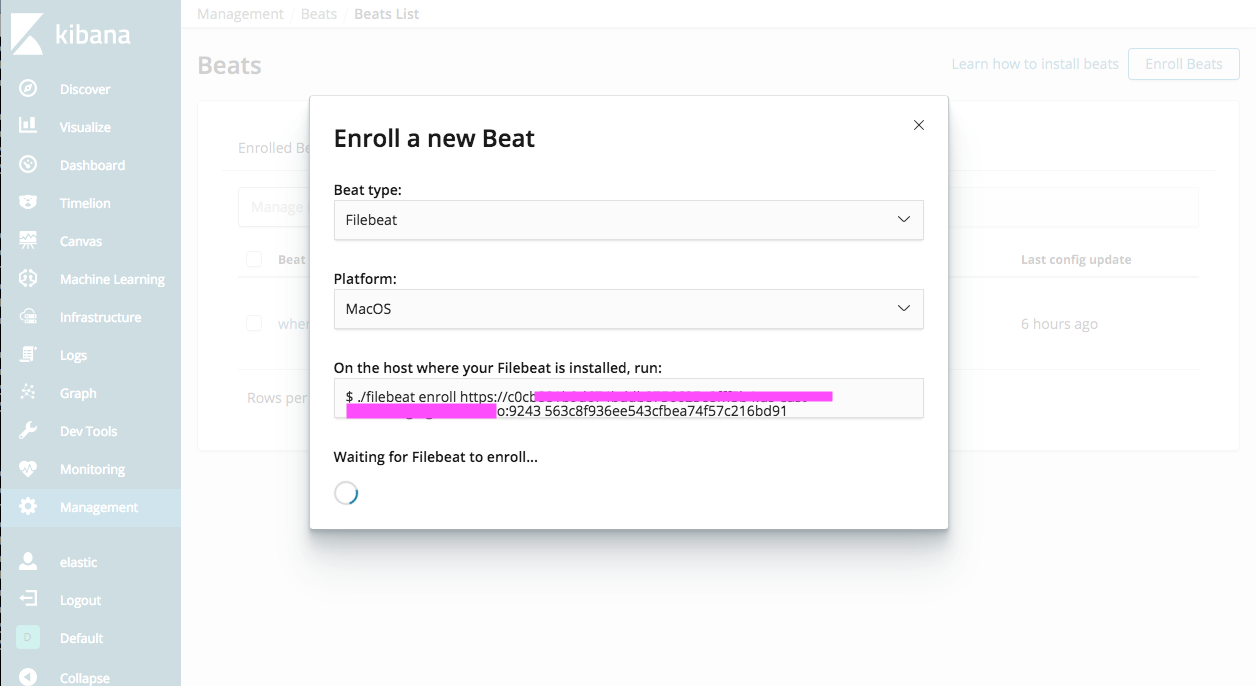
To use central management, you still need to install Filebeat/Metricbeat like before, but instead of editing the configuration file, you “enroll” the Beat to Kibana. The enrollment can be token based or password based. In the token based enrollment, the user needs to copy-paste and run a command like:
$ filebeat enroll <kibana-url> <token>
where <token> can be copy-pasted from the UI.
When doing password based enrollment, the enroll command will prompt for the password for the elastic user. This can also be scripted. After enrolment, a unique token for that particular Beat instance is saved. That means that a Beat can retrieve its own configuration, but nothing else. The enrolment API allows you to automate this process, so this works for large deployments as well.
After enrollment, it’s really easy to configure a new glob in Filebeat or enable a new module Metricbeat:
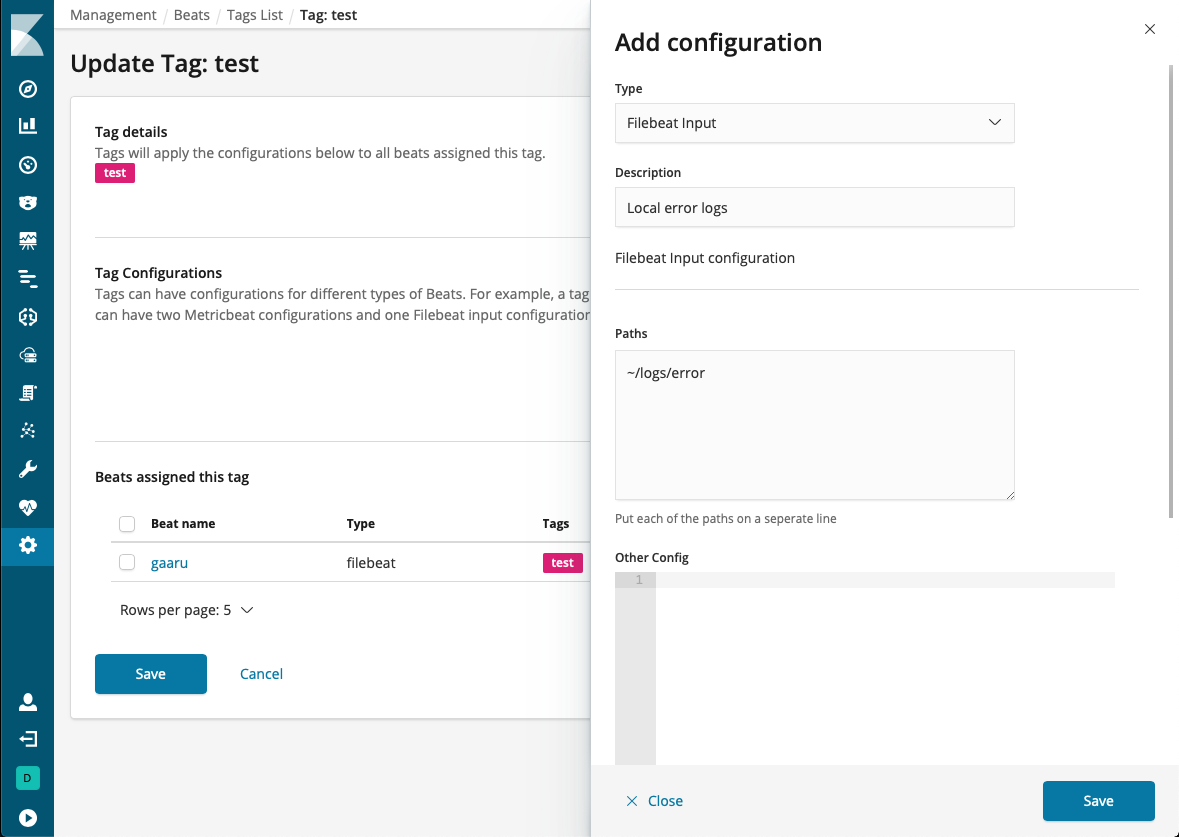
In this Beta release, only Filebeat and Metricbeat are supported.
Infrastructure and Logs Kibana apps (Beta)
After installing Beats and Kibana 6.5, you will notice two new icons on the Kibana navigation bar. These are the Infrastructure UI and the Logs UI, two new Kibana apps that are the perfect companions for Metricbeat and Filebeat.
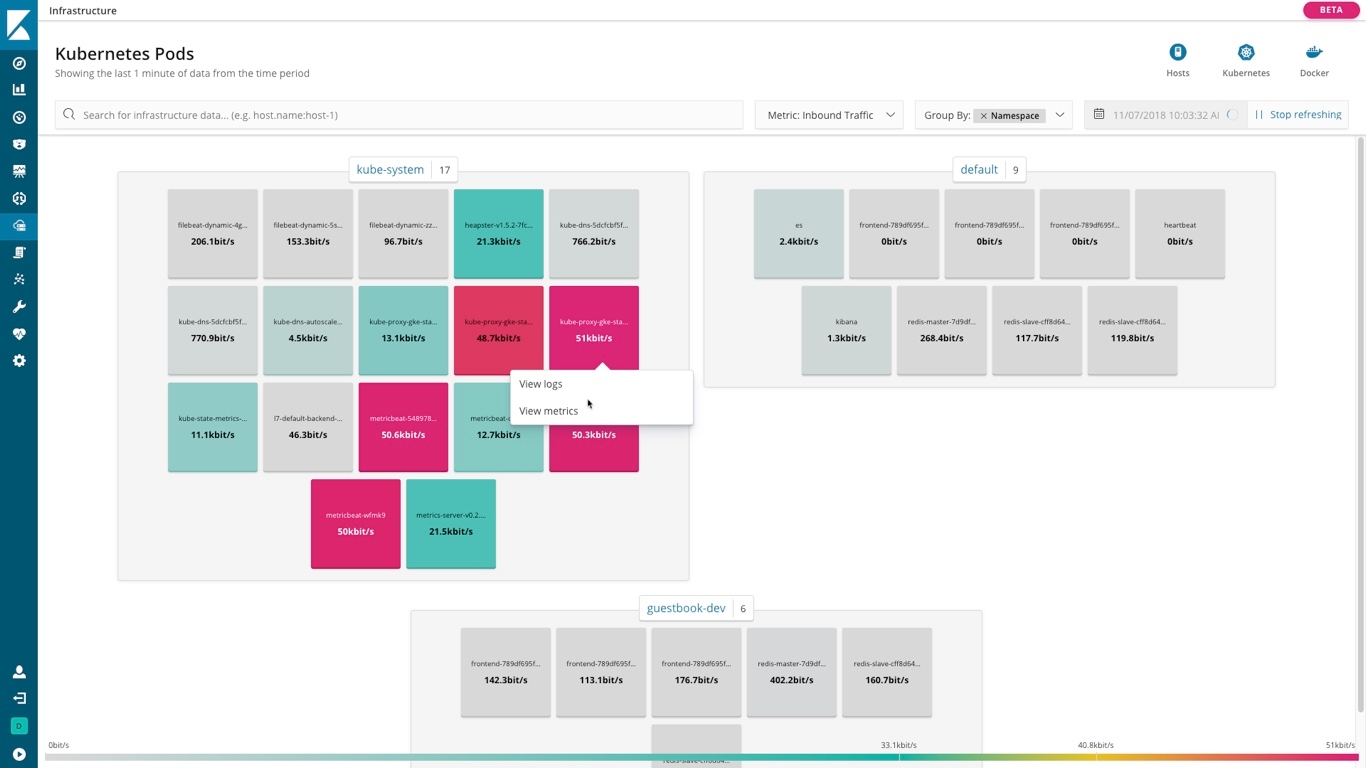
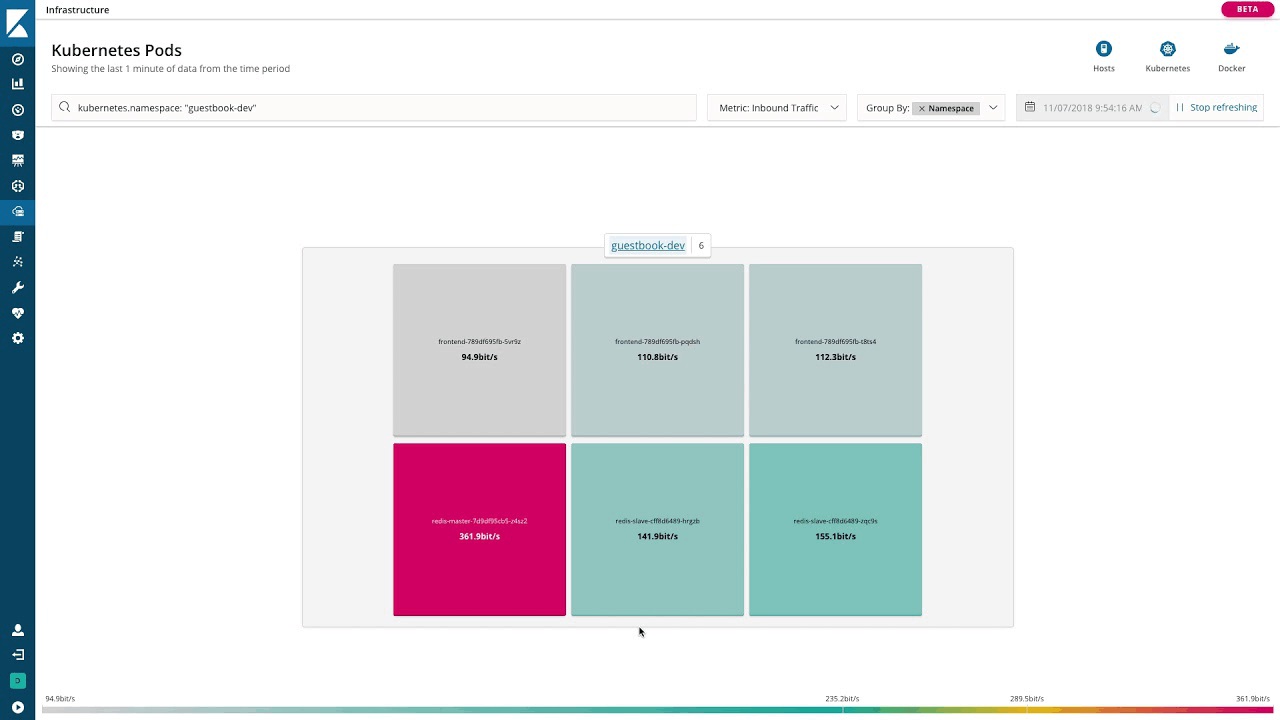
Below is a screenshot of the Infrastructure app, using a diagram that we call "waffle map". Each box in the waffle map can be a host/VM instance, a docker container, or a pod. The view comes with a search bar to filter the boxes that have a specific characteristic and with a "group by" functionality to group the boxes by certain fields like availability zone or the Kubernetes namespace. The color of each box represents the value of the selected metric, in the case of the screenshot, inbound traffic.
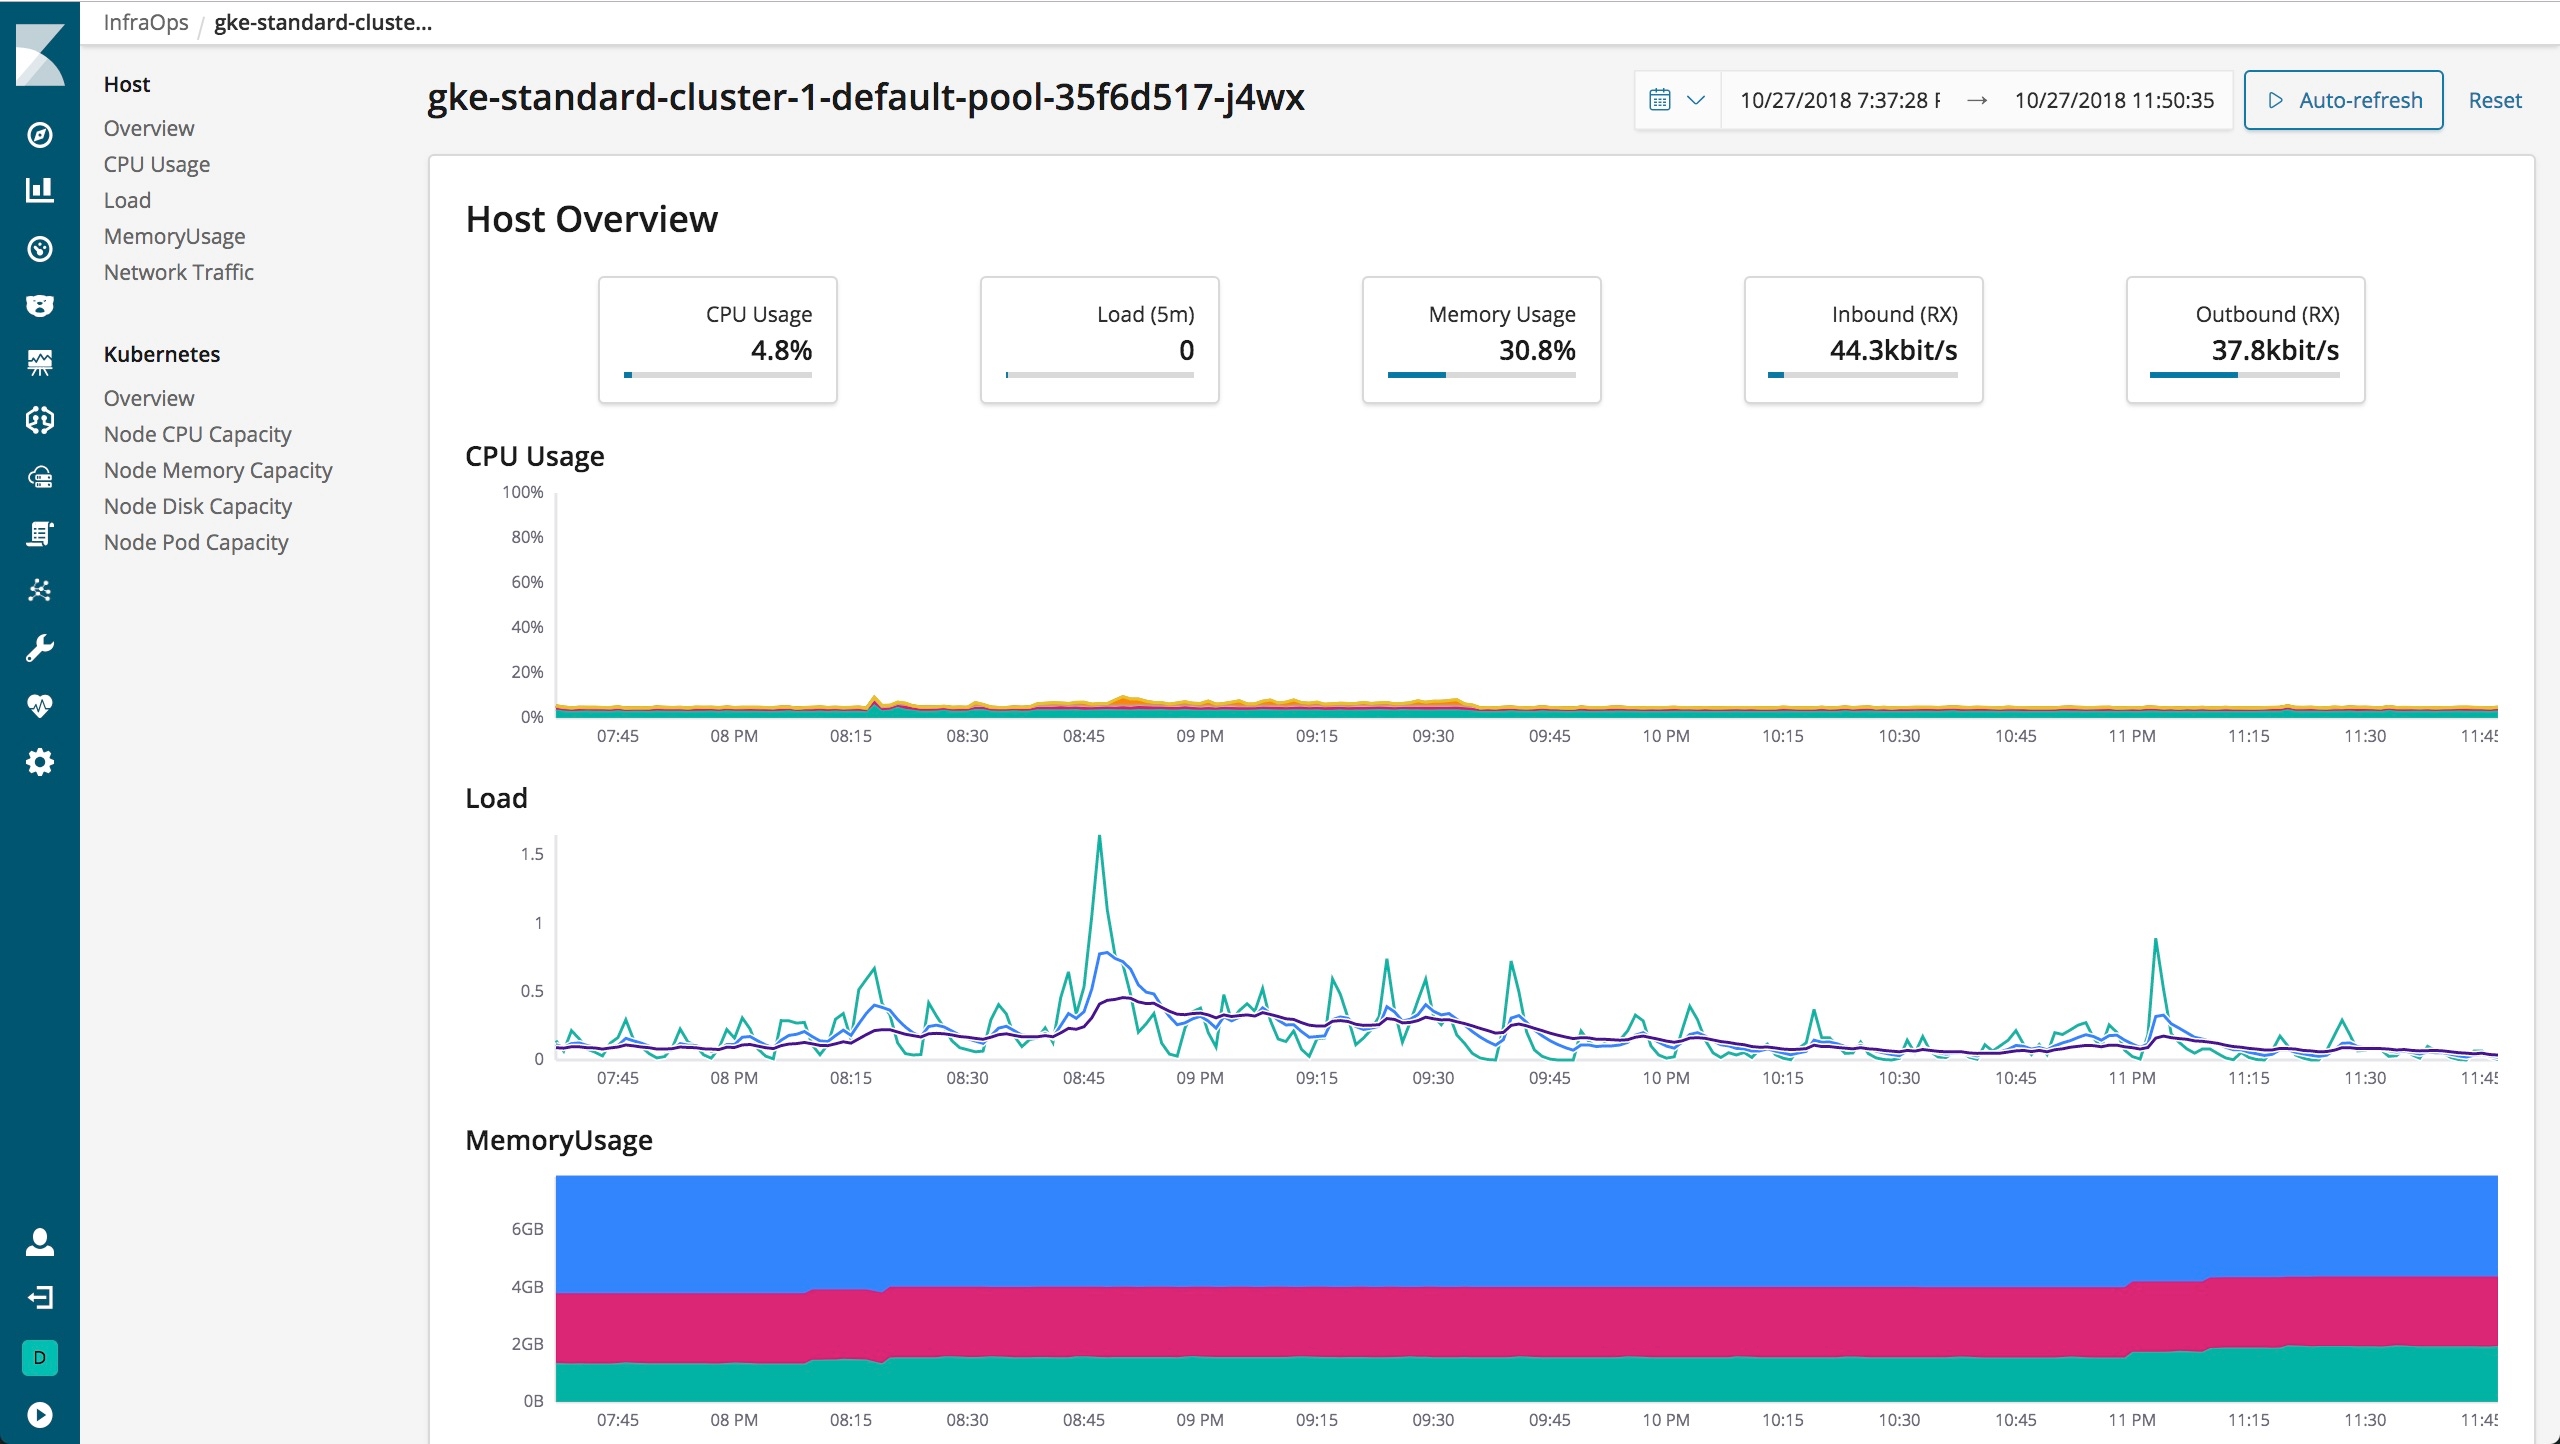
If you click on one of these boxes, you can get more details about the host itself as in the screenshot below. Here you can see not only metrics like CPU usage, load, memory usage, and others, but also the logs that are coming from that host. If the host is a Kubernetes node, you can also see Kubernetes specific metrics.
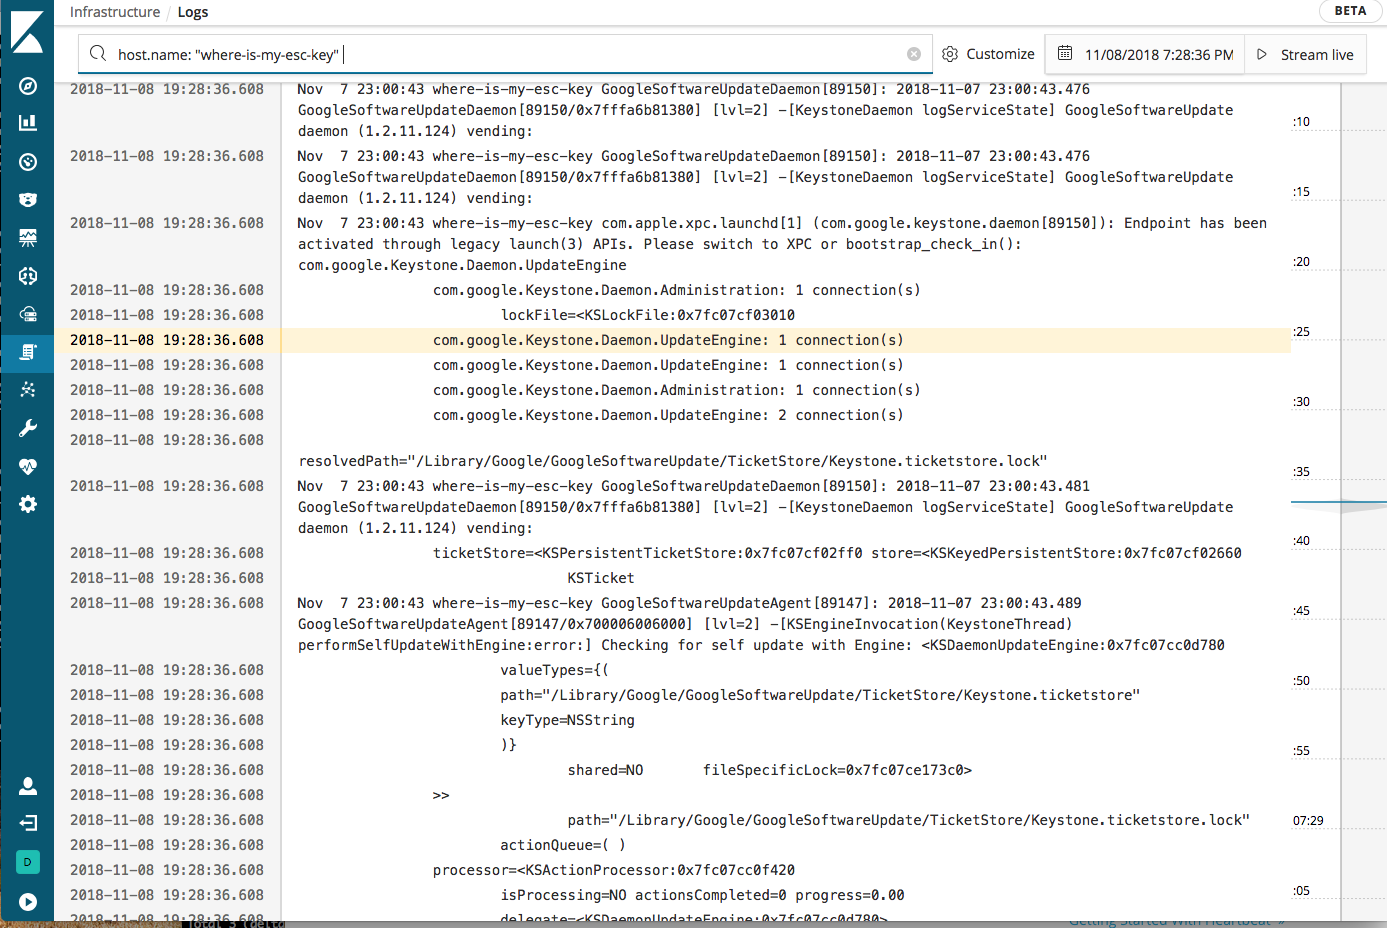
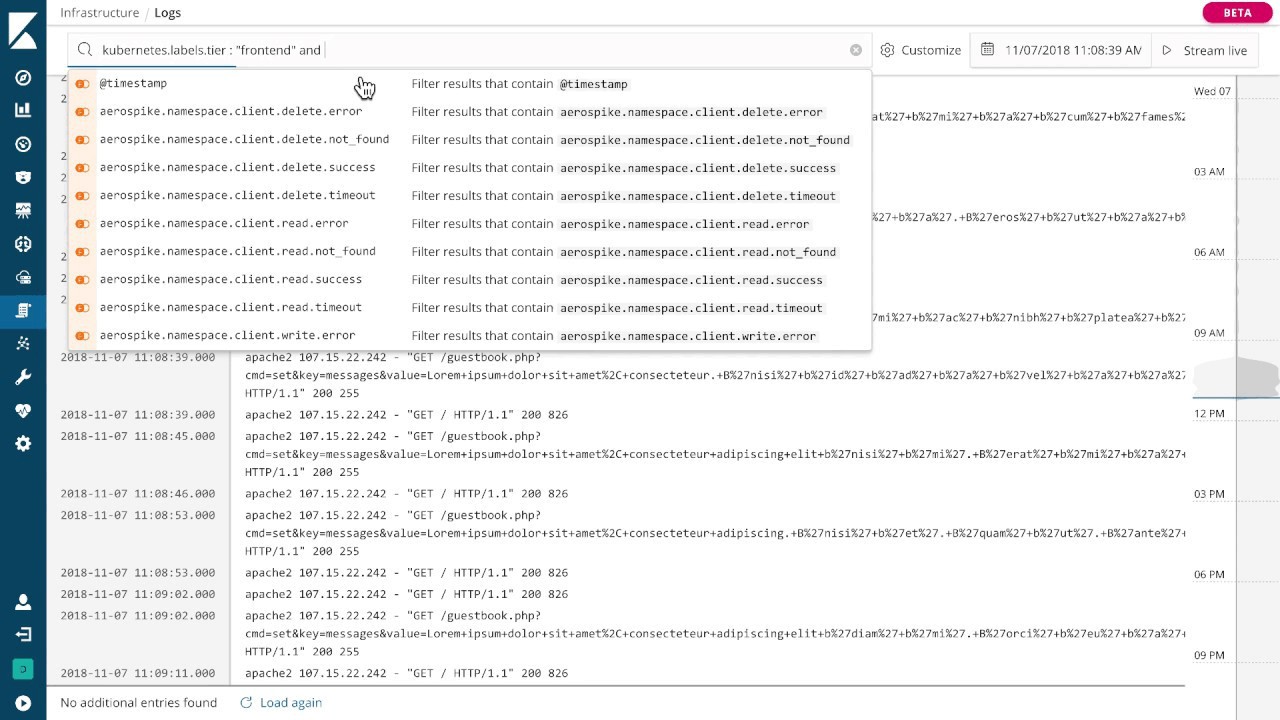
The Logs UI is designed to give you a view to your log files that resembles the good old tail -f, but still give you the fantastic power of Elasticsearch. Compared to the now venerable Discover tab, the Logs UI sorts the entries from older to newer, has infinite scrolling in both directions, live streaming, and a minimap for quick navigation and viewing the log volume. The search bar at the top allows easy searching and filtering using auto-complete. You have to try it, I think you’ll agree that this makes scrolling through logs a lot more pleasant.
Functionbeat (Beta)
Functionbeat is not only a new Beat, but a new kind of Beat. Instead of running on your servers, it runs, well... serverless. The idea is that it can be deployed as an AWS Lambda function, so that if you want to move logs from, say, Cloudwatch to our hosted Elasticsearch Service, you can do that without having to deploy an EC2 instance or similar.
The way it works is that you download a tar.gz on your computer, like with any Beat, but instead of running it locally, you deploy it to Lambda.
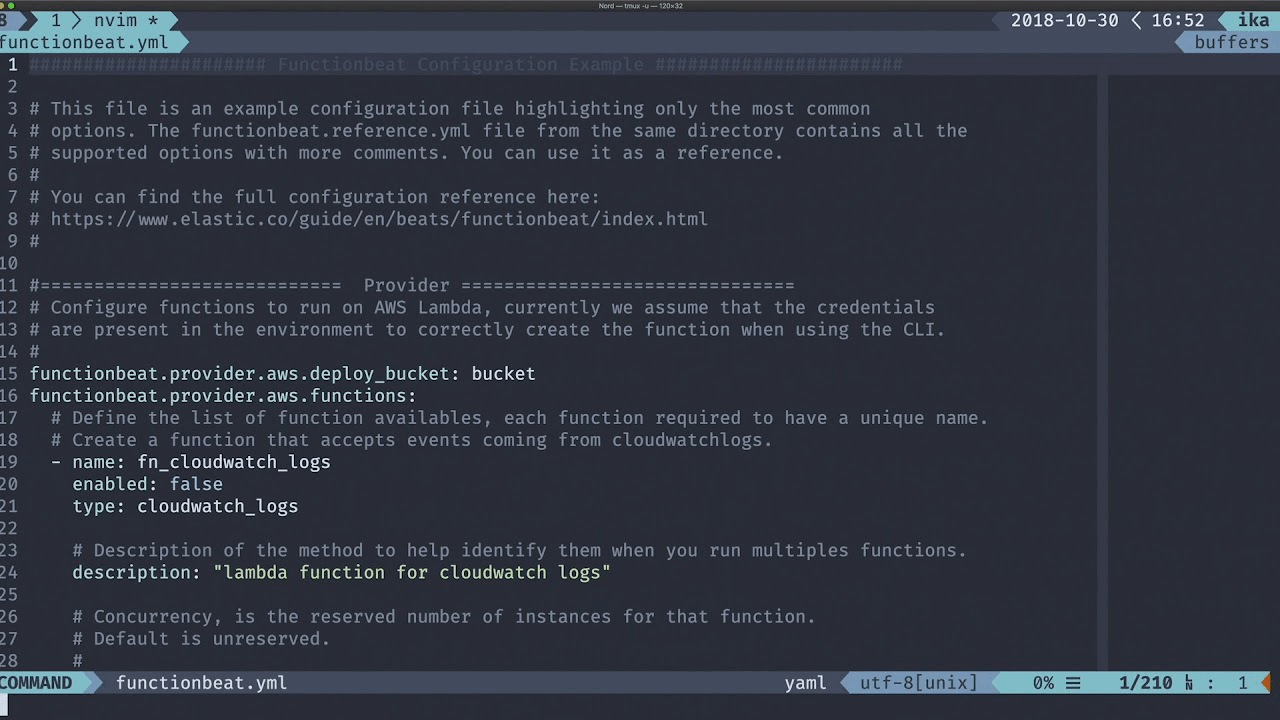
Here is a sample config:
functionbeat.provider.aws.deploy_bucket: "functionbeat-deploy" functionbeat.provider.aws.functions: - name: cloudwatch type: cloudwatch_logs triggers: - log_group_name: /aws/lambda/functionbeat-cloudwatch_logs cloud.id: … cloud.auth: ...
If you then run ./functionbeat deploy cloudwatch, it will create an AWS Lambda function, via Cloudformation, that copies the logs from that Cloudwatch group to the configured Elasticsearch instance.
The initial release runs in AWS Lambda, but we plan adding support for Azure and GCP as well. The supported triggers are Cloudwatch Logs and SQS. Functionbeat also supports Kinesis and the API Gateway but doesn’t yet expose CLI function to deploy them.
Implementation wise, Functionbeat is built on top of the same libbeat platform as the rest of the Beats. This means that features like filtering and index/pipeline configuration work the same way as in Filebeat, for example. In the future, it will also be possible to run modules on top of Functionbeat.
Journalbeat (Experimental)
As journald is very popular on Linux distros, we want to provide a very good experience around ingesting the logs stored in it, just like we have for text logs with Filebeat and Windows Events with Winlogbeat. A community Journalbeat already exists, and plenty of people are using it, but it is time for Elastic to provide an official version. We want to thank @mheese for maintaining Journalbeat for such a long time as a community Beat.
Just like Filebeat and Winlogbeat, Journalbeat maintains in a registry file how far it progressed in the logs, so it knows where to continue on restarts. It also offers “at-least-once” guarantees and is sensitive to back-pressure. It collects all the metadata stored in the journal, like the process executable, process id, or the user, and you can easily filter by any of these fields.
Journalbeat is currently marked as experimental because we have the intention to transform it into a Filebeat input. We do encourage everyone that needs Journald support to try it and provide us with feedback.
Known issues
- Journalbeat cannot be stopped properly when the output is unreachable and it is attempting to connect
- Reference configuration is incorrect. Default value of journalbeat.seek is cursor. Furthermore, journalbeat.matches needs to be journalbeat.include_matches instead.
- Journalbeat does not put the registry file under data folder specified by path.data.

Heartbeat is now GA
During its Beta phase, we’ve seen good adoption and interesting use cases for Heartbeat, so we are very happy to announce its general availability starting with the 6.5.0 release. As a reminder, Heartbeat is a lightweight daemon that you install on a remote server to periodically check the status of your services and determine whether they are reachable. Heartbeat tests service availability via TCP, HTTP, and ICMP checks.
Heartbeat now supports configuration reloading in the same way that Filebeat and Metricbeat do. This makes it easy to dynamically add/remove monitors by writing/removing configuration files on disk. Taking it one step further, it is now also possible to use the libbeat Autodiscover functionality. This means that Heartbeat can discover new services, for example, by listening to Docker or Kubernetes events. In the future, as we add more Autodiscover providers, this will allow Heartbeat to discover, for example, AWS EC2 and ELB instances.
When monitoring TLS endpoints one often wants to be alerted when an x509 certificate is approaching its expiration date. We now record a variety of certificate metadata in our TLS checks, including certificate expiration date. Combine this with a watch to create a reminder to renew your certificates before they expire.
For more details refer to the Uptime Monitoring with the Elastic Stack blog.
.jpg)
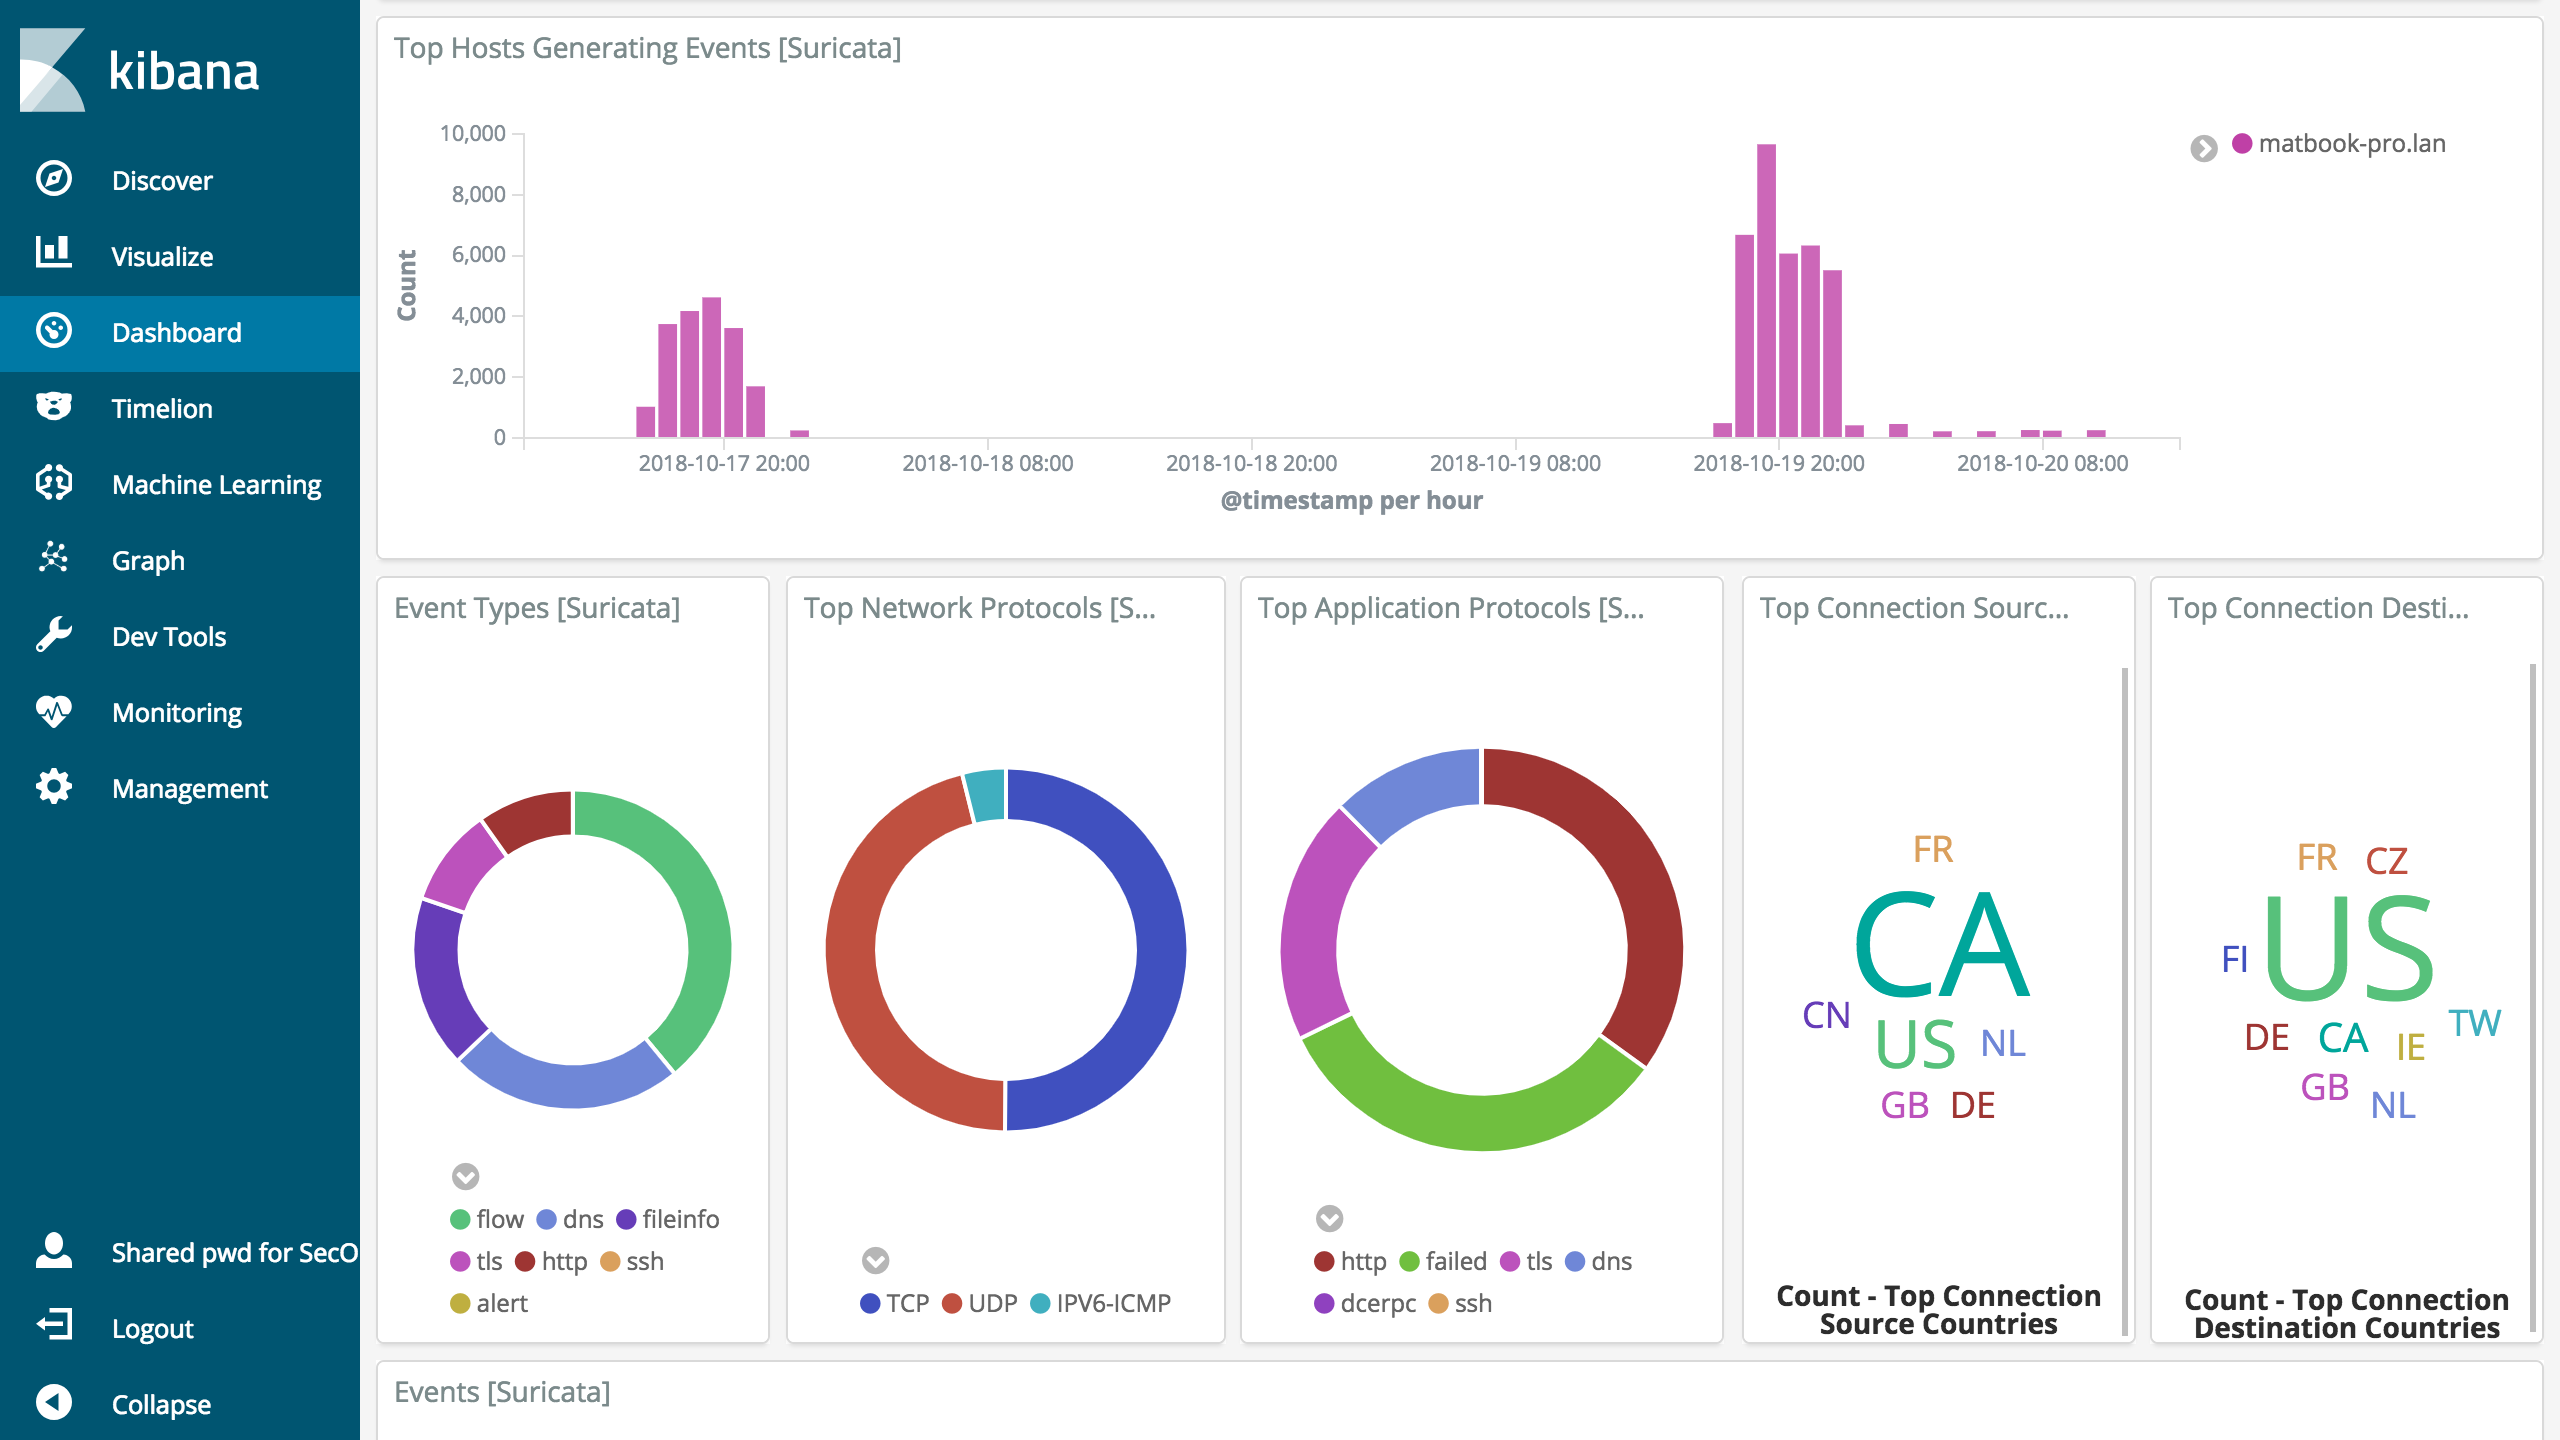
Suricata Integration via Filebeat module
Suricata is an open source real-time intrusion detection system (IDS) and network monitoring system (NMS). Integrating Suricata with the Elastic stack is already a common choice for security professionals. With this release, we’re making this integration easier by providing a Filebeat module that collects the Suricata Eve logs. The module renames several fields so they match with the (in progress) Elastic Common Schema (ECS). The module also comes with a couple of Kibana dashboards.
Modules improvements
Like any Beats release, 6.5 brings several improvements to our existing Filebeat and Metricbeat modules, as well as new modules. To name a few:
- Kafka Metricbeat module is now GA and both the Metricbeat and the Filebeat modules now support Kafka 2.0.0. Metricbeat module also includes a dashboard with consumer group lag visualization.
- Filebeat Docker input is marked as GA.
- Cross-cluster-replication support in the Elasticsearch Metricbeat module
- The Metricbeat
redismodule now collects more memory stats and supports changes introduced in redis 5.0. - Added new metrics about cache size to Metricbeat
memcachedmodule. - New
replstatusandmetricsmetricsets in the MongoDB Metricbeat module. - New
haproxymodule in filebeat with support for default log formats (default, tcplog and httplog). - New
processmetricset inphp_fpmMetricbeat module to collect list of processes in php fpm pools using the full status report. - New
socket_summarymetricset in system module to collect a summary of open connections and listening ports.