Elastic on Elastic: How we monitor our own services, websites, and operations


 Share on Twitter
Share on Twitter

 Share on LinkedIn
Share on LinkedIn

 Share on Facebook
Share on Facebook

 Share by Email
Share by Email

 Print this page
Print
TL;DR: Customer Zero proves a unified observability model—ingest → detect → investigate → automate response—on a single platform for faster, end-to-end operations.
Summary:
- Unified ingestion: Elastic Agent, OpenTelemetry, agentless → Kibana
- Proactive monitoring: Synthetics, TLS checks, Stack Monitoring
- Faster response: Elastic AI Assistant, Elastic Workflows, Connectors (e.g., Slack, PagerDuty, ServiceNow)
- Customer zero: Elastic runs on Elastic Observability
Customer zero
At Elastic, one of the best ways to validate the power of observability is to use it on ourselves. That is the idea behind Elastic on Elastic: using Elastic's own platform to collect telemetry, monitor service health, detect issues early, accelerate investigation, and automate response across our internal and external systems.
Elastic has long embraced this as part of its "customer zero" mindset. We don't just validate product capabilities; we discover the real operational workflows, pain points, and best practices that matter to our customers. This approach drives innovation and ensures our platform works at scale in mission-critical environments.
In this blog, we share how we use Elastic Observability, synthetics, connectors, Elastic AI Assistant, Elastic Workflows, and Stack Monitoring to build a unified operational model that spans data ingestion, visibility, alerting, investigation, and automation. The result is a connected operating system for observability — one where telemetry flows seamlessly from sources, correlates in dashboards, surfaces context through AI, and triggers intelligent actions.
Building the observability foundation
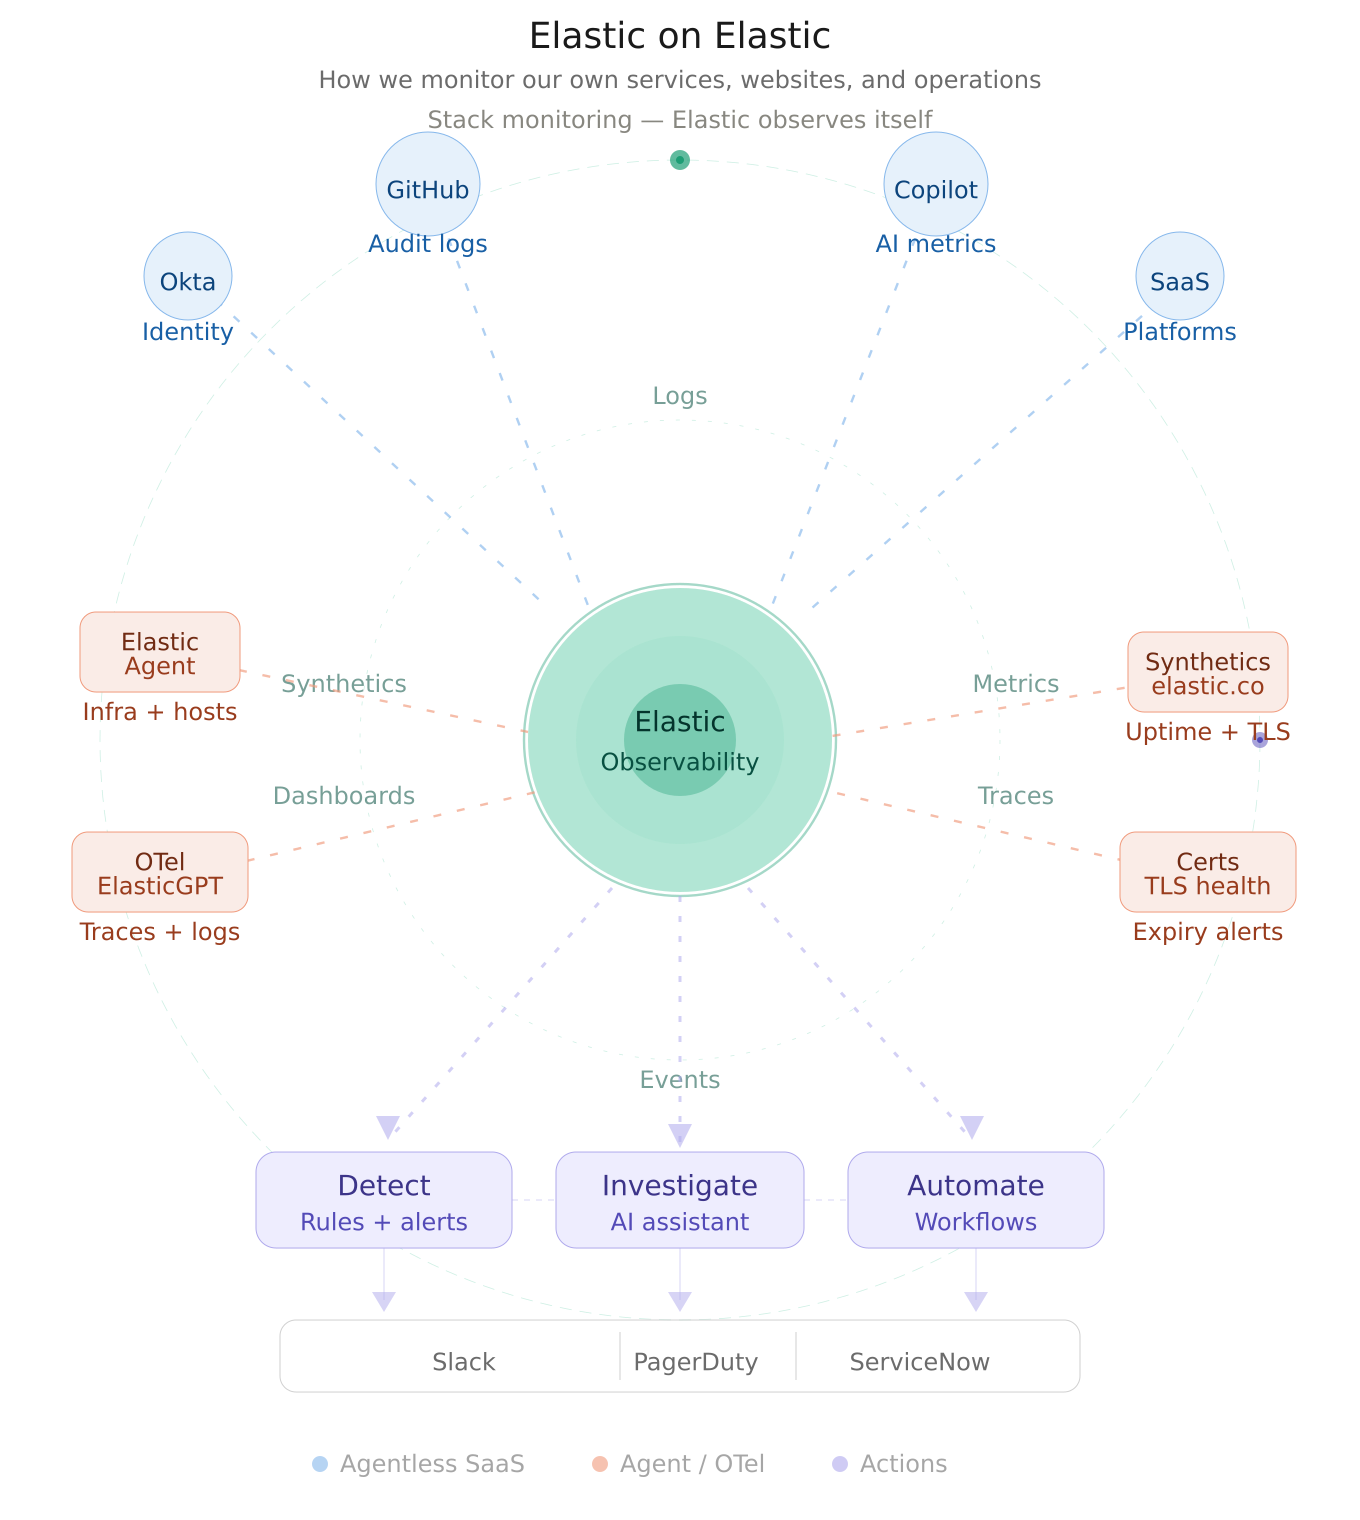
Our environment brings together data from a broad mix of operational and business-critical sources. We ingest SaaS and platform signals using both agentless integrations and Elastic Agent, pulling in events from services, such as identity platforms (Okta), developer systems (GitHub audit logs), AI metrics (Copilot metrics), and other operational tools.
A key part of this model is flexibility in data collection. Some sources are easiest to onboard through agentless integrations — they require minimal setup and zero operational overhead. Others are better served through Elastic Agent, which gives us a consistent way to collect logs, metrics, and events from hosts, services, and Elastic products themselves. That dual approach lets us reduce operational friction where possible while maintaining consistency for infrastructure and services that benefit from agent-based collection.
We also centralize application telemetry from internal services. For example, we send OpenTelemetry data from ElasticGPT — our internal generative AI service — directly into Elastic. This means application logs, distributed traces, and runtime signals live alongside the rest of our operational data in one place. Instead of context-switching between multiple tools, teams can investigate end-to-end behavior in a single environment.
Why unified ingestion matters: When telemetry from identity systems, applications, infrastructure, and SaaS platforms all arrive in the same place, operators can move from "something is wrong" to "what changed, what's impacted, and what should I investigate first" in seconds.
Once the data lands in Elastic, dashboards become the shared operational layer. Instead of checking one tool for authentication events, another for application health, and another for availability checks, teams correlate everything in a common workflow. A responder can move from a service symptom to the supporting telemetry around identity changes, audit activity, synthetic failures, and application behavior far more quickly when the underlying data is already connected. That unified experience is one of the core strengths Elastic Observability delivers.
Monitoring the digital experience
One of the most visible parts of our Elastic on Elastic practice is monitoring our own web properties. We use synthetic monitoring to track the availability of Elastic websites and subdomains, including business-critical surfaces like elastic.co, buy.elastic.co, learn.elastic.co, and more.
Elastic synthetics support both lightweight and browser-based monitors, whether they are managed directly in the UI or externally through synthetics projects. This gives us the ability to monitor both simple uptime — a quick HTTP check — and more realistic end-user journeys that simulate how customers interact with our sites.
Certificate health as a first-class operational concern
Availability alone is not enough. We also use synthetics-related capabilities to watch TLS and certificate health. Elastic supports TLS certificate rules that notify teams when monitored certificates are approaching expiration thresholds or exceed configured age limits.
This might seem like a small detail, but it matters enormously. Certificate expirations are predictable, yet they lead to unexpected outages every year across the industry. By treating certificate health as a first-class operational signal (right next to uptime and endpoint availability), we ensure it's monitored, alerted, and actionable rather than a separate manual process buried in someone's task list.
The same platform that detects service failures also prevents credential failures. That's the power of unified observability.
From detection to action
Observability becomes far more valuable when it connects directly to action. Elastic provides a connector framework in Kibana that centralizes integrations with downstream tools, such as Slack, PagerDuty, ServiceNow, and many more. We use these connectors to push notifications, trigger incidents, and route issues into the systems where responders already work.
Instead of treating dashboards as the endpoint of the observability journey, we use them as the start of an operational workflow. An alert fires in Elastic, and in that same moment:
A notification flows into the on-call team's Slack channel
An incident is automatically created in PagerDuty with full context
ServiceNow receives a notification to create an ITSM ticket for tracking
The relevant responders are paged according to escalation policies
This reduces the inefficiency of manually copying data between tools and helps keep investigation, communication, and remediation aligned. Elastic's connector and alerting model is designed precisely for this kind of integrated response path.
The result is faster incident response. Responders don't need to search for the alert details; the context arrives with the notification. And because it all originates from Elastic, the source of truth remains in one platform.
AI-assisted investigation
For our incident management teams, the Elastic AI Assistant adds another layer of operational efficiency. Instead of manually pivoting across multiple screens to gather context — e.g., checking dashboards, reviewing logs, and examining traces — responders can ask questions and retrieve relevant information from within Elastic.
Consider a typical incident workflow without an AI assistant:
Alert fires: "Service latency exceeded threshold"
Responder navigates to the service dashboard to see the symptom.
Responder checks infrastructure metrics to see if resources are constrained.
Responder searches logs for errors or warnings.
Responder looks at distributed traces to understand the code path.
Responder correlates findings and forms a hypothesis.
Responder begins investigating the root cause.
With the Elastic AI Assistant:
Alert fires: "Service latency exceeded threshold"
Responder opens Elastic and asks: "What happened to the checkout service in the last hour? What changed?"
Elastic AI Assistant returns: "Latency increased 40% at 14:23 UTC. Database query count doubled. A new deployment went live at 14:20. Here are the related errors."
Responder begins targeted investigation with context already in hand.
That matters most during fast-moving incidents. When teams are under pressure, the ability to ask for related signals, summarize activity, or surface supporting context can shorten the path from detection to understanding by minutes. Rather than replacing expert analysis, the assistant helps reduce the time spent gathering scattered information so teams can focus on decisions and response.
Automating the response path
We are also using Elastic Workflows to automate operational tasks inside Elastic. Elastic describes workflows as reusable, versionable recipes made up of steps that transform inputs into actions.
For an operations or incident management team, this opens the door to standardizing repetitive tasks:
Enrich alerts: When an alert fires, automatically look up related services, dependencies, and recent changes
Gather context: Automatically query for correlated logs, metrics, and traces and attach them to the incident
Route intelligently: Route incidents to the right team based on service ownership, escalation policies, or on-call schedules
Trigger follow-up actions: Create ITSM tickets, post to communication channels, or trigger remediation scripts
Standardize response: Ensure every incident follows the same triage and investigation path
This is an important part of Elastic on Elastic because observability maturity is not just about collecting more telemetry. It is about making that telemetry operationally useful. Workflows help encode the steps teams would otherwise perform manually, allowing the platform to support not only detection and investigation, but also repeatable, consistent response.
Over time, well-designed workflows reduce mean time to resolution (MTTR) and mean time to detect (MTTD) because teams aren't context-switching or performing manual data gathering—the platform handles that automatically.
Monitoring Elastic with Elastic
Elastic on Elastic would not be complete without using Elastic to monitor the Elastic platform itself. We rely on the Stack Monitoring feature where the rest of the other elastic deployments can send the status of its own health.
Stack Monitoring includes purpose-built dashboards that help teams understand the health and performance of Elastic services:
Elasticsearch cluster health: Node status, shard allocation, indexing and search performance
Kibana performance: Response times, request volumes, error rates
Logstash pipeline health: Throughput, lag, processing times
Agent connectivity: Which agents are connected, dropped connections, version distributions
This closes the loop in an important way. We are not only using Elastic to observe websites, SaaS platforms, and internal applications; we are also using Elastic to observe the observability layer itself. That reinforces the customer zero model: the same platform used to detect issues elsewhere is also used to ensure the reliability of the platform that powers those insights.
Why this model works
What makes this approach powerful is not any single feature in isolation. It is the continuity across the entire lifecycle:
Ingest data from a wide range of sources (e.g., agentless, agent-based, OpenTelemetry, APIs)
Correlate that telemetry in one platform with unified dashboards
Validate user-facing availability with synthetics
Monitor certificate health proactively
Detect anomalies and threshold breaches with rules
Notify responders through integrated connectors
Accelerate investigation with AI Assistant
Automate repetitive tasks with Workflows
Monitor the Elastic stack itself with Stack Monitoring
Elastic Observability is explicitly designed to support this unified lifecycle across detection, understanding, and response. That is what Elastic on Elastic means in practice: not just using Elastic as a logging tool or a dashboarding layer, but running a connected operational model on top of it.
When telemetry, context, alerting, investigation, and automation all live in the same ecosystem, teams can move faster and operate with more confidence. You don't lose context switching between tools. You don't repeat data gathering steps. You don't have blind spots because different tools have different data retention or lag.
You have one source of truth, one place to ask questions, one place to take action. That is the operating model that drives operational excellence at scale.
Trust in the platform
Elastic on Elastic is ultimately about trust in the platform. We use Elastic to monitor our services, websites, connectors, workflows, synthetic checks, application telemetry, and Elastic deployments because the platform is strongest when it becomes the operational backbone rather than just one tool among many.
It gives us a way to move from data collection to action in a single environment. And that is what makes observability genuinely useful at scale. If you want to try this approach for your own organization, Elastic makes it straightforward to get started:
Start with agentless integrations for SaaS platforms like Okta and GitHub.
Deploy Elastic Agent for comprehensive infrastructure and application monitoring.
Stream OpenTelemetry data from custom applications.
Set up synthetics for external monitoring of critical endpoints.
Configure connectors to route alerts to your existing workflows.
Enable the Elastic AI Assistant to accelerate investigation.
Build Workflows to automate incident response.
Monitor your platform with Stack Monitoring.
The release and timing of any features or functionality described in this post remain at Elastic's sole discretion. Any features or functionality not currently available may not be delivered on time or at all.
In this blog post, we may have used or referred to third party generative AI tools, which are owned and operated by their respective owners. Elastic does not have any control over the third party tools and we have no responsibility or liability for their content, operation or use, nor for any loss or damage that may arise from your use of such tools. Please exercise caution when using AI tools with personal, sensitive or confidential information. Any data you submit may be used for AI training or other purposes. There is no guarantee that information you provide will be kept secure or confidential. You should familiarize yourself with the privacy practices and terms of use of any generative AI tools prior to use.
Elastic, Elasticsearch, and associated marks are trademarks, logos or registered trademarks of elasticsearch B.V. in the United States and other countries. All other company and product names are trademarks, logos or registered trademarks of their respective owners.
Share
- Share on Twitter
Share on Twitter
- Share on LinkedIn
Share on LinkedIn
- Share on Facebook
Share on Facebook
- Share by Email
Share by Email
- Print this page
Print