SRE manager’s guide to OpenTelemetry
Explore our comprehensive guide to OpenTelemetry (OTel), designed to help IT leaders understand and prepare for this rapidly growing industry standard.


 Share on Twitter
Share on Twitter

 Share on LinkedIn
Share on LinkedIn

 Share on Facebook
Share on Facebook

 Share by Email
Share by Email

 Print this page
Print
OpenTelemetry 101

First the cloud, now OpenTelemetry
Remember the time before cloud computing? Now that the cloud is the standard, emerging technologies around the cloud are taking the same journey from obscurity to ubiquity. Imagine being the first to adopt the cloud — then imagine being the last. Who would you rather be?
Today, OpenTelemetry (OTel for short) is where the cloud was in the late 90s. OTel is moving from mere experimentation by the innovative few to a de facto standard that laggards will eventually try and adopt. OTel is an open source observability framework that lets development teams generate, process, and transmit telemetry data, such as metrics, traces, logs, events, and profiles, in a consistent, unified format. Since its foundation in 2019, the likes of Google and Microsoft have contributed to the project, helping propel its exponential growth and secure its footing as the next standard of observability.
As a critical component of observability practices in the ever-expanding cloud space, OTel will soon be a cornerstone of best business practices. Right now, if we were to chart it on a curve, savvy SRE teams are here: firmly in the stages of early adoption. The data shows huge upticks in OTel usage over the past few years — proving that OTel is rapidly gaining traction and moving confidently toward an early majority adoption.
In other words: Don’t sleep on OTel. Getting in early has a positive snowball effect on forward-thinking organizations — and the industry at large. They get a leg up on the competition, improve their operational resilience in the wild wild west of observability, and earn the prestige of being the group who helped establish this new industry standard.
To truly unlock the potential of OTel at the forefront of data, let’s get into the weeds of OpenTelemetry: what is it, why care, and what next?
Introduction
Management of your ever-evolving digital environment, stretched across multiple clouds and on-premises, is constantly expanding with data. Approximately 402.74 million terabytes of data are created each day. It's estimated that 90% of the world's data was generated in the last two years alone1.
But that operational data often isn't consistent. Each component in your system can emit a telemetry format, resulting in mixed signals. Inconsistent data formats are a major challenge for SREs. The variety of data stream types and quality levels makes understanding what's working and what's not working in your systems harder than ever. Traditional monitoring tools and systems don't cut it anymore, and this is where a modern, unified observability platform comes in.
Observability answers the need to see your ecosystem holistically and correlate data across functional teams and through data silos to obtain meaningful insights that guide action. With an effective observability solution in place, developers can innovate faster while maintaining high reliability, and business leaders can make informed decisions that boost revenue. In this way, modern observability is key to operational resilience — and business success. However, effective observability is only as good as the data it relies on.
Consistent, high-quality telemetry data is key to a modern observability solution. However, generating and transmitting this type of telemetry consistently would require a massive and unsustainable engineering effort that goes beyond coding. Developers would have to align around protocols and semantic conventions for tags, attributes, and other metadata, looking down the barrel of intense labor for weeks on end. So, what's the alternative? Turnkey telemetry and open standards offer fast time-to-value, enable setting reasonable defaults that allow customization, pair with quality documentation, and most importantly, offer telemetry data that doesn't lock users in with a vendor. Why? Because efficient, future-proof observability requires that you own the data you generate and that you learn only a single set of APIs, data standards, and conventions.
Enter OTel, whose mission is to enable effective observability by making high-quality, portable telemetry the new standard.
A brief history of OpenTelemetry
As observability gained traction to meet the requirements of cloud computing, the need for a code instrumentation and telemetry data standard became apparent. Google's 2010 Dapper Paper chronicles its journey to creating Dapper, a predecessor of OTel that aimed to consolidate monitoring tools and simplify DevOps processes.
Google's developers weren't the only ones who saw a gap in the data ecosystem. The Cloud Native Computing Foundation (CNCF) projects, OpenTracing and OpenCensus, were trying to solve this problem. Unable to do so independently, they merged to form a single solution: OpenTelemetry.
Accepted by CNCF in early 2019, the OTel project has since matured into the incubation stage, following in the steps of projects like Kubernetes and Prometheus (with which OTel also collaborates — more on this later).
Since its inception, OTel has grown based on the principles that telemetry data should be:
- Universal: Unified telemetry protocols and conventions across languages and signals — metrics, logs, traces — are key to effective modern observability.
- Easy: The goal is to simplify telemetry for the end user with quick value outcomes and customizations that are supported by thorough documentation.
- Vendor-neutral: Proprietary monitoring agents that lock users in, no more. As an open source project, OTel enables flexibility and innovation.
- Loosely coupled: End users should be able to pick and choose which parts of the telemetry pipeline they need. This modularity is essential for flexibility, adaptability, and scalability.
- Built-in: Telemetry doesn't have to be added after the fact — it should be built into the entire software stack.
These principles remain the foundation of OTel — and the source of its benefits.
Benefits of OpenTelemetry
At a glance, OpenTelemetry offers organizations improved observability practices through its standardized data collection and future-proof flexibility. The result? Increased efficiency and lower operational costs over the long term.
But what does that look like for your operations and your systems? OTel is the gateway to:
- Unified data collection: OTel offers a single API and SDK for collecting metrics, traces, and logs. This simplifies the integration process, reduces the need for multiple data collection tools, and minimizes data transformation work.
- Improved troubleshooting: By providing consistent telemetry data, OTel makes it easier to troubleshoot issues in distributed systems. Developers can quickly correlate metrics, traces, and logs to identify the root cause of problems more effectively.
- Future-proofed observability: OTel’s open standards protect organizations from being tied to specific monitoring vendors, allowing flexibility in choosing observability back ends. This ensures a future-proof solution that can adapt to changing requirements.
- Increased team efficiency: SRE teams benefit from streamlined instrumentation, reducing the complexity of managing multiple tools. This leads to improved response times for incidents, faster problem resolution, and greater overall productivity.
In a 2025 study by EMA, improved IT Operations and developer productivity, simplified metrics collection, and greater visibility into software and systems were cited as top observability benefits.
OpenTelemetry: A strategic decision
Current data trends indicate that the amount of data produced and processed by organizations will continue to grow. In fact, it's set to grow faster than ever before. Making sense of this data now is crucial to operations; making sense of the data in the future requires technological foresight. Open standards are key building blocks in observability architectures that will withstand the test of time — and the breakneck pace of innovation. OpenTelemetry's key tenet is in its name: open standards. In other words, no vendor lock-in.
Let's look back at the adoption curve, where OTel has secured its spot in the early adoption wave. This also means that early adopters are gaining a competitive advantage: By choosing a vendor-agnostic telemetry data framework that feeds into their observability solutions, early adopters are not only future-proofing their operations, they're also making strides to improve their operational resilience from the ground up. In an increasingly volatile world, achieving operational resilience, at least from a technology perspective, is paramount to business success. In other words, embracing OTel prepares organizations for the data demands of the future with no strings attached and without the limitations of their current technologies. It's a valuable leg up on the competition in the short and long term.
The current state of OpenTelemetry
Trending: Growth and adoption
Since 2019, OTel has grown exponentially. It has added 9,160+ contributors, 55,640+ code commits, 67,250+ pull requests, 466,000+ contributions, and 1,100+ contributing companies — and it’s still just getting started.
As OTel becomes the next standard in observability, a new ecosystem of tools and technologies is emerging to support it. SRE teams are driving growth in their ecosystems and solving challenges of expansion as they go. Data continues to grow and organizations need new ways to manage it. So OTel is growing to serve the needs of businesses before they know they have them.
At the beginning of 2024, OTel was the second most active CNCF project after Kubernetes2. As the demand for telemetry standardization and cross-platform compatibility grows, more organizations move toward OTel. However, many enterprises get tripped up reinstrumenting legacy applications and converting existing monitoring runbooks. Hence the need for open source, open standards platforms that offer flexibility and easy adoption.
OTel adoption can be challenging — but is it worth it? Challenges include concerns about OpenTelemetry support (49%), feeling a need to wait for increased adoption (49%), lack of vendor support (34%), and insufficient OTel maturity (31%).3
With new capabilities added all the time, OTel adopters get a front row seat to the cutting edge of tech. Despite the concerns, organizations adopting OTel often receive enhanced support from cloud providers and vendors who have implemented it — not to mention engineers who are excited to help customers implement a new technology. The benefits of adopting a unified, open source telemetry framework are worth the hurdles faced along the way.
The monthly velocity of the OpenTelemetry is trending skywards as OTel secures its footing as the new standard in telemetry. OTel’s footprint in the observability space is steadily increasing as it gains industry approval. Just look at the latest top contributors: Splunk, Elasticsearch, Honeycomb, and Datadog — to name a few.
But more importantly, support for OpenTelemetry from the primary cloud hyperscalars has been robust over the past year. Amazon, Microsoft, and Google are in the top 25 organizations contributing to the project. Some concrete examples of cloud vendor support include: AWS distro for OpenTelemetry, Azure Monitor OpenTelemetry Distro, along with key contributions from Google mentioned earlier.
Elastic contributed our universal profiling agent to OTel, marking a significant milestone in the establishment of profiling as the fourth telemetry pillar for modern observability. This, too, represents a steady step toward unified observability.
How reliable is OTel, really?
Concerns about OTel’s maturity stem from the need to understand its reliability.
OTel develops signals like metrics, traces, logs, and baggage incrementally, building them on top of context propagation. Every signal consists of APIs, SDKs, OpenTelemetry Protocols (OTLPs), and a Collector, and every component cycles through draft, experimental, stable, and deprecated phases.
The OTel tracing specification is now completely stable, while metrics and logging are currently used in production with one component in development: SDK and event API, respectively.4 From the data standpoint (Semantic Conventions), the traces, metrics, and resources Semantic Conventions are defined as Mixed for status. Meanwhile, the Logs Semantic Conventions is trailing with a status of In Development. But not to worry, the Semantic Conventions are always evolving for new use cases while remaining highly stable for most standard observability scenarios.
Despite the evolving nature of OTel, industry sentiment is actually largely positive. According to the 2025 EMA survey, over 50% of respondents felt OpenTelemetry was mature enough to implement. However, an overwhelming 90% felt that OpenTelemetry was moderately important, very important, or critical. Like any developing industry standard, the direction of growth is key to understanding the underlying industry adoption trends.
What to watch: Upcoming OTel and CNCF projects
Several tools within the CNCF ecosystem are gaining traction as part of the broader OpenTelemetry landscape:
- Open Agent Management Protocol (OpAMP): OpAMP simplifies the management of telemetry agents across distributed environments at scale. It provides centralized control over agent configurations and facilitates monitoring and diagnostics, streamlining the way organizations handle their observability agents. This is particularly beneficial for large-scale deployments where managing thousands of agents manually can be daunting.
- Profiling: A recent contribution by Elastic, profiling allows developers to understand the behavior of software applications by collecting information about its execution. This feature can be invaluable for diagnosing bottlenecks, improving application performance, maximizing resource utilization, reducing carbon footprint, and optimizing cloud spend.
- Prometheus: While Prometheus was already a widely adopted tool for metrics collection, its integration with OpenTelemetry further strengthens OTel’s capabilities in metrics monitoring. Prometheus serves as a back end for OpenTelemetry metrics, providing deep insights into application and infrastructure performance.
Does OTel comply with data security requirements?
Open standards ensure transparency and adaptability, and unified signals go one step further: They simplify data storage and processing, helping organizations improve security and meet regulatory requirements. Many compliance frameworks (PCI DSS, SOC 2, GDPR) require detailed observability and logging for future audits.
Data uniformity is an invaluable piece of security monitoring, a landscape that has progressively become more treacherous for organizations worldwide. Traces let security teams identify how a request moves through their systems after an incident, while logs and traces help reconstruct attack timelines and identify affected components. As a key part of a modern observability solution, OTel gives organizations visibility into their systems to handle security vulnerabilities quickly and effectively — or even prevent threats before they evolve. When OpenTelemetry is used for CI/CD pipelines and DevSecOps tools to monitor deployments, unauthorized changes can be detected, protecting code before it is even pushed to production.
Unified telemetry data can reduce MTTR and position security teams proactively with clearer visibility. As OTel evolves, it also ensures compliance for your whole system, updating to new industry standards over time.
How does OTel work for observability?
The core idea behind OTel is to provide visibility into distributed systems by collecting data from different layers of the tech stack in a standardized way. Why is it such a big deal? OTel addresses key issues like vendor lock-in and the need for proprietary agents. It enables vendor-agnostic instrumentation. Users can collect telemetry in a common format and export it to any compatible observability back end. This standard approach simplifies data collection and promotes consistent metadata across different signal types.
Part of the standardization effort relies on semantic conventions. These standardized naming conventions define how telemetry data is structured and ensure consistency across the different types of telemetry data (metrics, traces, logs) collected from various applications and environments. By aligning telemetry data formats — and their users — OTel semantic conventions improve interoperability between tools. The result? Improved visibility. To further support the observability goals of organizations, OTel also relies on these key components:
Collector
The OpenTelemetry Collector, a vendor-agnostic proxy, facilitates receiving telemetry data in multiple formats, as well as processing and filtering telemetry data before it gets exported.
Language APIs and SDKs
Using the OpenTelemetry API, OTel language SDKs allow you to generate telemetry data with a language and export the data to a back end.
A variety of programming language SDKs are supported by OTel, including Java, Python, Go, C++, and JavaScript, making OTel versatile and accessible to diverse development environments.
Instrumentation libraries
Instrumentation is the process of getting components in a tech stack to emit telemetry data, such as logs, metrics, and traces. SREs can instrument their code via code-based or no-code solutions. Native OTel library instrumentation offers developers a better user and observability experience. The advantage of instrumentation libraries is that telemetry signals can be fine-tuned and these same signals, because they are coherent, can be correlated. The latter is instrumental to holistic observability.
Automatic instrumentation
A language-specific implementation of OpenTelemetry can provide a way to instrument your application without having to change your source code.
How OTel is changing the value of observability
Complex problems require examination from multiple vantage points. And complex problems are the norm in complex digital environments. The ability to collect and correlate data from multiple sources simultaneously — and efficiently — relies on the standardization of signals.
By standardizing tracing, metrics, and logs, OTel paves the way to eliminating data silos that hinder effective observability. OTel and standardization of observability data paves the way for easy correlation between signals through common metadata and increases the effectiveness of ML/AI to provide actionable insights in increasingly complex environments.
So, OTel not only enables faster anomaly detection and root cause analysis, it also serves as a foundation for proactive site reliability and risk management.
In fact, the EMA survey report found a clear correlation between observability maturity and OpenTelemetry adoption — 61% of respondents with a mature observability practice are already using OpenTelemetry, while only 1% are not.
In an increasingly volatile world, operational resilience is key to business continuity and OTel is the missing piece in the modern observability framework that safeguards operations and promotes innovation.
How does OTel deployment work?
OTel deployment varies based on the needs of your organization, and three official deployment patterns exist: no collector, agent-based, and gateway.
This deployment connects the OTel SDK directly to your back end. It’s an easy-to-use solution for development and testing environments, and it creates no additional moving parts in a production environment.
In this pattern, the OTel SDK sends telemetry data to the OTel Collector, which is configured to forward the data to one or more back ends. While this solution may pose scaling challenges, it is easy to set up and offers clear mapping between the application and collector.
Gateway deployment means implementing applications that send telemetry data (using the OpenTelemetry protocol) to a load balancing exporter that distributes signals to a set of OTel collectors. These, in turn, send telemetry data to one or more back ends. While this deployment adds a layer of complexity, it also checks the security box: It can filter or sample certain logs.
Integrating OTel into your environment
Integrating OTel into your environment can give you signal convergence, data ownership, and future-proof observability. Successful deployments of OpenTelemetry should start small and increase gradually. But how do you get started?
Step 1: Assess your technology stack
By understanding the state of your current observability solution, you can pinpoint which OTel components you need. Your current system and your goals determine which solution will be most impactful. When assessing your technology stack, you'll want to:
- Determine what monitoring and logging solutions are already in place, such as Prometheus, Grafana, Jaeger, or other APM tools.
- Identify areas where your current setup lacks visibility, such as missing traceability across services or inefficient log correlation.
A thorough assessment of your current observability setup will allow you to establish clear integration goals. As with any tech migration, starting small and specific is key.
Step 2: Instrumenting OTel: What’s the right way forward?
Two primary paths exist on the OTel integration journey: code-based and zero-code instrumentation.
Instrumenting OTel begins with identifying your why. Do you develop software? Are you looking to get observability by writing code? Is your goal to have your dependencies automatically emit telemetry data? If yes, then code-based instrumentation is your way forward. (Start out with zero-code and then add custom code/manual instrumentation as needed.)
If instead, you’re looking to get telemetry data out of the applications you run without touching their code and send this telemetry data to your observability back end, then zero-code instrumentation is for you.
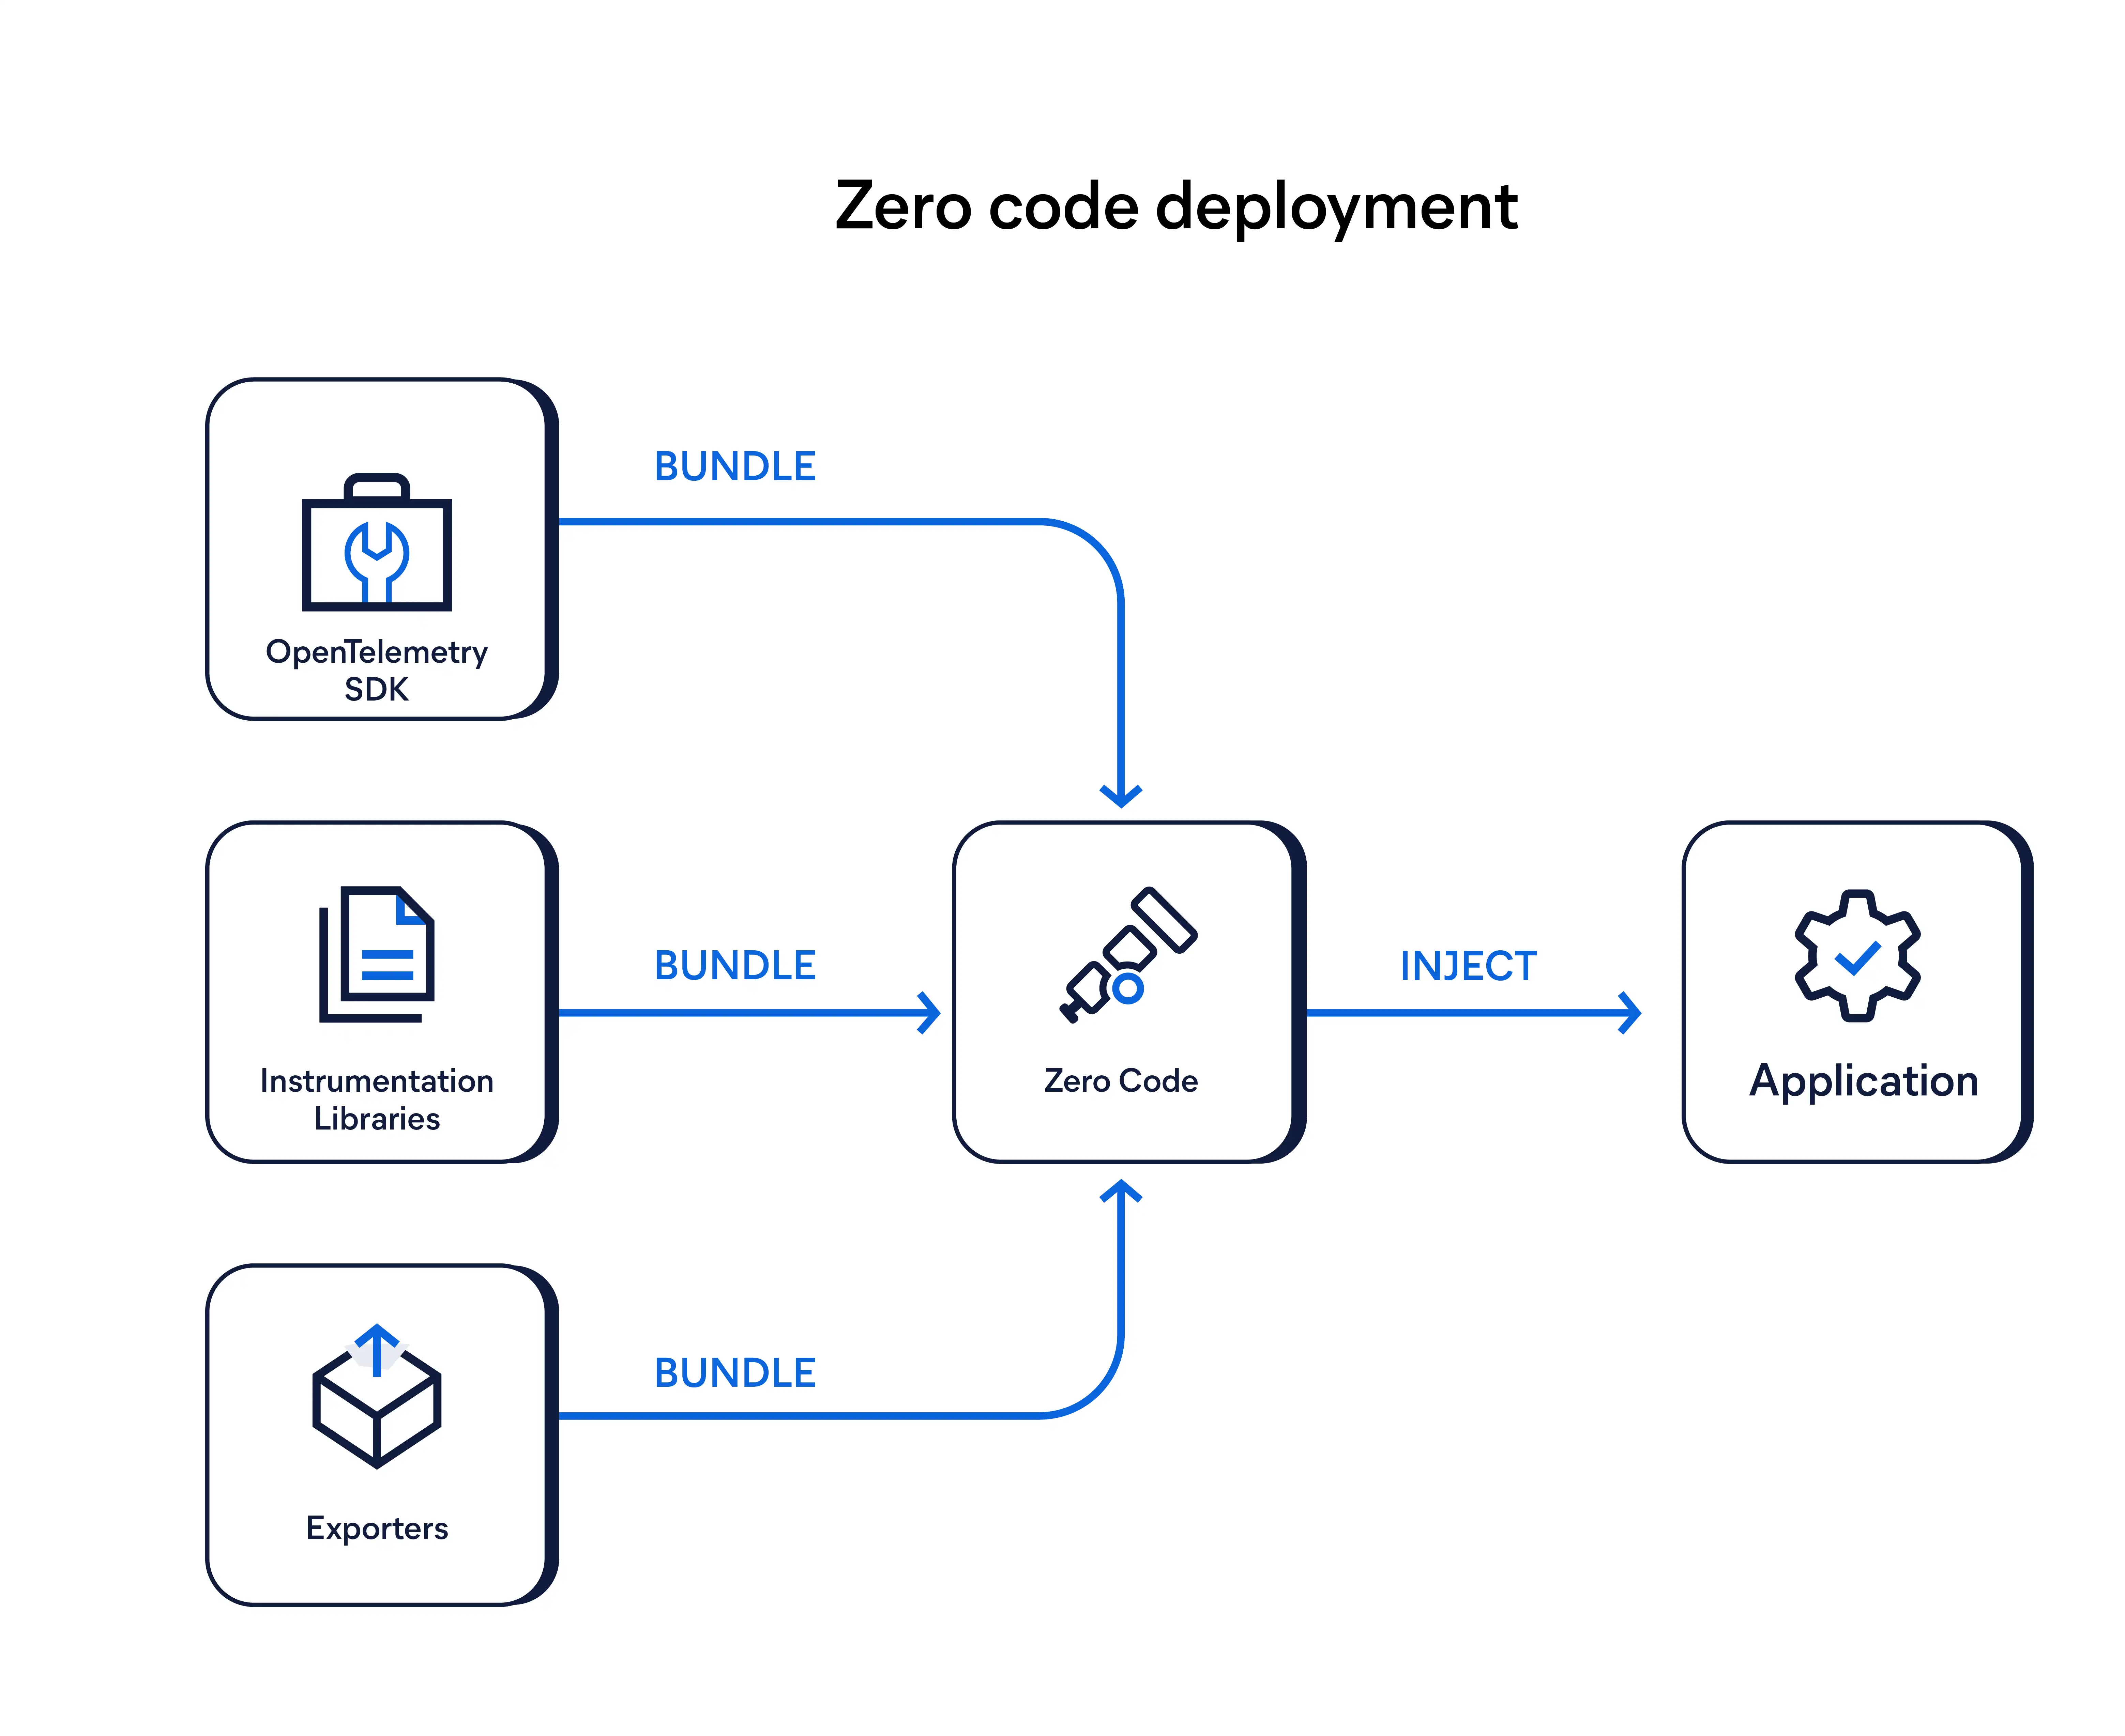
Auto-instrumentation (or zero-code deployment)
Zero-code instrumentation is a straightforward, plug-and-play solution that makes piloting an OTel use case easy. By automatically capturing data from an established library or framework — no code change required! — you can begin collecting signals within minutes. (You can install the OpenTelemetry Kubernetes operator with a single command.)
Code-based instrumentation
To instrument your application’s code, you need to choose a code-based instrumentation approach. This process involves a few key steps: importing the OpenTelemetry (OTel) API and SDK, configuring them to suit your application's needs, generating telemetry data (traces, metrics, and logs), and exporting that data to your back end or an OTel Collector for further analysis.
Keep in mind: OTel integration becomes fairly technical fairly quickly. Implementation can hit a speed bump as the process quickly gets very technical, creating friction in the adoption journey. Set this expectation for yourself and your team and forge ahead.
Step 3: Create a migration plan
Now that you have a better understanding of your options, it's time to build a migration plan.
- Select initial services for OTel integration: Begin with a pilot project focusing on your most critical services. This approach allows you to identify and resolve implementation issues before rolling out OpenTelemetry across your entire infrastructure.
- Choose deployment method: Decide whether you will use OTel's auto-instrumentation capabilities, manual instrumentation, or a combination of both. Begin with basic instrumentation and gradually increase coverage based on actual needs rather than theoretical possibilities.
- Map out data flow: Define how telemetry data will be collected, processed, and exported to observability back ends.
- Address security and compliance: Ensure that the collection and transmission of telemetry data comply with security and regulatory requirements.
- Establish success metrics: Define what success looks like by setting clear, measurable objectives for your OTel migration. Identify key performance indicators (KPIs) such as improved trace coverage, reduced mean time to detection (MTTD) and resolution (MTTR), lower observability costs, or increased system reliability.
- Implement performance benchmarking: Before deploying OpenTelemetry agents, establish baseline performance metrics for your services. Monitor these metrics closely as you add instrumentation to identify and address any performance impact quickly. Some commonly seen areas where performance issues may arise would be database performance, excessive disk I/O operations and bottlenecks, along with high CPU loads.
- Create service-specific instrumentation strategies: Different services may require different approaches to instrumentation. Develop clear guidelines for each service type, considering factors like traffic volume, criticality, and resource constraints. This targeted approach helps prevent over-instrumentation while ensuring adequate visibility where it matters most.
Leadership talking points
As with any major technological shift, strong top-down support is critical to success. Consider these arguments when pitching OpenTelemetry to the C-suite:
In the 2025 EMA survey report, over 60% of respondents reported IT operations and developer productivity increased by over 20%. OpenTelemetry helps immensely with the management of Kubernetes and cloud deployments due to benefits such as simplification of telemetry data collection, enhanced visibility across microservices, and improved troubleshooting and RCA.
OTel moves observability beyond logs. It is a low- to no-cost deployment, enables companies that are tracing to do more of it, increases correlation accessibility, and standardizes naming across the board. This results in a more structured observability framework and, as a vendor-agnostic solution, OTel not only reduces vendor lock-in but also maximizes ROI by delivering deeper insights with greater efficiency.
Step 4: Training and skill development
Successful adoption of OpenTelemetry requires that teams are adequately trained in its core concepts, tooling, and best practices. As part of your OTel migration efforts, consider:
- Workshops: Conduct practical workshops to demonstrate instrumentation, data collection, and analysis.
- Certifications: Explore certifications and learning resources offered by the OpenTelemetry community to empower team members.
- Internal knowledge sharing: Establish a forum or group within your organization where engineers can discuss challenges, share learnings, and collaborate on OTel adoption.
Assigning specific roles in the migration is another valuable strategy for successful integration. Appoint observability champions to lead the OTel implementation and serve as internal experts. These observability champions should be DevOps team members, SREs, and application developers. Ensure that each observability champion has a clear role and stake in the migration effort.
Common pitfalls and gotchas when deploying OpenTelemetry
So your team has implemented OpenTelemetry (OTel) across your microservices architecture. You’re expecting crystal-clear visibility into your systems, but instead, you're staring at fragmented traces, unexplained performance dips, and gaps in your observability data. Sound familiar? You're not alone.
OpenTelemetry challenge #1: The context propagation puzzle
One major challenge in implementing OpenTelemetry: maintaining context propagation across diverse services. In a polyglot environment, different services might be written in Java, Python, Go, or Node.js. This makes consistent trace context a complex puzzle.
Consider a typical enterprise transaction. A user request might begin at a modern Node.js front end, travel through a Java-based authentication service, hit an IBM MQ message queue, and finally reach a mainframe running CICS transactions. Each hop risks context loss, potentially leaving you with incomplete traces and blind spots in your observability pipeline.
However, many business-critical systems are notoriously difficult to instrument with OTel and modern observability tools. Message brokers using JMS 1.0 or IBM MQ, mainframe systems running z/OS, middleware solutions like Tibco EMS, and even certain older versions of enterprise databases can all present significant instrumentation challenges.
To bridge these gaps, organizations can take a few different routes:
- Manual instrumentation can provide precise control over what you monitor and how you monitor it.
- Developing custom OpenTelemetry plugins is another solution (and, if you're feeling generous, contributing them back to the open source community).
- OpenTelemetry-compatible instrumentations are available for particularly challenging systems like mainframes or legacy message queues to illuminate traditional blind spots.
When all else fails, remember the humble log file — your observability safety net. Even the most ancient of mainframes and the most obscure of legacy systems generate logs. While not as sophisticated as distributed tracing, logs can provide crucial visibility into otherwise opaque systems. By collecting and analyzing these logs, you can maintain end-to-end visibility across your entire technology stack. Consider enriching these logs with correlation IDs or trace identifiers where possible, creating bridges between your modern observability tools and legacy systems.
What's particularly exciting is how modern large language models (LLMs) are breathing new life into legacy logging data. These AI models can analyze unstructured log data, identifying patterns and anomalies that might be missed by traditional, manual parsing methods.
They can help correlate seemingly unrelated log entries across different systems, suggest root causes for incidents, and even predict potential issues before they become critical. Your legacy logs aren't just a last resort — they're an increasingly valuable data source that can provide deep insights when combined with modern AI analysis techniques. This hybrid approach ensures you're never completely in the dark, even when facing the most challenging instrumentation scenarios.
OpenTelemetry challenge #2: The performance paradox
The promise of comprehensive observability is enticing. But don’t get too eager. Over-instrumentation can lead to unexpected performance issues. New OpenTelemetry agents running with default settings might collect more data than necessary, impacting system resources and lowering response times.
Beware the cardinality explosion! When instrumenting your services, it's tempting to add more and more attributes to spans and metrics for maximum visibility. However, this can quickly spiral into resource consumption issues and increased storage costs. High cardinality in span names and attributes can transform your observability solution from an asset into a long-term liability.
Your previous monitoring solution may have given you an easy button for reducing this cardinality. If so, these mitigations will need to be migrated over. Luckily there are a number of options here. The OpenTelemetry collector for example can preprocess the data so that it arrives in a low-cardinality format at your observability solution. When deploying new instrumentation, keep an eye out for this potential hurdle and be prepared to tune your OTel deployment as you deploy it.
OpenTelemetry challenge #3: Navigating multi-service environments
Heterogeneous environments present unique challenges for OpenTelemetry implementation. Different services may require different instrumentation approaches, and not all components can be instrumented equally. This disparity can result in inconsistent observability coverage and complicated troubleshooting workflows.
Backend compatibility adds another layer of complexity. Not all observability back ends fully support OpenTelemetry's specifications, risking data loss or reduced functionality. It's crucial to verify compatibility between your chosen back end and OpenTelemetry's various signals (traces, metrics, and logs).
While the path to open standards and interoperability is of high value, there will be bumps and bruises along the way to removing vendor lock-in. For now, understanding these common pitfalls and having strategies to address them puts you ahead of the curve in building robust, observable systems.
Conclusion: Increasing your observability maturity
Facing all this planning and these challenges might seem daunting, but the long-term health of your system will be well worth it. The key is to approach OpenTelemetry implementation with a clear strategy and realistic expectations. Perfect observability isn't achieved overnight — it's an iterative process that requires continuous refinement.
Focus on creating a sustainable observability practice that balances comprehensive monitoring with system performance. Regular audits of your instrumentation strategy, combined with performance tuning cycles, will help maintain this balance as your system expands and evolves.
The future of observability lies in finding the sweet spot between visibility and efficiency.
As OpenTelemetry continues to mature, many of these challenges will be addressed through improved tooling and best practices. Remember: The goal isn't to collect all possible data but to collect the right data that enables effective, continuously evolving systems. Start small, measure impact, and scale intelligently. Your future self (and your systems) will thank you for it.
Footnotes
1 Statista, “Volume of data/information created, captured, copied, and consumed worldwide from 2010 to 2023, with forecasts from 2024 to 2028”, 2024.
2 Sapphire, “Observability in 2024: Understanding the State of Play and Future Trends", 2024.
3 Dimensional Research and Elastic, "2024 Elastic Practitioner Survey", 2024.
4 OpenTelemetry, "Specification Status Summary", 2025.
Share
- Share on Twitter
Share on Twitter
- Share on LinkedIn
Share on LinkedIn
- Share on Facebook
Share on Facebook
- Share by Email
Share by Email
- Print this page
Print