Building software reliability with distributed tracing
Building software reliability requires a deep understanding of how your software's code executes without much room for guessing. Learn how distributed tracing can help with this while also terraforming the way for a much larger observability adoption.

 Share on Twitter
Share on Twitter

 Share on LinkedIn
Share on LinkedIn

 Share on Facebook
Share on Facebook

 Share by Email
Share by Email

 Print this page
Print
Most developers believe that building reliable software involves writing good code, implementing enough testing, and using as many proven architecture patterns as possible. The assumption is that building things this way equals creating a flawless system. Sadly, in the software world, this is not true. Software reliability is not the same as software correctness. You may write good code, implement enough testing, and use as many proven architecture patterns as possible to end up with software deemed correct. But, the code may still blow up straight on the customer's face.
Building software reliability is something else, entirely. It requires developers to look at the code, not from the perspective of what it is supposed to do but what the code is effectively doing, with little room for guessing. Distributed tracing is a technique you can use to accomplish this, and we will dive into the details for this post.
Looking for the code's perfect lap
One of the best things about the SRE culture is that developers become more conscious about the responsibility that lies in their hands. Instead of just writing code and building images that somebody else would use to build and deploy the system, they are responsible for overseeing the code move from pipeline to production. They need to ensure that the system is running as expected, which often means being on-call waiting for customers to complain about something. But they shouldn't need to wait until customers complain to take any action.
Ford v Ferrari is an American sports drama film from 2019 directed by James Mangold that tells the history of how Ford managed to defeat Ferrari at the 1966 24 Hours of Le Mans race in France. The plot follows a determined team of American and British engineers and designers, led by automotive designer Carroll Shelby and his British driver, Ken Miles. Although the movie is not only about him, Ken Miles was undoubtedly a vital element for the film. His character was inspired by the real Ken Miles, a British race car driver, and mechanic who became famous for his exploits within motorsports. Ken Miles’ unconventional take on mechanical engineering for racing helped him win some of the biggest races in the world.
There is a scene in the movie where Ken is talking with his son Peter Miles, where he’s trying to explain to the boy what it takes to win a race.
"If you're going to push a piece of machinery to the limit and expect it to hold together, you have to have some sense of where that limit is. Look out there. Out there is the perfect lap. No mistakes. Every gear change, every corner. Perfect."
The same applies to software engineering. It is somewhat impossible to get code running as expected if you have never tried the code in the right conditions that will determine if it may fail or not. After all, there's a difference between knowing the path and walking the path. When your code is executed in a staged environment, such as a unit testing platform, you assert if the code will satisfy the happy path scenarios that you hard-coded. Ultimately, this is going to assert the code's correctness. Another consideration is running the code in an environment that will reflect the many possible outcomes your code may have, such as a production environment. In that scenario, you are dealing with uncertainty.
Fortunately, you can transform this uncertainty into predictability with distributed tracing. By using an instrument-first approach, which is building instrumentation as you write the code for your software, you can have your code expressing its execution in a way that you can truly assess whether or not it produces the correct output. You can verify scenarios like "will the code behave the same if it runs not in one, but several Kubernetes pods?." You can think about this as a complex unit test case that could answer this question, but you didn't have to write it.
When your code is written along with instrumentation, you can start answering questions that may not have been asked during the system's design and implementation phases and ditch the embarrassment of not understanding your own code's behavior. You can use the production environment to debug your systems without the fear of breaking anything. Your code will be genuinely observable. But instrumenting the code alone doesn't do the magic. You also have to push your code to the limit.
Pushing the code to its limits is about pursuing the unknown unknowns, instead of just known unknowns. Every release you build, every function refactored, every new dependency added, you ought to check how the code behaves along with other components, see when it breaks, and identify all the unforeseen conditions. Ultimately, your job is to look for the perfect lap.
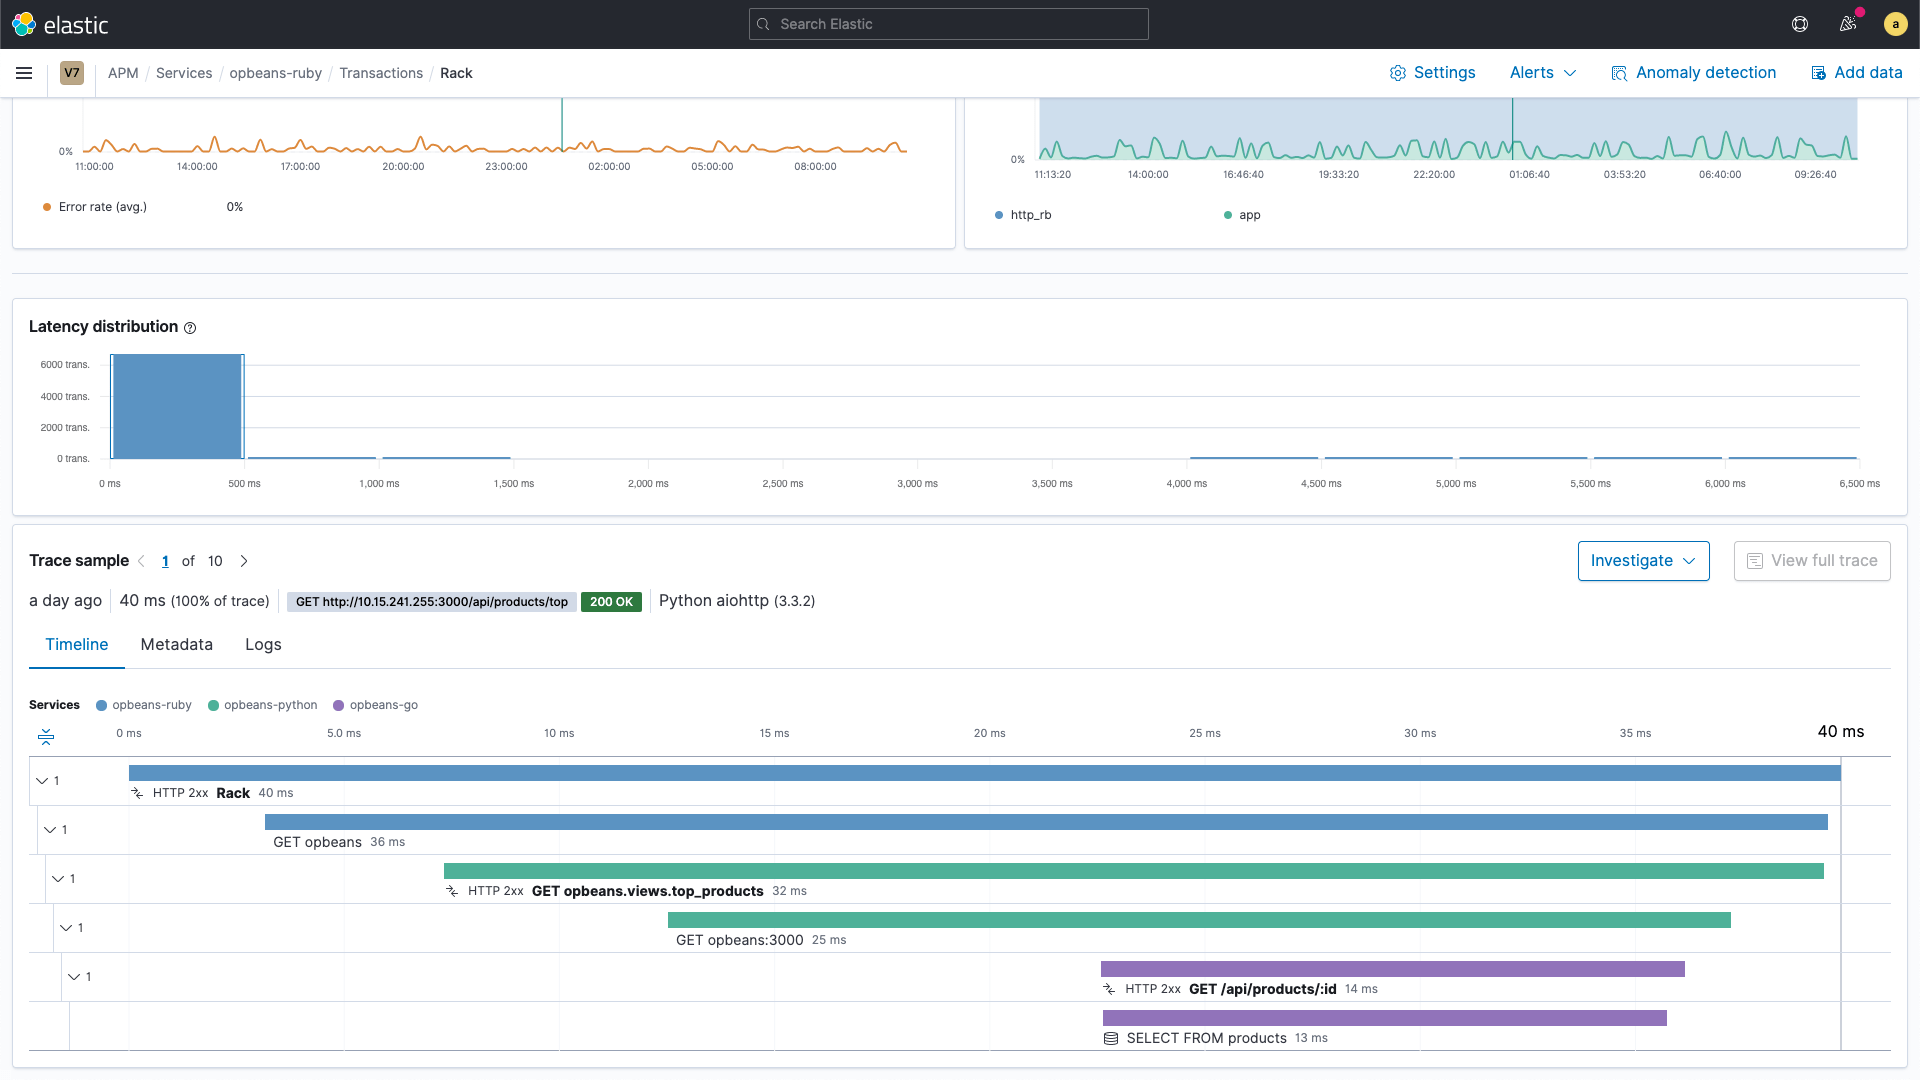
Figure 1 shows an example of a code instrumented using distributed tracing. The purpose of the instrumentation is to enable rich details of what the code did when executed and provide users with a way to investigate how long it took each part of the code. The beauty of this approach is that now, you no longer have to settle with hypotheses of which path your code may have taken. You now have a picture of the execution of your code.
If code instrumentation is so great, why do developers avoid it as much as they can? You may ask. Presumably, code instrumentation is terrible for performance, and leaving the code with the instrumentation written in it will slow things down. It is essential to know a few things. First off, code instrumentation has evolved a lot in terms of performance overhead. The perception of being something slow came from technologies from the past. Furthermore, it can be disabled at any time via configuration.
Therefore, developers no longer have to fear the performance impact of code instrumentation and perhaps the potential refactoring they would have to implement to remove the instrumentation from the code to fix the problem. You can leave the code untouched and disable the instrumentation as needed. Hopefully, knowing this trick may encourage developers to adopt an instrument-first approach during development. In fact, leaving the instrumentation on your code provides extra superpowers!
Code Instrumentation allows you to compare different releases from your system and the changes that may have affected performance, availability, and correctness. Since distributed tracing allows you to have a picture of the execution of your code, you can now compare the picture of each release and quickly see if, for example, the last committed code pushed on a Friday night broke anything.
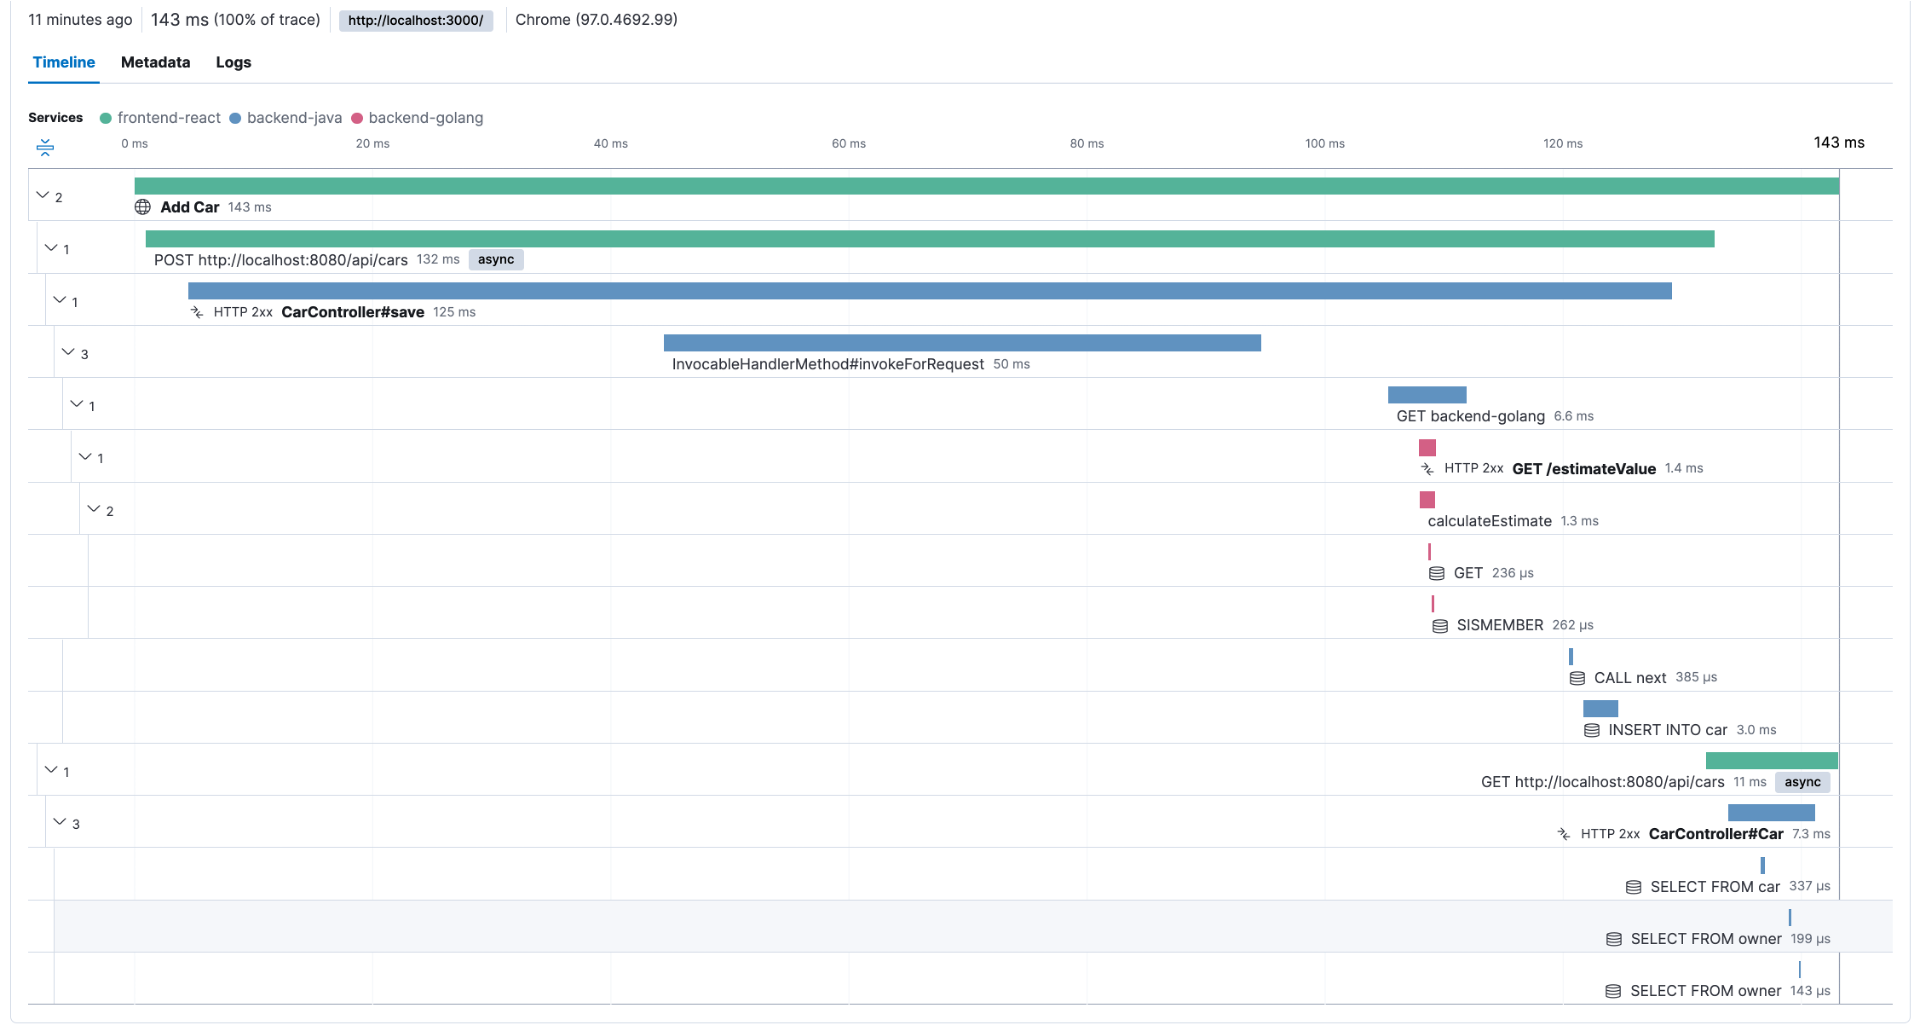
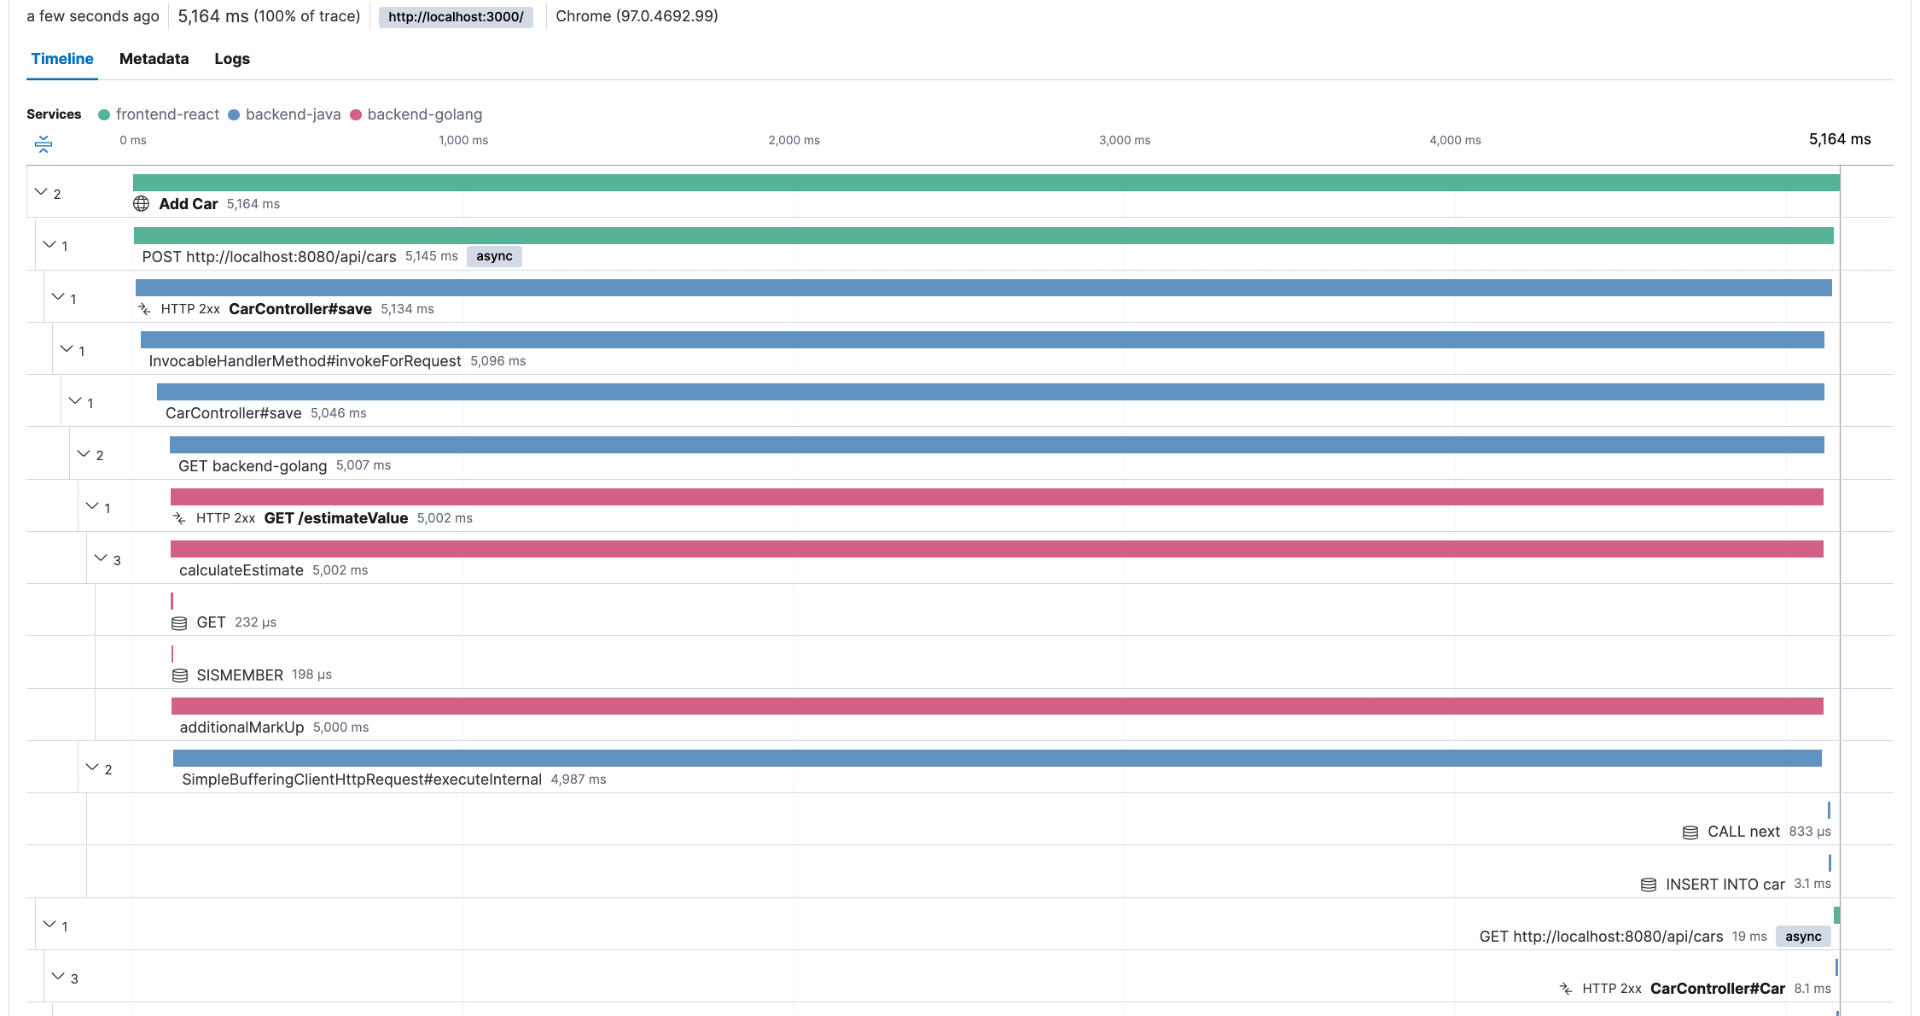
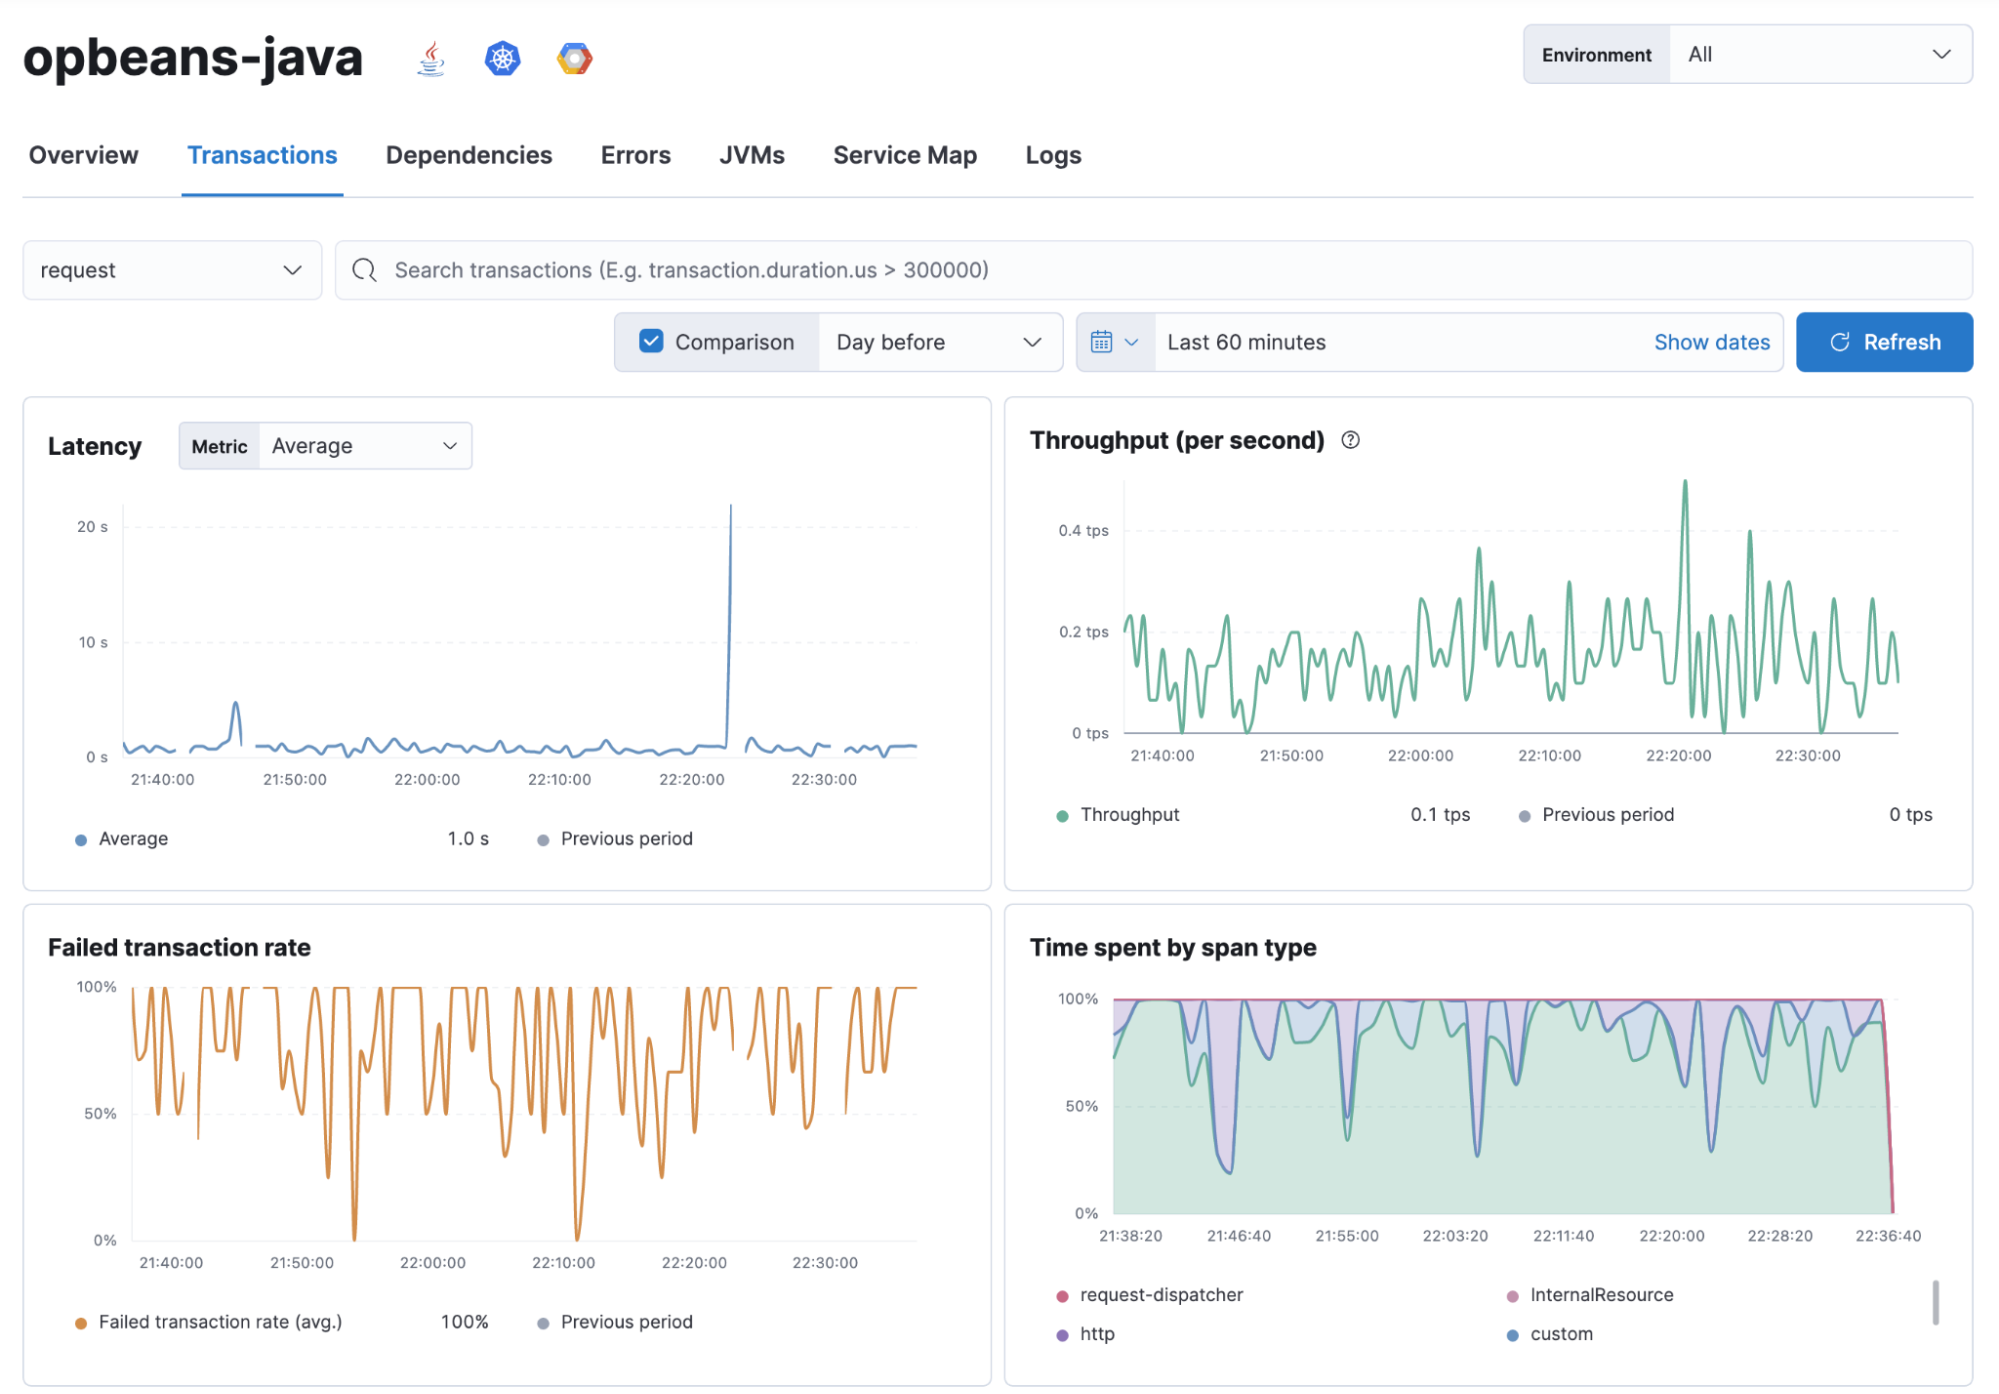
To illustrate this, let's say that after the last release, you started to have customers complaining about the performance of a transaction that usually takes less than a second to complete. You can use your observability backend to inspect the transactions done before the last release and check its execution, as shown in Figure 2.
This troubleshooting style is perfectly possible as long as the observability backend provides longer retention for the ingested traces, as you need to compare current data with past data. For example, with Elastic Observability, you have the concept of Searchable snapshots, where you can configure its persistence layer to handle more data density for historical data, using cheaper storage such as Amazon S3, Azure Blob Storage, and Google Cloud Storage. You can store more data without skyrocketing your storage costs.
But observability is not just about debugging your code. The real value from observability comes when you use it to figure out where exactly in the system to look for code that needs debugging. You can achieve this superpower by adopting an instrument-first approach, where your code can become genuinely observable. What does it take to embrace the instrument-first approach? Well, you can start by learning how instrumentation works for the programming language used to build your services. Then, you can apply code instrumentation to the parts of code that are relevant to your customers.
Suppose you are designing an e-commerce system that allows customers to browse for products, put those products into a shopping cart, provide a way to pay for them, and, once paid, handle product shipment. This flow is what is relevant to your customers. In this case, this whole customer flow — also known as a business transaction — should be explicitly observable via distributed tracing.
Remember, though, distributed tracing is not a goal achieved overnight. The most successful observability implementations result from several iterations, where each step instruments another aspect of the code for the sake of tracing. In the first release of your software, you may not have noticed that a particular dependency is essential to the success of a given business transaction. You can ensure that the dependency is included in the next release, given its importance.
Knowing that you have an iterative process is important to remove the burden from your shoulders about expecting a perfect, distributed tracing implementation in your first attempt. It is OK to be incomplete. Distributed tracing is not a single-shot type of implementation. It is an ongoing, always incomplete, constant code refinement that developers must consider. If your code is still under development and changing, the same goes for your distributed tracing implementation. Remember, your code's perfect lap is out there. No mistakes. Every new release you build, every function refactored, every new dependency added. Perfect.
Four golden signals, one perspective
"You can't manage what you don't measure." This iconic statement is one of the most famous quotes found in books about business management. It’s also become well-known among folks responsible for maintaining systems online, such as SREs.
As an SRE, you can't say that you manage a system if you don’t have a single clue about its current state. The best way to assess the system's current state is to continuously probe for data and build up metrics around it. Metrics can be used to evaluate how the system is going, which way it may be trending, and build knowledge about the system's behavior given past incidents. For example, you can investigate a past incident where your system was unavailable for thirty minutes and create a causation analysis that demonstrates that when it happened, the database's CPU spiked during the same time interval.
This is known as monitoring, a practice that has been around for quite some time now. But the technologies used to implement it have matured significantly in the last few years, especially in the areas of time-series analysis and storage. Without monitoring, managing your system will be like driving a car with your eyes blindfolded — it will be only a matter of time before an accident happens. With monitoring correctly in place, the monitored system can be protected by having a human alerted when one of the metrics is problematic.
Successful monitoring is in the end, a matter of which metrics you decide to collect. Luckily, there’s no need to guess about which metrics to collect. Some lessons learned in SRE can provide you with a relatively great start.
One key learning is regarding the four golden signals. They represent the aspects of a system that really matter the most. Focusing on the aspects that matter the most is important as metric collection doesn't come for free. Collecting metrics always incur a slight overhead, whether in the source system where you pulled those metrics or storing the metrics. But, you have to start somewhere, and the four golden signals are a great starting point.
- Latency: The time it takes to service a request, which includes the monitoring of all successful or errored requests. Latency must be measured from individual services, collection of services, and end-to-end business transactions.
- Traffic: How much demand is being placed on your system, measured in a high-level system-specific metric. For example, this metric may be the number of transactions per second for a key-value storage system.
- Errors: The rate at which your services are failing. They can be explicit like the number of HTTP 500s, implicit, like the number of HTTP 200s with errors, or derived by policies like whatever requests don't complete in one second is considered an error.
- Saturation: How "full" your service is. This can be measured in various ways, such as how much more load the system can handle and given a set of constrained resources — when approximately it will stop serving requests.
By focusing on the four golden signals, you can better assess the system's current state and what to do next. It’s an excellent first step to achieving software reliability. But it is not the only step. Previously, we discussed the concept of a business transaction. This is what customers see as most relevant. More important than monitoring the four golden signals from the system's perspective is monitoring the four golden signals from your customer's perspective.
After all, "nines don't matter if users aren't happy." This quote was coined by Charity Majors, where she explains that you may have a highly available system with five-nines of availability, and customers could still not finish their transactions. Here’s where distributed tracing can truly bring value to your journey in building reliability for your software. Yes, keep an eye on the four golden signals, but let distributed tracing glue them together and help you understand the customer's business transactions. Don't just monitor the latency of your microservices. Instead, observe how their latencies affect a given business transaction.
You can accomplish this by instrumenting your code with distributed tracing, which will act as a catalyst in unifying collected metrics with executed code. Figure 4 is a great example of this. Given a business transaction, you can see how the four golden signals can be visualized in the context of that transaction. This visualization is provided automatically. All you need to do is instrument the code and ingest the produced traces to the same backend where metrics are being stored; in this example, we have Elastic Observability, which can automatically correlate the traces and the metrics.
When you focus on your customer's perspectives, you will rarely be caught by surprise if your systems start to fail for whatever reason. Thanks to distributed tracing, you can act upon what’s causing the issue, which it will efficiently point out. Then you can work towards building a fix as soon as possible. Without the customer perspective, you will be stuck forever in that war room trying to convince people that everything is okay because a given metric shows up as green — but everybody else will argue that nothing is working and you should do something about it.
Let’s call this the four golden signals, one perspective. This one perspective is the business transaction that your customers will be interacting with. It is the only perspective that really matters. The four golden signals must be derived from that perspective so that discussing them should always be in the context of a given business transaction.
This model resembles the "4+1" architecture view model from Philippe Kruchten. The idea is that the other aspects of the system are considered from the perspective of the system's user and the use cases around it. It is a proven way to ensure that all stakeholders are on the same page and energy will be focused on what matters.
We're not in Kansas anymore
The way developers build systems has changed significantly over the years. It is possible to observe this by looking at the evolution of distributed tracing. Its origins go back to 2002 with a prototype called Pinpoint developed by researchers from the University of California, Berkeley, and Stanford. Its goal was to identify the root causes of problems in internet services created using J2EE. All traces were based on single-machine requests and the context was stored in thread-local variables within the JVM.
After this step forward in J2EE, researchers at Microsoft Research Cambridge developed Magpie in 2004, a project focused on recording detailed end-to-end traces and annotating those traces with fine-grained information, focused on .NET-based systems. A bit more ambitious than Pinpoint, Magpie wanted to provide tracing for heterogeneous environments; however, they ended up relying on Microsoft's specific components, such as the Windows XP's event tracing for Windows, making it hard to use other platforms.
As you can see, they both solved the problem of handling traces using inferences available on individual technology stacks. A reasonable expectation, given that at the time, most systems were created using a single technology stack and executed in a few, known by name, servers. In 2007, the University of California developed another project called X-Trace. Its purpose was to implement request tracing between distributed systems running on different computers. To accomplish this goal, the X-Trace project proposed a standardized way of propagating the trace context, so the distributed trace could be constructed with a more deterministic approach and be less dependent on specific technology stacks.
In 2010, Google developed an internal system called Dapper, which was heavily inspired by Pinpoint, Magpie, and X-Trace, but focused on solving some operational problems found while using these projects at scale in production systems: the need for trace sampling, trade-offs surrounding runtime overheads, data security, and how to make traces accessible to users. At this point in time, we can agree that the world had already embraced the idea that distributed applications were a new reality.
From 2002 to 2010, there was an apparent revolution in how systems were built and how the world started to shift from monolith applications to distributed systems that communicate via APIs. All the work done in the distributed tracing space was ultimately, a reaction to the needs of developers. Business transactions were executed by code written in different programming languages, running on different machines, running with different runtimes, and sharing data over remote procedure calls. However, it may be worth detailing another change in the last decade. Since 2010, there has been another shift in how systems are built. We are currently in an era of highly distributed and deep systems.
Yes, systems still communicate via APIs and share data over remote procedure calls. But JSON and XML are no longer the most popular data formats used, with binary technologies like Avro, Protobuf, and Parquet getting mainstream. Streaming systems such as Apache Kafka, Pulsar, and Flink are no longer only themes of specialized tech conferences for developers. Data flows implemented using Hadoop, Spark, and TensorFlow are the new mandate for complex artificial intelligence use cases. Bare metal hosts were replaced by VMs, which gave place to containers, and functions are getting popular as a unit of code deployment. As Dorothy commented in The Wizard of Oz, we're not in Kansas anymore.
For instance, OLTP and OLAP systems were always different things in the past. Traditionally, developers would only implement data pipelines to offload transactional databases and run analytics workloads using specialized data warehouses. Data engineering has evolved from a niche data analytics skillset to a standard developers' expertise. Modern systems often rely on data pipelines for their backend and frontend layers. When they are executed, most business transactions leverage data served by these data pipelines. Therefore, data pipelines are now part of the standard business transaction, even though they are not directly part of the critical transaction path.
How can we debug systems using this design? How can developers understand a business transaction if the flow is broken down into different contexts? These are questions developers ask themselves, and it is hard to build software reliability without answers. Distributed tracing still helps with this — but there is now a shared responsibility between developers and what distributed tracing can deliver.
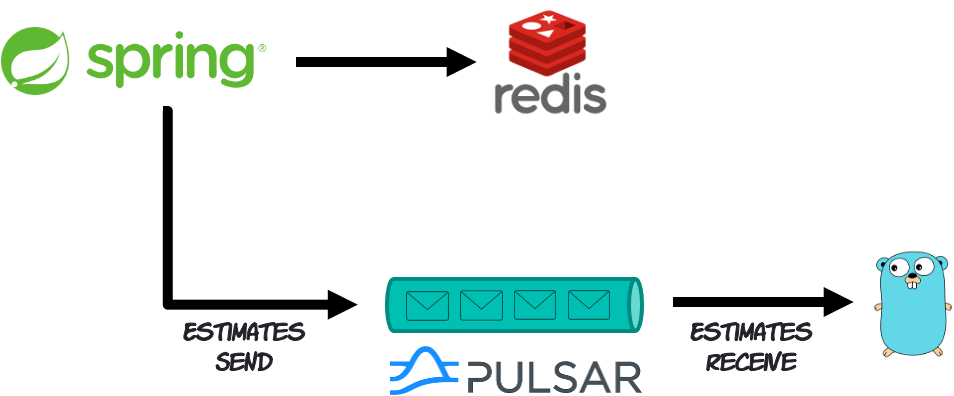
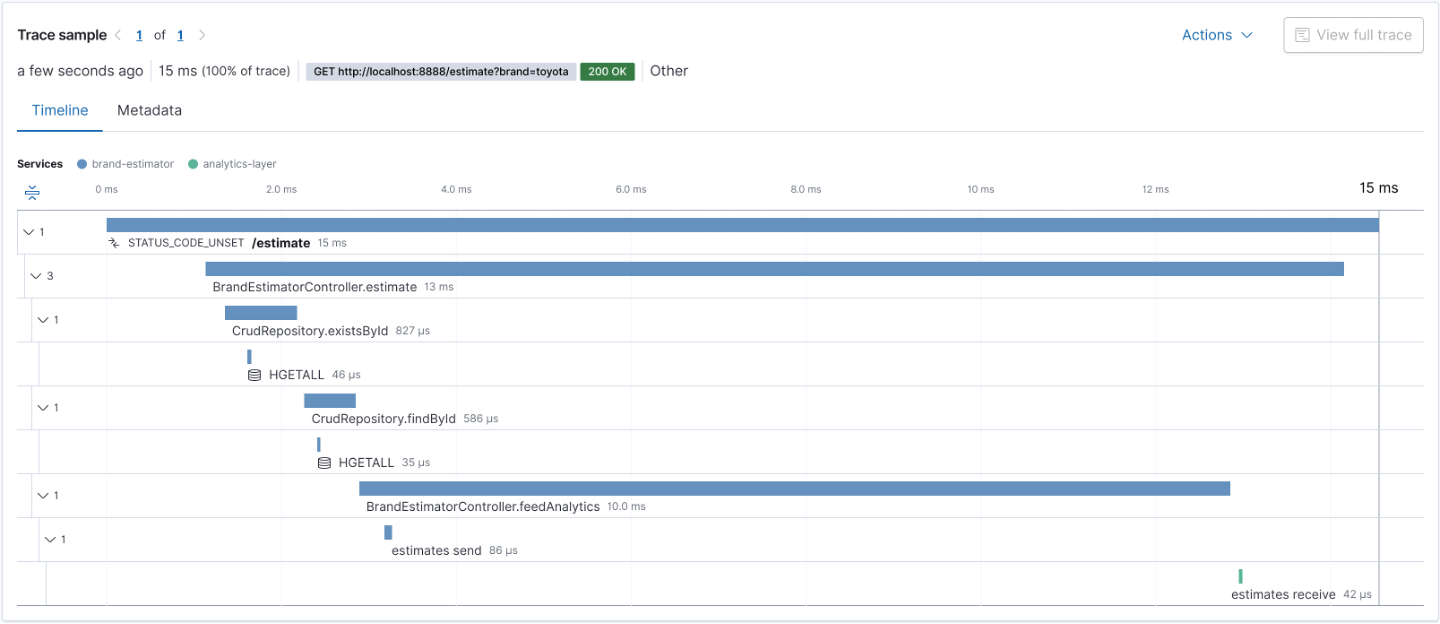
For starters, context propagation sometimes may not happen automatically. Developers may have to roll up their sleeves and write code to make this happen. For example, think about a flow where a transaction starts in one microservice written in Java that reads data from Redis and then publishes a message to Apache Pulsar. From the Java microservice perspective, the transaction has finished. But from the business transaction perspective, it is still pending. Other microservice written in Go will give continuity by reading the message off Pulsar and resuming the processing. The challenge is that the business transaction flow is broken down into different processes executed asynchronously.
Modern observability technologies such as OpenTelemetry provide the tools, APIs, and SDKs for developers to handle scenarios like this. It is a solved problem. Yet, it requires developers to explicitly use them in their code, which is sometimes unpleasant. The unpleasantry comes from developers having to write extra code to solve a problem they didn't know they would have until they needed distributed tracing. The session Building Observable Streaming Systems with OpenTelemetry, which was presented on Berlin Buzzwords in 2021, shows an example of this scenario and how to implement context propagation manually.
Furthermore, you may also have to understand how specific technology stacks will create their own traces. This is important because developers are increasingly using technology stacks to build up the layers of their systems. Service meshes are a good example. If you deploy a service mesh such as Istio with your system, this means that the service mesh will manage all the interprocess communication; therefore, you need to make sure that interactions will emit a trace so you can have visibility across the transactions. The same goes for Kubernetes. If your system connects to a database running in Kubernetes, you need to ensure that this interaction will also emit a relevant trace. So you need to configure your Kubernetes cluster accordingly.
To build this level of tracing, you will need to understand in further detail how each technology stack provides you with extension points. Sometimes it is as easy as configuring their support for a particular distributed tracing technology. Sometimes, you may need to leverage the built-in plugin architecture and write an extension. For example, this Jenkins plugin allows developers to monitor your pipelines using OpenTelemetry. This project was created at Elastic by Cyrille Le Clerc and eventually donated to the Jenkins project. Finally, sometimes you may need to build a custom version of the technology stack with distributed tracing included.
Eventually, you may also need to get involved with some open source projects to get the tracing your system requires. Many projects provide a way for the community to discuss and decide the future of specific implementations. For example, the Apache Kafka project is adding support for client metrics and observability, as you can see in the KIP-714. Ultimately, it is up to you to get involved with these projects and help shape the future of the implementation.
Simplifying your observability journey
From a practical standpoint, adopting observability is very challenging. The reality is that most developers still feel a bit lost about the concrete steps to adopt observability. The confusion is understandable, though. Different technologies over the years, multiple approaches, proprietary products versus open-source implementations, and the twisted ideas about what observability means from vendors. For example, if you ask a vendor whose main product is focused on time-series analysis, they will say that observability is only about metrics. Another vendor whose main product is focused on collecting and storing logs will say that observability is only about logs. The same goes for vendors focused on distributed tracing. To them, it is only about traces.
The reality is that observability is way more than these different types of data, also known as signal types. Individually, they have their advantages and solve specific problems. A better way to look at observability is by unifying all the signal types into one cohesive context, which unlocks the ability of an organization to answer questions about its systems and services with confidence. The so-called three pillars of observability are nothing but a fallacy. Think about pipes and not pillars. If a new signal type rises in the future, make sure to collect it and combine it with the other signal types to build datasets that will answer the questions that matter — unknown unknowns.
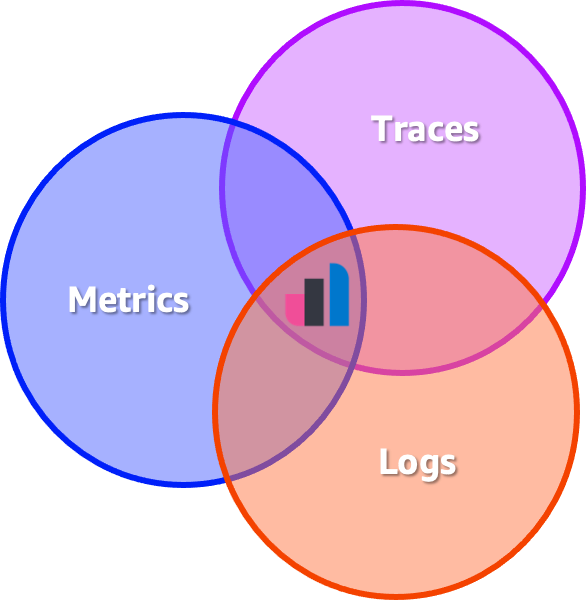
But how to build datasets from different signal types? Pragmatically speaking, this means that signal types must be collected in a standardized way, stored using specific schemas, and live in a kind of data store that allows them to be linked to each other. This isn't easy to solve, as each signal type has its peculiarities.
Metrics are time-series data that must be quickly aggregatable. Ingesting metrics at scale often leads to a problem in computing called high cardinality. The logs don't have a predefined schema by themselves. Looking for data in logs requires a data store with a flexible schema, less dependent on just queries, and more about doing searches. Traces are something else entirely; they are multidimensional data with many relationships. End-to-end traces are graphs and not just trees, as a child span can have multiple parents, as well as forks. Finally, you need to be able to build visualizations on top of all these signal types so users can play with the data.
When you get caught up with the semantics of solving these data problems, you quickly lose interest in adopting observability. To be fair, as any person would. But you don't need to worry about these data concerns to adopt observability. Leave this responsibility to the vendors. For example, Elastic Observability uses Elasticsearch and Kibana to handle these data problems. It is a great platform to handle signal types like metrics, logs, traces, and many others. Whereas other vendors wrote their data stores and visualization engines from scratch. This shouldn't matter to you from the observability adoption standpoint.
But data collection and ingestion are still your responsibility. It is a less complex problem, but it is still a challenge. Most of the issues related to the collection and ingestion of signal types are the proliferation of different technologies. It is not uncommon to see observability data collected requiring different agents to be installed. Specific agents for metrics, others for logs, and traces make maintaining systems and keeping them up and running more challenging. Along with these many agents, data buffering and transformation technologies are commonly needed before sending the signal types to the observability backends. Technologies such as Apache Kafka, Logstash, and FluentD are recurring characters for such use cases.
How does all of this complexity affect software reliability? The more tools you have to maintain every time you release a new system version, the slower and fragile your software delivery will become. It is not uncommon for developers to complain about the number of moving parts that need to be updated before a simple change occurs. For this reason, adopting observability heavily depends on how simple the implementation is. Whether you focus only on distributed tracing or adopting the other signal types to develop a more comprehensive solution, simplifying your observability journey is key.
Start by deciding which distributed tracing instrumentation technology you will adopt. There are many options, but each one has its advantages and disadvantages. While it is tricky to suggest one that can act as a bulletproof option, you can assume that adopting open standards should be the way to go. OpenTelemetry, which is a project created from the merger of OpenTracing and OpenCensus, is currently the best open standard to use for distributed tracing and many other observability needs, given its widespread acceptance and active community. It is also a CNCF incubating project. It supports different programming languages and ensures that the instrumentation code you write won't be wasted when you change your observability backend.
OpenTelemetry also provides a standard format for signal types along with specifications. As long as you use a compatible observability backend, you don't have to worry about data plumbing to store the signal types. Here's an example of code written in Go that leverages the OpenTelemetry APIs to produce traces.
func hello(writer http.ResponseWriter, request *http.Request) {

   ctx := request.Context()

   ctx, buildResp := tracer.Start(ctx, "buildResponse")
   response := buildResponse(writer)
   buildResp.End()

   // Create a custom span
   _, mySpan := tracer.Start(ctx, "mySpan")
   if response.isValid() {
       log.Print("The response is valid")
   }
   mySpan.End()

}Listing 1: Using the OpenTelemetry API for Go to produce traces.
In this example, the function hello() belongs to a microservice written in Go that exposes an API invoked via HTTP. When this API is invoked, the microservice will execute the hello() function responsible for producing the relevant traces, as shown in Figure 6.
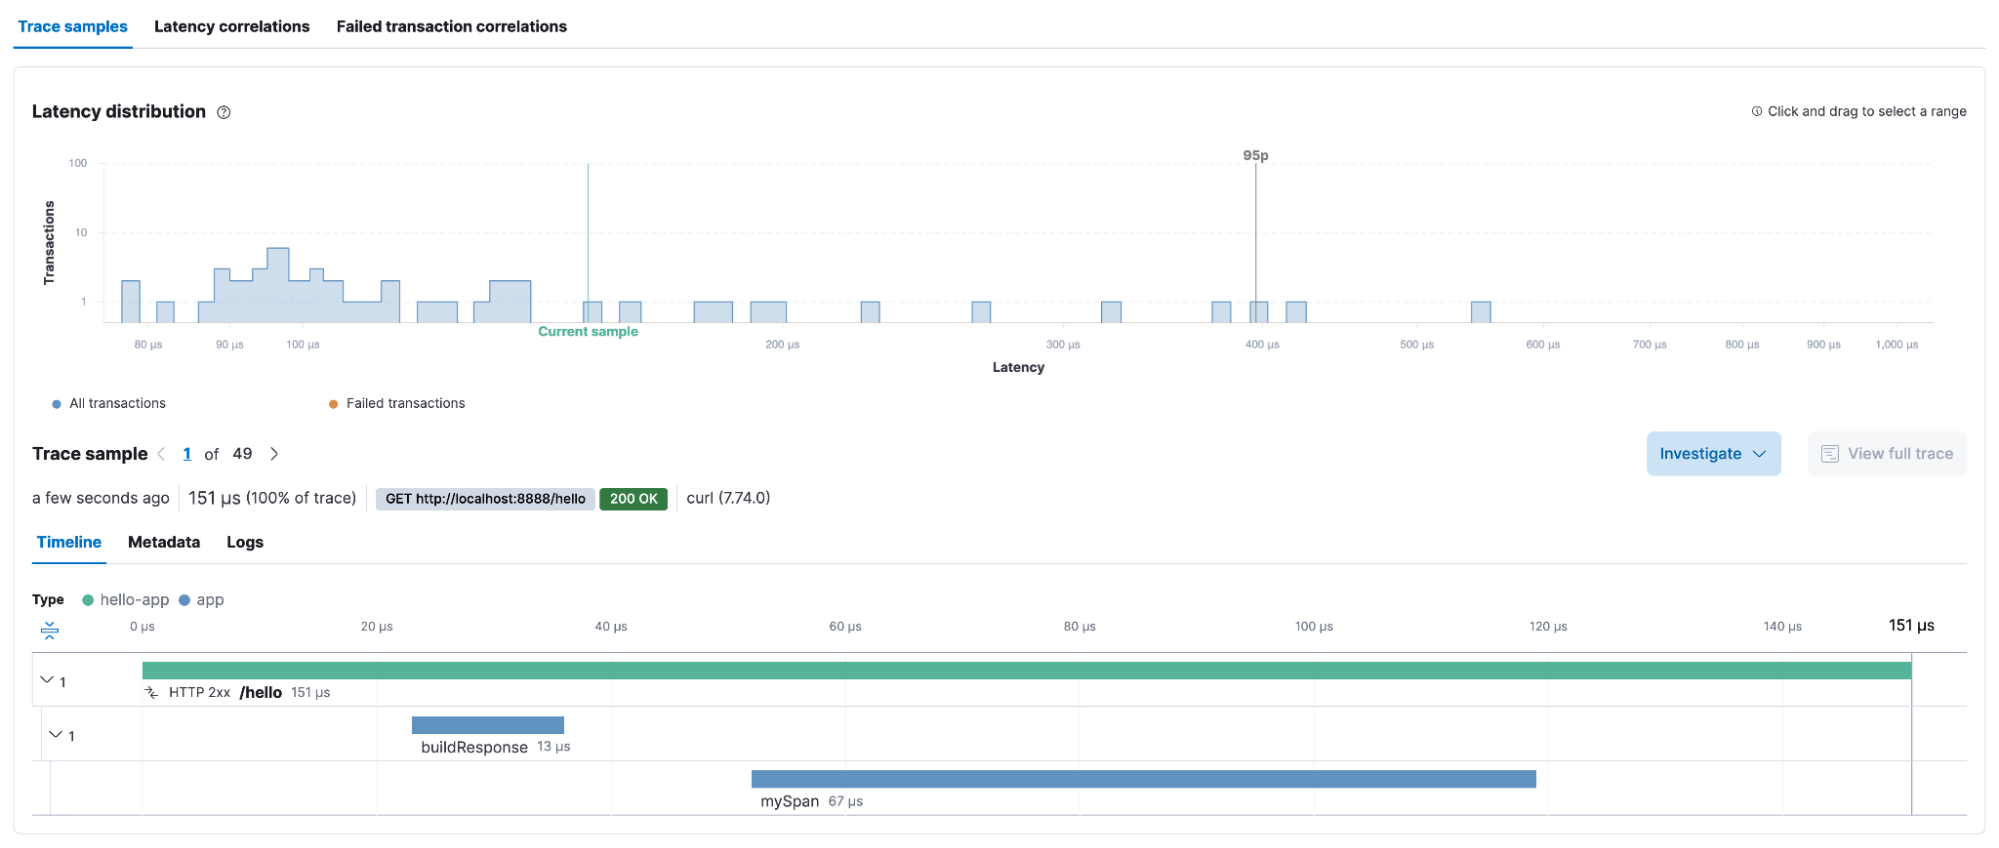
The complete source code of this example can be found on this GitHub repository. Keep in mind though, that the APIs and SDKs for each programming language will vary. The specification may be the same but each programming language has its own peculiarities. Visit the instrumentation page on the OpenTelemetry website to find more information about the programming language of your choice.
As for metrics, logs, and other signal types, the OpenTelemetry project is still in its early days. It will take a while until the community can leverage something production-ready. Meanwhile, you may need to use the tools offered by some vendors. For example, Elastic Observability has the Elastic Agent, a single, unified agent that you deploy to hosts or containers to collect data. The Elastic Agent considerably simplifies the effort necessary to collect signal types from different sources. The Elastic Agent also can be managed from a central location. This reduces the administrative overhead required to maintain your systems.
Finally, the usage of cloud-managed services can considerably reduce the operational overhead required for an observability backend. Whenever possible, offloading the burden of keeping the lights on for your observability backend may be beneficial in the long run and sometimes even cheaper. After all, saving money is not just about reducing infrastructure costs. It is also about letting your developers — arguably your most expensive assets — focus on business-critical tasks. At the same time, the operation of the observability backend is done by companies that only do that. Elastic Cloud is an excellent example.
With Elastic Cloud, you can benefit from having the engineers from Elastic take care of the cloud-manage service operation. At the same time, you can use Elastic Observability as a service, with the ability to deploy it in multiple cloud providers such as AWS, Azure, and Google Cloud. Starting with Elastic Observability is as easy as creating a deployment using the web console, or, to make things even more fun, creating the deployment programmatically using Terraform.
Summary
Reliability is the most fundamental feature of any product. After all, a system isn't beneficial if it's unavailable or nobody can use it. Building software reliability is, therefore, a constant flux of efforts focused on improving the design and operation of systems to make them more scalable, more reliable, and more efficient. Most software teams don't have the luxury of continuously focusing on optimization since innovation and delivering new features are equally important. Developing reliable software is then truly understanding what the code does from the moment it was written to when it is executed, without much room for guessing. And distributed tracing can help with this goal.
This post discussed some key aspects that you need to consider to build software reliability with distributed tracing. It examined the importance of understanding your code's limits by pursuing the unknown unknowns using code instrumentation. It mentioned the importance of focusing on the four golden signals from the business transaction perspective. It discussed the importance of adopting an instrument-first approach to ensure your code will be genuinely observable. It highlighted the challenges of using distributed tracing with modern technology stacks. Finally, it provides you with considerations you need to worry about while adopting observability. Join me on March 3 in the virtual event, Building software reliability with distributed tracing, if you have any questions.
There is no better way to start your distributed tracing journey than getting your hands dirty with an example. With Elastic Cloud, you can try Elastic Observability for free without needing a credit card. Create your account here. You can play with the examples written in Java and Go to understand how the API works. If you need more information, you can subscribe to the Elastic Community Channel, which has lots of tutorials, meetup recordings, and presentations to help you get started.
Share
- Share on Twitter
Share on Twitter
- Share on LinkedIn
Share on LinkedIn
- Share on Facebook
Share on Facebook
- Share by Email
Share by Email
- Print this page
Print