SAP Concur: Elastic Logging als DevOps-Strategie
Anmerkung der Redaktion: Mit der Veröffentlichung von Elastic Stack 7.11 ist das neue Alerting-Framework nun allgemein verfügbar. Zusätzlich zu bestehenden Konnektoren für Drittanbieterplattformen wie Slack PagerDuty und ServiceNow fügt 7.11 Microsoft Teams zur Liste der integrierten Alerting-Integrationen hinzu. Mehr zu diesem Update erfahren Sie in unserem Blogpost zum Alerting-Release.
Dieser Beitrag fasst einen Community Talk auf der Elastic{ON} 2018 zusammen. Möchten Sie weitere Talks dieser Art sehen? Dann schauen Sie im Konferenzarchiv vorbei oder informieren Sie sich, wann die Elastic{ON} Tour in Ihrer Nähe Station macht.
Wenn Sie jemals einen Spesenbericht ausgefüllt haben, dann wahrscheinlich über SAP Concur. Mit über 45 Millionen Nutzer in mehr als 150 Ländern (darunter 70 % der Fortune 500) ist Concur eine der führenden Reisekosten- und Spesenabrechnungslösungen. Allein im Jahr 2016 verarbeitete die SaaS-Lösung Ausgaben in Höhe von über 87 Milliarden US-Dollar, was über 2,4 Millionen Belegen und Rechnungen im Wert von 187 Millionen US-Dollar täglich entspricht. Das mag für die Buchhaltung nach vielen Positionen klingen, bedeutet aber für eine entsprechende Logging-Lösung noch viel mehr Log-Zeilen, die täglich verarbeitet werden müssen.
Concur gibt es seit über 20 Jahren, und mit dem Wachstum und der Weiterentwicklung des Produktangebots des Unternehmens hat sich auch seine Logging-Lösung weiterentwickelt. Nicht nur in der verwendeten Technologie, sondern auch im Umfang und der Absicht der Anwendung. Ursprünglich eine SQL-basierte Lösung für einfache Log-Speicherung, trägt die aktuelle Logging-Lösung des Unternehmens – basierend auf dem Elastic Stack – dazu bei, End-to-End-Anwendungs-Ownership zu fördern und Entwicklung, Tests und Betrieb auszurichten. Und in Zukunft plant das LAMA-Team von Concur (Logging, Alerting, Monitoring and Analytics), Elastic Machine Learning für operative Analysen und Einblicke sowie für die Automatisierung von Rollouts und Rollbacks einzusetzen. Das Unternehmen hat große Sprünge beim Logging gemacht, aber es ist nicht über Nacht von der Log-Speicherung zu Analytik übergegangen.
Ursprünglich auf einer relationalen Datenbank basierend, erfasste ihre Logging-Lösung Logdaten als XML über RabbitMQ. Die Nutzer schätzten die einfache Log-Abfragemöglichkeit per SQL. Mit steigender Beliebtheit des Dienstes nahm jedoch auch die Nutzung zu. Bei einem Spitzenwert von 200 GB/Tag – mit Raten von über 1.500 Dokumenten/Sekunde – stieß der Dienst an seine Grenzen. Leistungsbedingte Serviceverzögerungen führten dazu, dass Nutzer bis zu 20 Minuten auf die Verfügbarkeit eines Logs im System warten mussten. Als Reaktion darauf konnte das Logging-Team lediglich seine Datenbank auf leistungsstärkere Hardware verlagern, ein nicht nachhaltiger Prozess. Man benötigte stattdessen horizontale Skalierbarkeit, weshalb man sich auf die Suche nach einer besseren Lösung machte.
Nachdem Concur Elasticsearch recherchiert und von verschiedenen Erfolgsgeschichten von Unternehmen in ähnlichen Situationen gehört hatte, entschied sich das Unternehmen für den Elastic Stack als Logging-Lösung. Er war schnell, leistungsstark und skalierbar – und dazu (was für die internen Nutzer möglicherweise noch wichtiger war) bot er eine Visualisierungskomponente, die unter den Nutzern sehr gefragt war. Zuvor hatten verschiedene Teams ihre eigenen Schnittstellen und Dashboards entwickelt und dabei oft Lizenzgebühren für die benötigten Tools zahlen müssen. Mit Kibana verfügte Concur nun über eine einheitliche Visualisierungslösung, wodurch die Notwendigkeit von Eigenentwicklungen oder Drittanbieter-Visualisierungslösungen entfiel.
Die erste Implementierung von Elastic erfolgte mit Elasticsearch 1.1 und Kibana 3. Die Ingest erfolgte über Logstash, RabbitMQ (wie bei der SQL-Lösung) und Fluentd. Das Logging-Team konnte zudem ein eigenes Alerting-Plugin entwickeln (ein Vorteil der Open-Source-Natur von Elastic), da ein solches im Elastic Stack noch nicht vorhanden war. Dank der höheren Geschwindigkeit von Elasticsearch, den Visualisierungen von Kibana und der Alerting-Features des selbstentwickelten Watcher-Plugins stieg die Nutzung des Dienstes bei Concur sprunghaft an, und die Ingest schoss auf 5.000 Dokumente pro Sekunde. Das hätte die SQL-Lösung bei Weitem nicht leisten können.
Das Wachstum von der Lösung zur Strategie mit Elastic
Seit dieser ersten Implementierung ist die Logging-Lösung von Concur mit dem Elastic Stack gewachsen. 2015 stieg man auf Elasticsearch 2.3 und Kibana 4.5 um, kaufte ein Abonnement „Gold“ und begann, Beats (als Ersatz für Fluentd), Watcher (als Ersatz für ihre selbstentwickelte Lösung) und Shield (für die Sicherheit) zu nutzen. Man hat außerdem ein weiteres eigenes Plugin entwickelt, diesmal eine eigene Aggregations-Benutzeroberfläche. Mit der Verbesserung der Logging-Lösung stieg auch die Nutzung, und bis 2017 stieg die Ingest-Rate auf 60.000 Dokumente/Sekunde (4 TB/Tag).
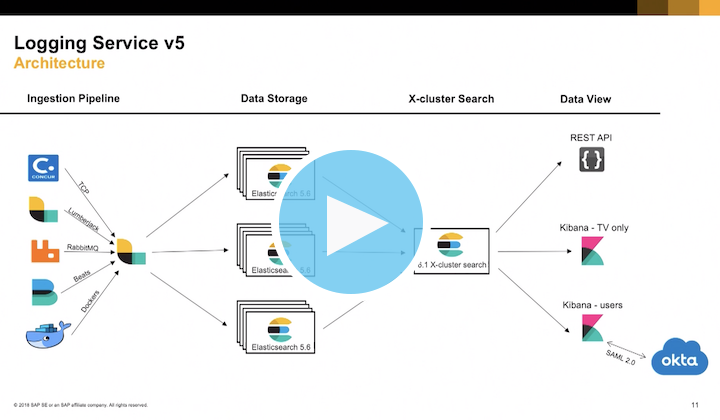
Nach der Teilnahme an der Elastic{ON} 2017 führte Concur erneut ein Upgrade durch, um diesmal die Vorteile der clusterübergreifenden Suche, verbesserter Sicherheit (notwendig für die Einhaltung der DSGVO) und anderer neuer Elastic Stack-Funktionen zu nutzen, die man auf der Konferenz kennengelernt hatte. Mithilfe der clusterübergreifenden Suche konnte das Unternehmen seinen monolithischen Cluster in mehrere kleinere Cluster aufteilen, die über mehrere Regionen verteilt sind. Dieses Versions-Upgrade – sowie der Wechsel zu einem Abonnement „Platin“ – halfen ihm, die heutige Umgebung mit verschiedenen Ingest-Quellen, Elasticsearch-Clustern in mehreren Regionen (5 TB/Tag in den USA) und Kibana-Dashboards zu schaffen, die von Ops, SREs, dem Support, der Geschäftsleitung und weiteren Abteilungen genutzt werden. All dies wird von einem LAMA-Team verwaltet, das aus sechs Ingenieuren und zwei Managern besteht.
Schauen Sie Elastic @ SAP Concur: Driving the Journey to DevOps and End-to-End Ownership von der Elastic{ON} 2018 und erfahren Sie, wie Concur von Logspeicher zur Ownership-Ermöglichung überging. Sie erfahren außerdem, wie das Unternehmen das Ein-Klick-Logging-Service-Deployment ermöglicht hat, wie es Mappings (nicht-dynamisch) und Felder für über 200 Teams konfiguriert hat und was seine Pläne bezüglich der Nutzung der Leistungsfähigkeit von Elastic Machine Learning sind.