Summary
At this leading private bank in India, relationship managers use their CRM application every day to pull customer data from Core Banking into a Hadoop data lake for Customer360, analytics, and MIS. While Hadoop handled high-volume batch processing fine, it struggled to serve the sub-second, interactive search relationship managers needed for full customer journey tracking, and it gave IT no real-time view of application health. So, the bank kept Hadoop for batch analytics and stood up three purpose-built Elasticsearch clusters alongside the lake, with Kibana as a shared front end. Now, relationship managers search customer profiles and transactions in real time at 20,000 events per second, plus application logs are searchable as they land at 750 GB a day. Finally, business and IT teams are now able to work from one, unified platform. The architecture is worth learning from.
Batch works, but real-time search is a whole different ball game
Relationship managers at this bank — one of India’s largest private lenders, with 1,300 branches nationwide — live in their CRM. On any given day, they’re pulling customer data from Core Banking, tracking customer journeys, and making live offers — all from the same application. For years, that CRM fed into a Hadoop data lake powering Customer360, analytics, and MIS reporting, and it did that job just fine. What it wasn’t built to do was respond the moment a relationship manager searched for a customer profile.
As more of the day-to-day workflow came to depend on live data, the gap between batch cycles and interactive search became a recurring operational cost. IT had the same problem from the other side: Application logs weren’t surfaced in a way that showed issues as they happened, leaving no real-time view of service health. The root of both problems was the same. CRM and business data lived in Hadoop, while application data sat in separate application databases, creating silos that left business and technical teams working from different pictures of the same platform.
Closing that gap meant building something designed for real-time work from the ground up.
Choosing not to rip and replace
Given the specific gaps in place of real-time CRM search, transaction-level search, and log visibility, the team knew that the fix had to be specific, too. So, the bank decided to build a real-time search layer running alongside the existing Hadoop lake, with three purpose-built Elasticsearch clusters, each sized for one workload, with Kibana as the shared front end.
The team first considered a single combined Elasticsearch cluster for every workload, but eventually ruled it out. Given that real-time RM-facing search, transaction-level search, and log analytics have different performance profiles, forcing them to share one system wasn’t an optimal solution.
Instead, the bank partnered with Ashnik, an Elastic managed-service partner in India.
Architecture: 3 clusters, 1 platform, beside the lake
The bank's answer addressed both the data problem and the operational one.
Customer-facing systems had no disaster recovery strategy, so tuning and troubleshooting were outpacing what the team could keep up with. To stop every new use case becoming a fresh architecture exercise, they implemented three purpose-built Elasticsearch clusters — each sized for one workload, with none competing with the others.
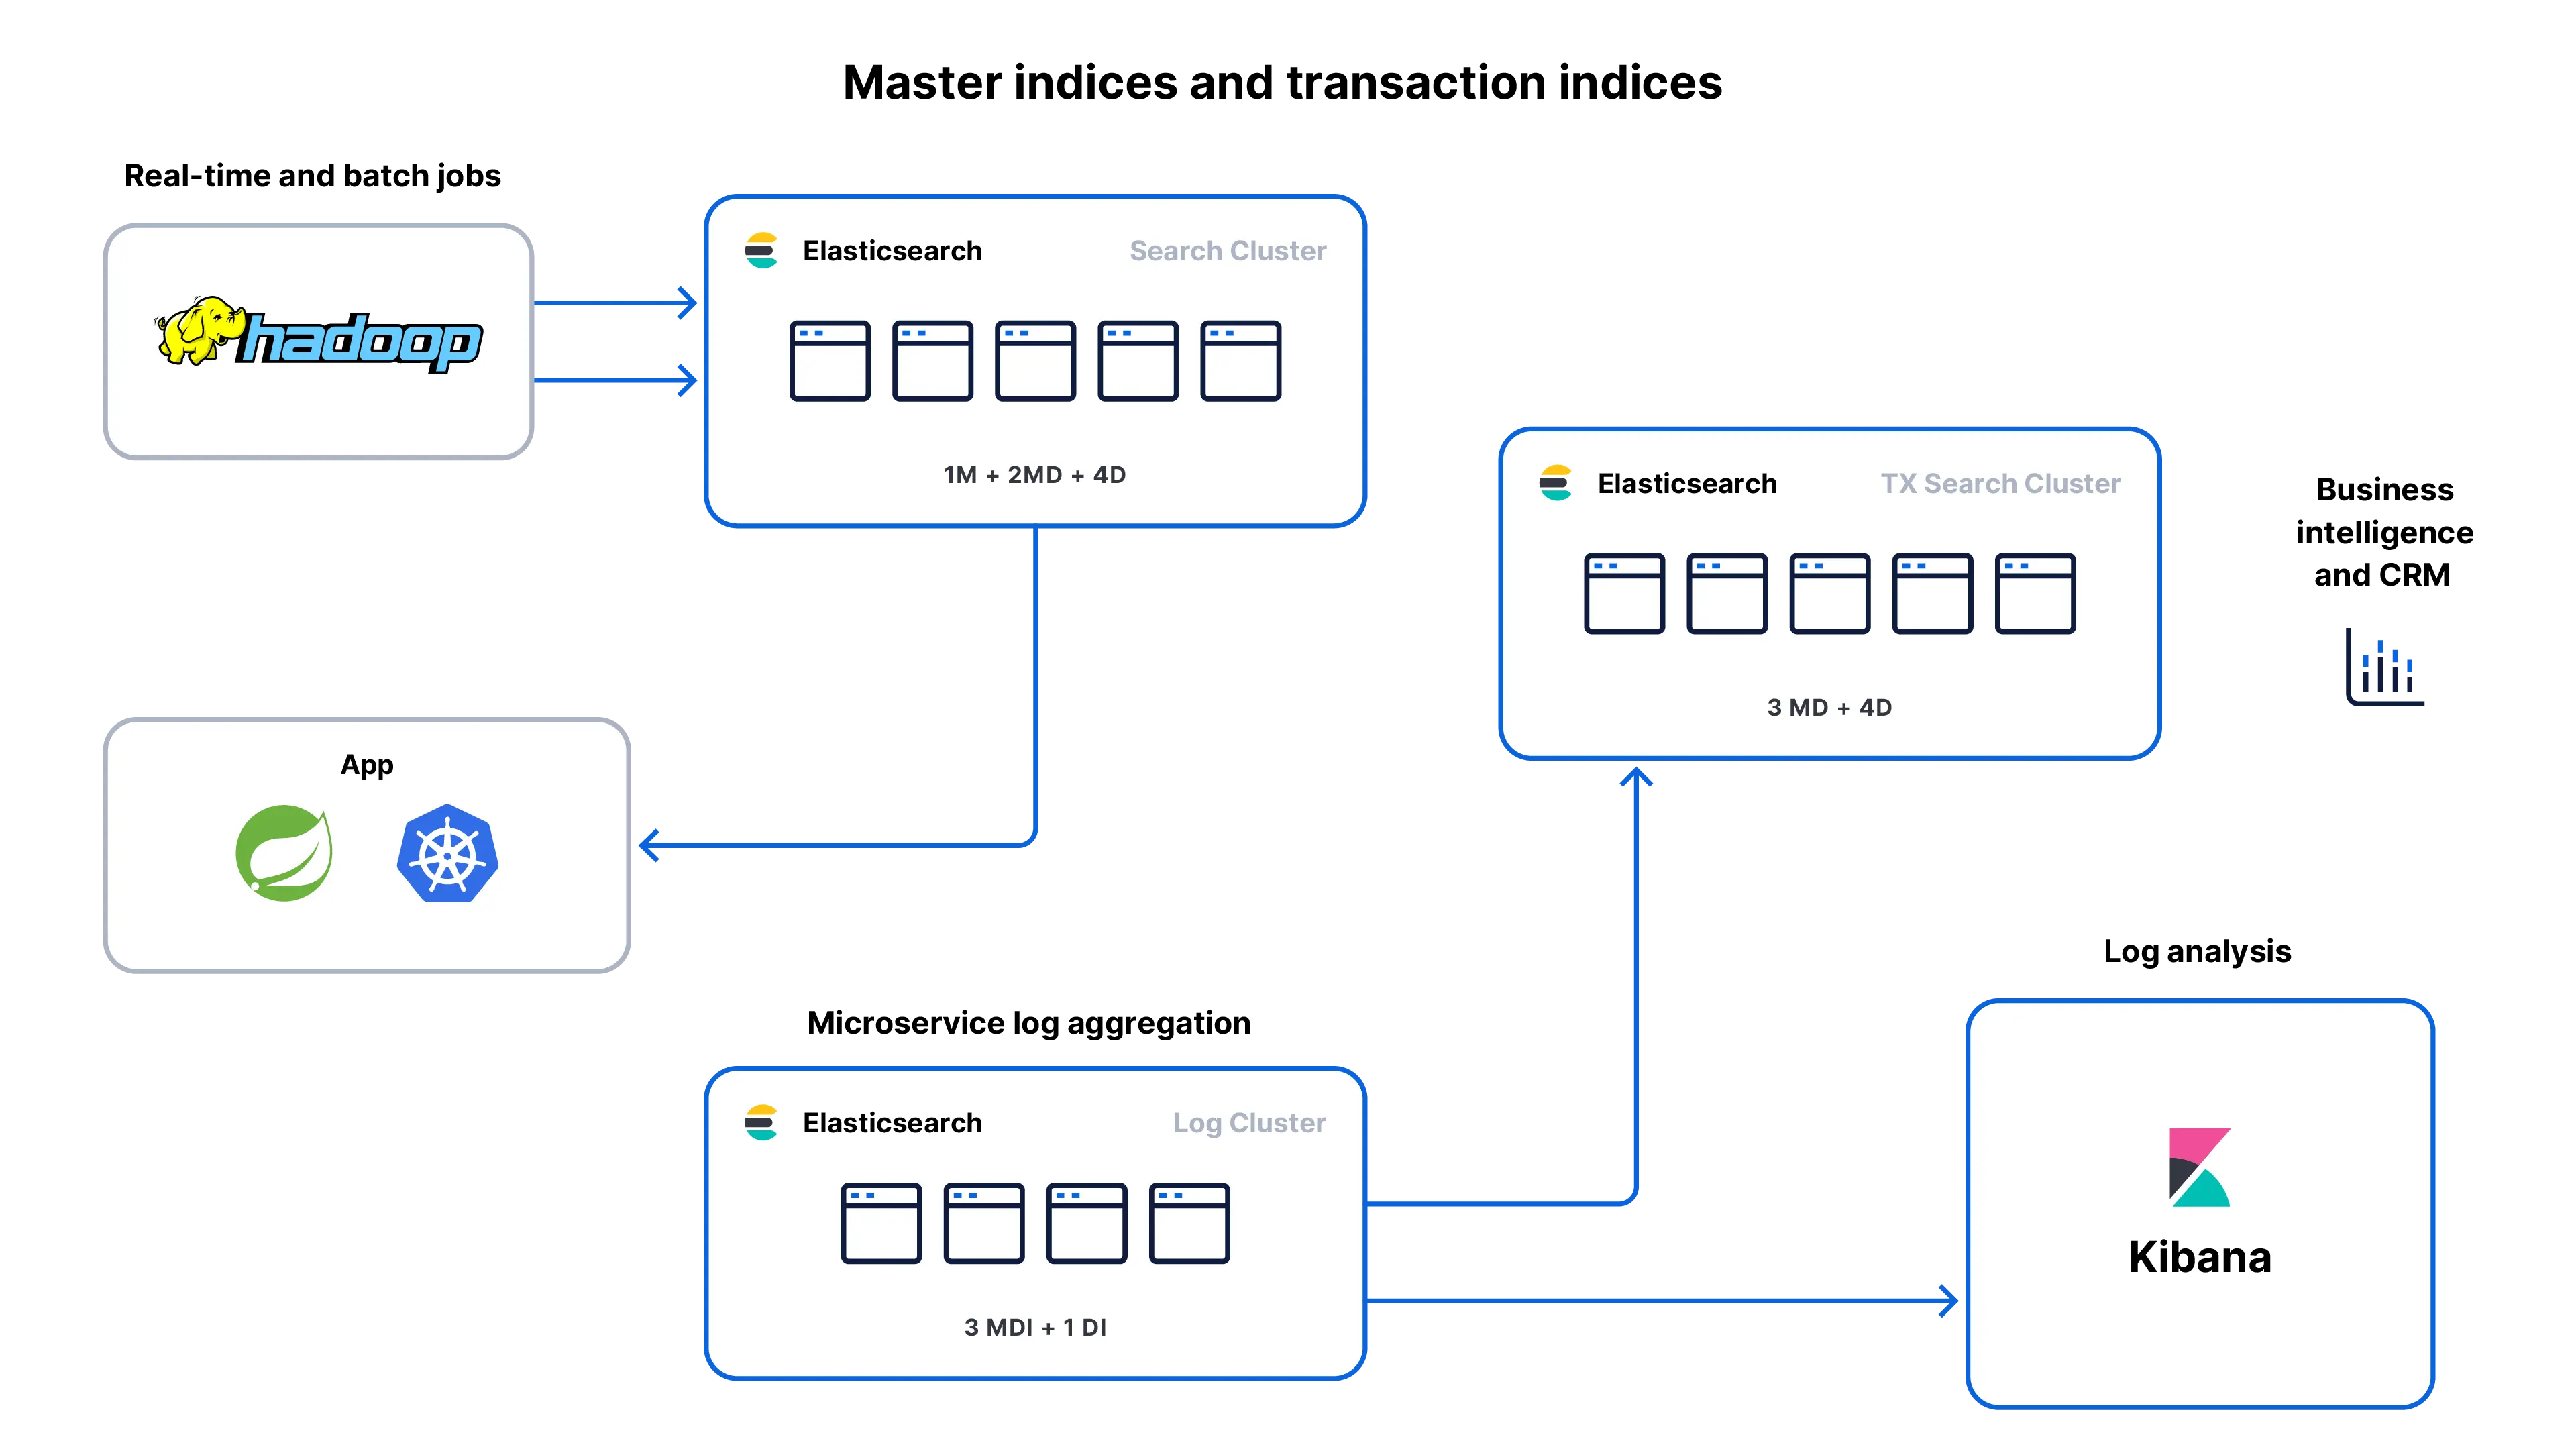
The three clusters:
- Search cluster: Feeds the CRM application directly. Ingests ~100 GB/day and sustains 20,000 search events per second. (Node topology: 1M + 2MD + 4D)
- Transaction search cluster: Dedicated to transaction-level search at 12,000 events per second. (Node topology: 3MD + 4D)
- Log cluster: Microservice log aggregation at 750 GB/day and 6,000 events per second, indexed as logs land. (Node topology: 3MDI + 1DI)
The separation is to help with load-bearing design. Santanu Patel, technical consultant at Ashnik, explains why:
"Log ingest and RM search pull a cluster in opposite directions. One needs sustained indexing; the other needs predictable query latency at 20,000 events per second. So the log cluster carries the ingest role on every node, and the search cluster carries none."
With each workload on its own cluster, real-time RM search never contends with log ingestion or transaction queries, and a new use case lands on an appropriately sized cluster instead of forcing a platform-wide redesign. For more on cluster topology, node roles, and workload isolation, Elastic documentation covers each in depth.
Technical highlights
- Three production Elasticsearch clusters running alongside an existing Hadoop data lake
- Search cluster: ~100 GB/day ingest, 20,000 events/sec, feeding the CRM application directly
- Transaction search cluster: 12,000 events/sec, dedicated to transaction-level search
- Log cluster: 750 GB/day ingest, 6,000 events/sec, microservice log aggregation
- Workload isolation by cluster: RM search, transaction search, and log analytics never share a cluster
- Kibana as the single front end for both business and IT dashboards
- Hadoop is retained for batch analytics, Customer360, and MIS
- Ingest path into Elasticsearch: Fluentd collects application logs from Kubernetes and forwards them to Elasticsearch via Logstash; business and application data is ingested through custom applications based on business logic
Before and after
| Before | After | |
|---|---|---|
| Search experience | Customer360 lookups ran against Hadoop batch, too slow for live RM use | Real-time profile and transaction search at 20,000 events per second |
| Log visibility | Application logs not surfaced as issues happened | 750 GB a day ingested and searchable as it lands |
| Dashboards | Business and IT data in separate silos, no shared view | One Kibana layer, different views drawn from the same platform |
| Operational effort | Tuning and troubleshooting outpaced team bandwidth | Managed tuning, with workload-isolated clusters |
| New workloads | Each new use case risked a fresh architecture exercise | Workload isolation means new use cases don't force a redesign |
Real-time search where batch used to be
The search cluster now feeds the CRM directly, returning customer profiles and transaction summaries the moment a relationship manager searches — not on the next batch cycle. The transaction search cluster carries transaction-level queries on its own dedicated hardware at 12,000 events per second.
Logs searchable as they land
The log cluster ingests 750 GB of microservice logs a day and indexes them on arrival. IT can now see application issues as they happen rather than waiting for a batch window to close.
A single front end for both IT and business teams
Kibana serves as the shared layer across all three clusters: IT teams work from log-analysis and uptime views, while business teams work from lead and CRM-funnel dashboards. Both draw from the same platform instead of maintaining separate reporting stacks.
The new normal
Today, when a customer reaches out to their banking relationship manager, the manager is able to search the CRM and return the customer's profile and recent transaction history in real time.
That single change is what the architecture was built for: allowing for real-time decisions on live data (rather than a snapshot from the last batch job), all while the customer is still sitting in front of them.
On the IT side, the same platform surfaces the health of the services behind that lookup as the logs land, effectively removing data silos and providing a single source of truth for customer service and IT teams.
What comes next?
The platform has delivered what the bank set out to build, which is a real-time CRM search running in parallel with a Hadoop lake that keeps doing the batch analytics it was designed for.
The parallel design sets up what comes next. The immediate priority is disaster recovery for the customer-facing systems — something the bank didn't have before this project. Beyond that, the workload-isolation model gives the bank a repeatable pattern: New search and analytics workloads land on their own appropriately sized cluster, without forcing a platform-wide redesign each time.
"For us, disaster recovery is the next piece of work, which is so much easier to do now because each workload sits on its own cluster and can be protected on its own terms."
The lesson here isn't that other parts of the stack are wrong. It's that the right architecture gives every tool the job it was built for — and when you do that, real-time search at 20,000 events per second stops being a stretch goal and starts being the baseline.
See how Elasticsearch runs real-time search at scale alongside your existing data lake and integrates with your existing data stack, or simply start now with a free trial.