One of India's leading payment gateway companies processes 1.4 billion log events a day on Elastic — and can now follow any transaction across its entire microservices estate by trace ID.
Summary
One of India's leading online payment gateway companies supporting 170+ payment methods, a national biller network, and recurring payments through eNACH and UPI AutoPay runs its platform on more than 25 microservices. Previously, when a transaction failed, engineers had no way to trace it across services, as well as no per-service latency or HTTP status monitoring, and no alerts when a service restarted. While the signal of the issue was technically in the logs, the tooling to reach it simply wasn't there. So, the company deployed a dedicated Elastic Stack sized for its real production load, and now sustains roughly 500 GB of log data a day — 16,000 events per second, 1.4 billion events daily — all searchable in real time. Any transaction can be traced end to end by its trace ID, and every microservice is monitored, meaning errors surface before customers ever even feel them. Here's how they did it.
A national payment platform running blind on its own logs
When you're moving money for merchants, banks, and millions of end users, there's no such thing as a small blind spot.
This customer, one of India's leading online payment gateway companies, handles transactions across three product lines: a Payment Aggregator supporting 170+ payment methods, a Biller Network for utility and credit card payments, and Recurring Payment services covering Standing Instructions, eNACH, and UPI AutoPay.
Behind those three lines sit more than 25 microservices in production. Each one was writing logs around the clock, and when something broke, none of those logs could tell the engineers what happened.
When your data isn't missing, just unusable
When a payment failed, there was no way to search for its trace ID, which is the identifier that follows an API call from the front door through to every downstream service. Engineers checked logs service by service, with no shared context and no way to tell whether the failure was in one microservice … or three.
The gaps went beyond tracing, too. Latency wasn't monitored per service, and HTTP status codes weren't tracked centrally. So, when a microservice restarted, there was nothing to alert anyone.
The signal engineers needed at 2:00 a.m. were sitting in the logs because the tooling to reach it didn't exist — and for a payments platform, that friction has a direct cost. Every hour spent grepping across disconnected services is an hour a merchant-facing issue stays open.
The bank partnered with Ashnik, an Elastic managed-service partner in India, to help.
"The logs were always there, but they were not serving the right purpose. Having a central log management system for their most critical applications enabled them to troubleshoot the problems before getting complaints from billers. In a business where every biller out of the thousands matters, Elastic enables them to be the platform of choice."
The Elastic Stack, sized for their real-world workload
Rather than starting from a reference architecture, the team sized the platform around what their services actually produced. The result was a dedicated Elastic log monitoring environment built for their transaction volume from day one.
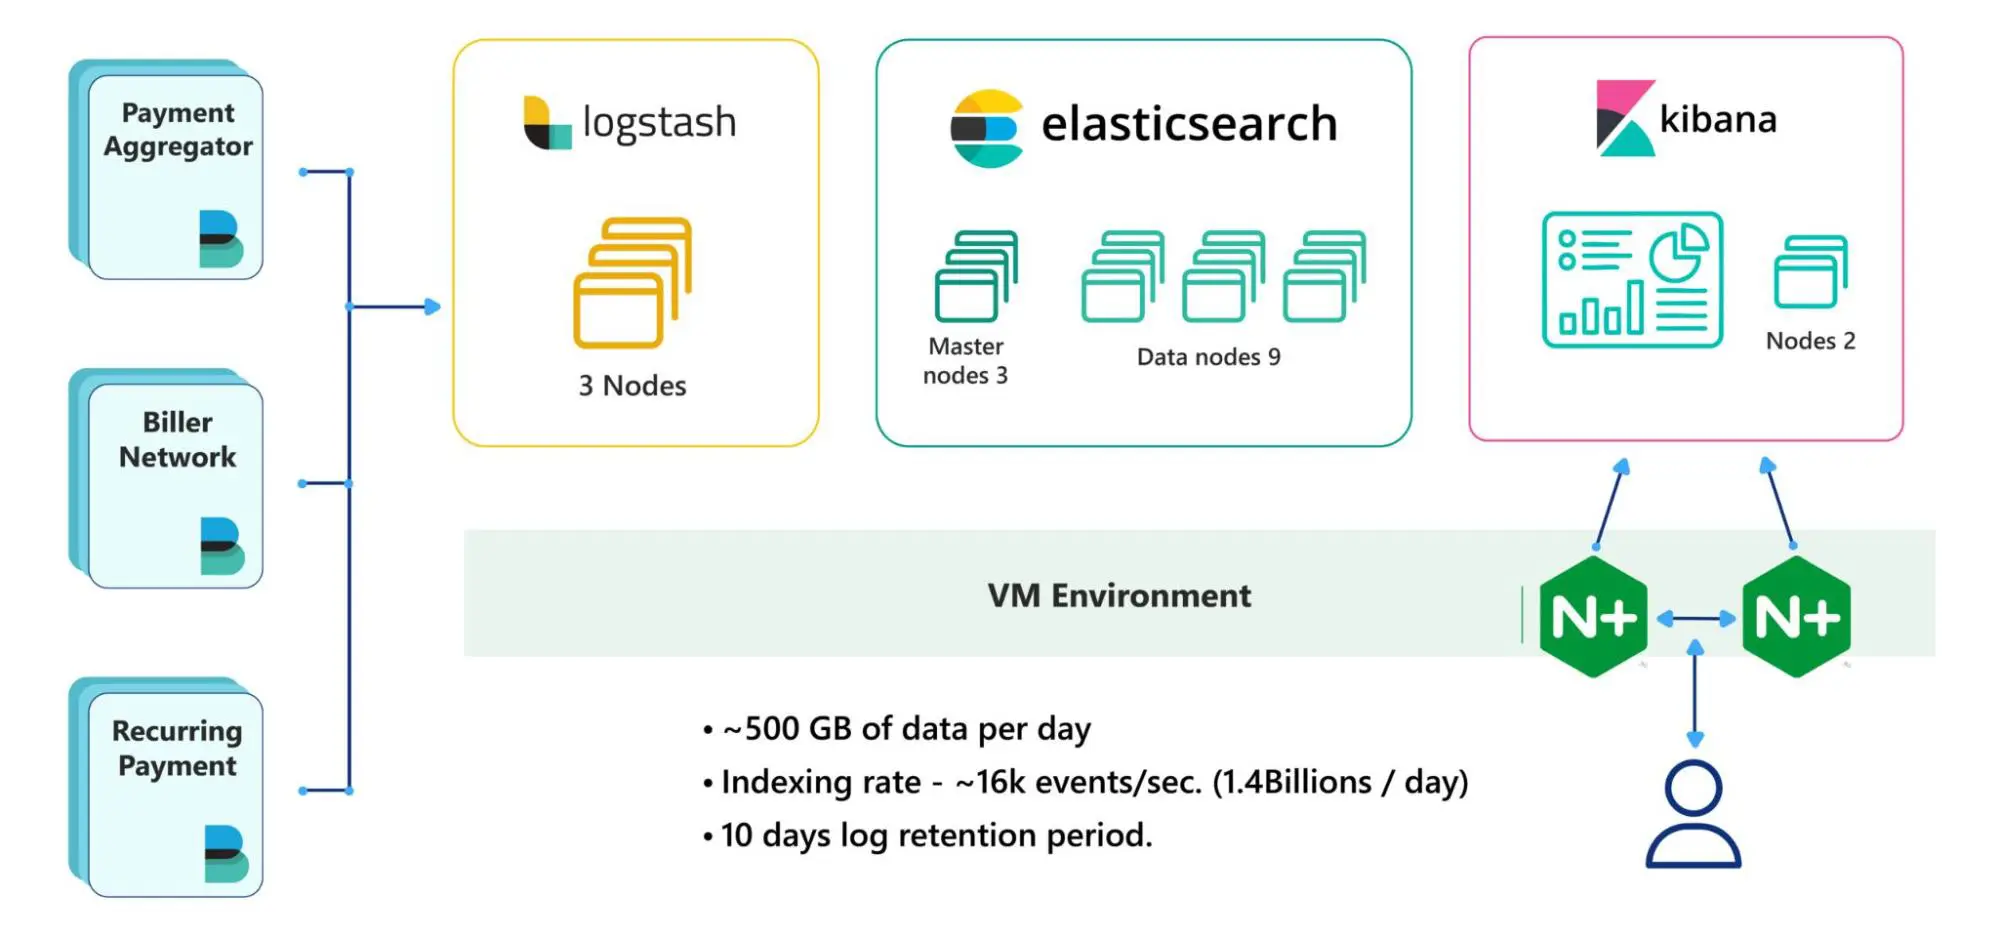
Logs from all three product lines flow through three Logstash nodes into an Elasticsearch cluster — three master nodes, nine data nodes — that handles indexing and search across the full volume. Engineers work in dashboards served by two Kibana nodes, tracing transactions and watching service health, with a two-node NGINX+ layer balancing the load.
Day to day, that stack sustains:
| Metric | Value |
|---|---|
| Log data ingested | ~500 GB/day |
| Indexing rate | ~16,000 events/sec |
| Events processed | ~1.4 billion/day |
| Log retention | 10 days |
| Microservices monitored | 25+ |
At current day, 16,000 events per second isn't a spike the platform absorbs every now and again, but its steady state.
Elasticsearch indexes the stream as it arrives and keeps all of it searchable, so half a terabyte of daily logs is something engineers can actually work with rather than a momentous storage burden. Nobody digs through raw files hoping they grabbed the right one instead, they query everything and start from what actually happened.
"For this customer, we sized it around what their services actually produce, not reference architecture. 16,000 events per second is the steady state here, not a spike, and the cluster is built for that number every hour of the day. Now, 10 days of logs stay searchable, and an investigation can start from the full window."
What's changed?
Troubleshooting across microservices is now seamless. A failed transaction is traced by its trace ID through every service it touched, with the log context showing where it degraded, what latency looked like at each hop, and what status codes came back, so root cause is reachable in both development and production.
Each microservice's latency is monitored individually, and response time and transaction analysis run significantly faster than before. Engineers get detailed stats on every API call, which means anomalies get caught and risks mitigated before they turn into merchant-facing incidents. Service restarts now trigger critical alerts instead of passing silently.
Just as important: The platform's performance under real production load gives this major Indian payment provider the confidence to move more critical workloads onto it. For a country whose population currently sits at about 1.5 billion people, that's not a consideration to take lightly.
From piecing together fragments to one search
The difference from where they started is stark. A year ago, a failed payment meant engineers hopped between services, pulled logs by hand, and tried to piece together a story from fragments that didn't connect.
Now they search a trace ID and the whole journey is in front of them — every service the transaction touched, how long each hop took, and what came back at every step. Latency issues show up on a dashboard before they become complaints, and a service restart triggers an alert instead of passing in silence.
More than this, though, the platform has done something harder to measure but just as valuable: It's earned the team's trust. Running comfortably at this volume gave the customer the confidence to bring more of its critical workloads into production on Elastic, knowing the visibility will hold as the business grows.
For a company whose product is other people's money moving reliably, that's the outcome that matters: problems found before customers feel them, at whatever scale tomorrow brings.
"Running at this volume under real production load is what earned their trust. Once a team sees the visibility hold; moving more critical workloads onto it stops being a risk conversation."
See how Elastic Observability delivers log monitoring at billion-event scale or start now with a free trial.