Monitoring Logstash Filters: X-ray glasses included
Editor's Note (August 3, 2021): This post uses deprecated features. Please reference the map custom regions with reverse geocoding documentation for current instructions.
At Elastic, we are big fans of providing self-service tools to successfully deploy and maintain our software in production. One of the most popular features of Elasticsearch is the APIs used to retrieve it's operational data. While Logstash was always easy to get started with, it was a bit of a black box when it came to managing it in production. Administrators had to rely on external monitoring systems to make sure Logstash was functioning without any issues. A core theme in 5.0 release was to make it easier to manage Logstash. In this post, I'll show you how to monitor your Logstash filters using the inbuilt APIs and the Elastic Stack itself.
What is my ingestion rate?
If you have deployed Logstash as part of a high-volume data ingestion pipeline, one of the most important metrics to monitor is “how fast is Logstash ingesting data”. Previously, to answer this question, you had to install the metrics filter to generate the ingestion stats. Starting with 5.2, we've made it really easy to monitor Logstash using the Elastic Stack itself in addition to the native APIs which were introduced in Logstash 5.0. The x-pack plugin for Elastic Stack bundles an agent that you can install on all your production Logstash nodes. It also ships with charts for the most important metrics information that let you visualize Logstash monitoring data out of the box. The monitoring feature in x-pack is under the Basic license which means you get all this awesomeness for free. The APIs mentioned here are all part of the open source Logstash distribution.
Let's get started:
- Install x-pack on your production Logstash nodes. This assumes you've already configured your production cluster for monitoring.
cd $LS_HOME
bin/logstash-plugin install x-pack
This plugin should be installed on all Logstash nodes you wish to monitor. The x-pack plugin extends your Logstash to periodically ship all the metrics it collects to your production Elasticsearch cluster. Once installed, you can configure the shipping agent using the logstash.yml file.
- Configure your Elasticsearch end-point.
xpack.monitoring.elasticsearch.url: "http://my-es-prod-node:9200"
We strongly recommend that you enable security for your production Elasticsearch clusters. Once you've installed x-pack, you can use the extensive security features that ships with it.
- Restart Logstash and navigate to http://kibana-url:5600
Pick the Logstash you want to get detailed monitoring info:
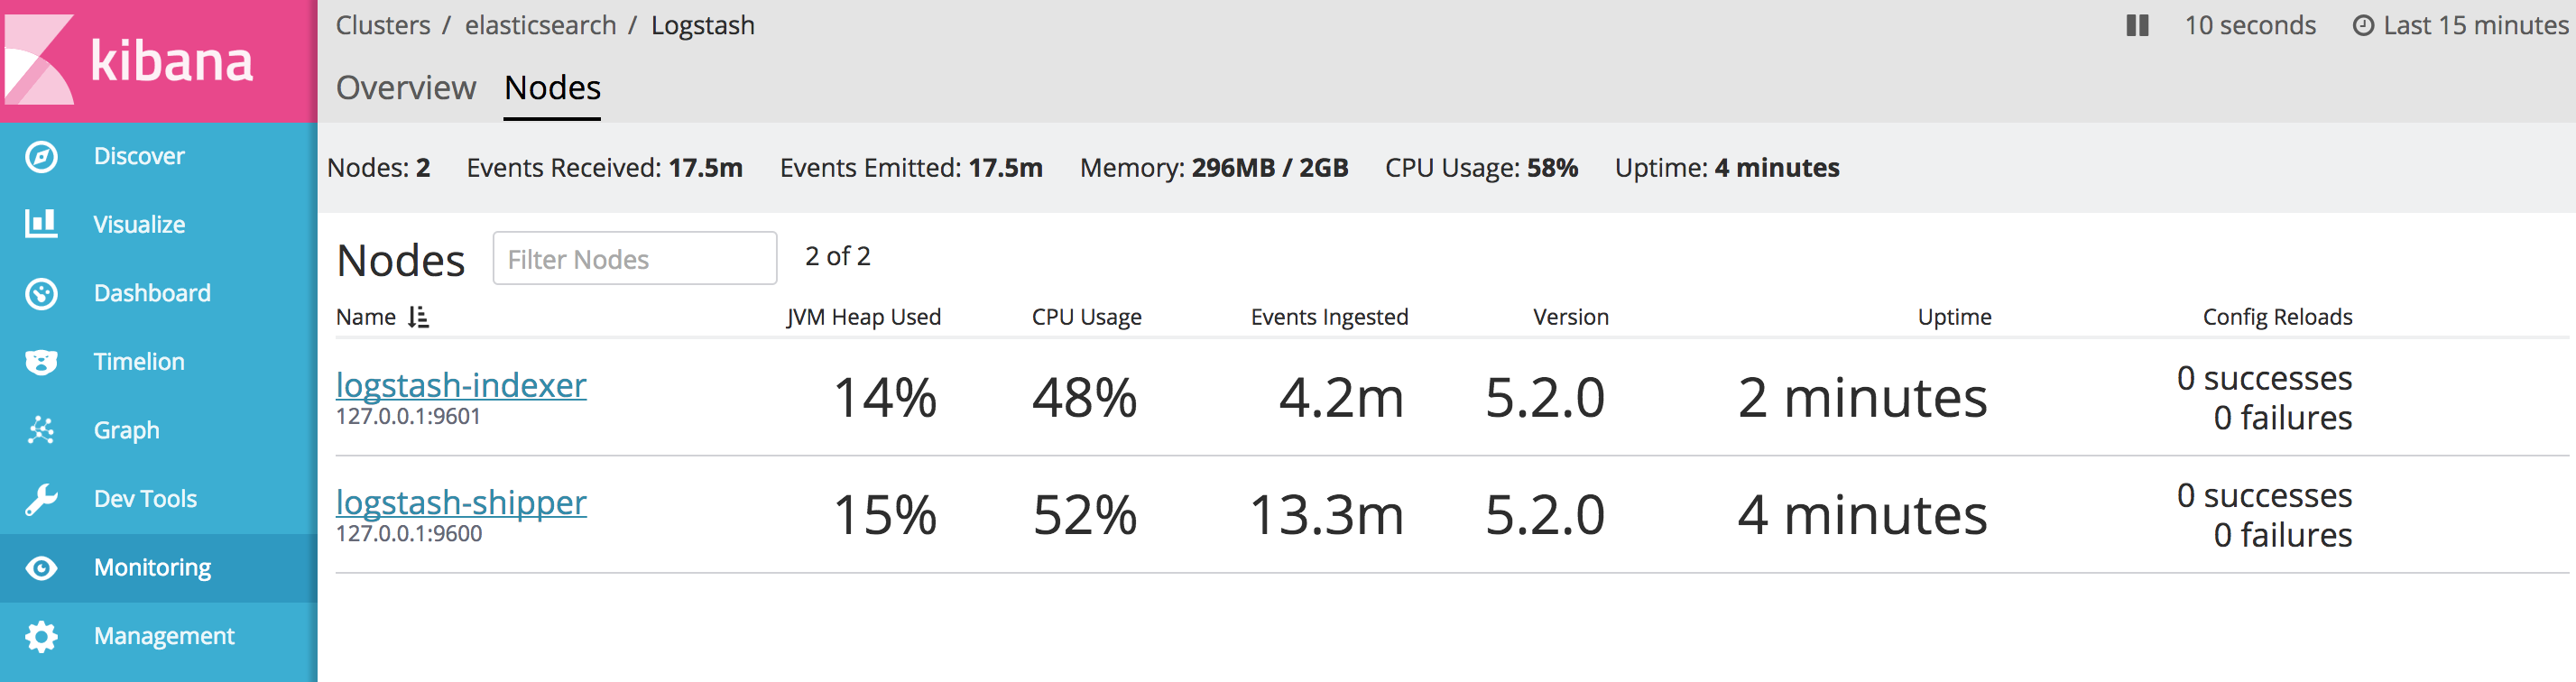
What are my slowest filters?
Filters are the workhorses of Logstash, which means they can be the slowest stage of your pipeline, compared to the inputs and outputs stage. The performance of a filter is also dependent on the type of data it processes. For example, the grok filter, a very popular one, uses a regular expression engine to extract fields. And certain types of event data can throw your grok filter into an expensive backtracking loop. Before we attempt to tweak the filters for performance, the first step if to actually figure out which one of them is the slowest:
curl localhost:9600/_node/stats/pipeline?pretty
...
"filters":[
  {
     "id":"2178468f89ab43c6f32e934d3cb587e3c850d93a-4",
     "events":{
        "duration_in_millis":24005,
        "in":49482,
        "out":49480
     },
     "name":"geoip"
  },
  {
     "id":"2178468f89ab43c6f32e934d3cb587e3c850d93a-2",
     "events":{
        "duration_in_millis":84193,
        "in":49483,
        "out":49482
     },
     "matches":29400,
     "failures":20083,
     "patterns_per_field":{
        "message":1
     },
     "name":"grok"
  },
  {
     "id":"2178468f89ab43c6f32e934d3cb587e3c850d93a-5",
     "events":{
        "duration_in_millis":44353,
        "in":49480,
        "out":49477
     },
     "name":"useragent"
  }
  ...
For all the plugins in our pipeline, this API provides a per-pipeline break down of event stats. One particular field of interest is the duration_in_millis field which reports the total amount of time spent in a filter for all the events that passed through it. If you divide duration_in_millis by events.in, you should get the average time events have spent in this filter. From the response above, it looks like the grok filter is the slowest, followed by the useragent filter. Zooming in on the grok filters, we can also see that there are quite a bit of grok match failures. It is plausible that the regular expression engine tried parsing the pattern(s), and may have gone into a backtracking loop wasting a lot of CPU cycles, contributing to the overall slowness.

filter {
  grok {
    id => "apache_common_log_praser"
    pattern => ..
  }
  grok {
    id => "java_exception_logs_parser"
    pattern => ..
  }
}
Now that we've identified the grok filter as the slowest, we can tweak the regular expression pattern to optimize the performance. We have previously posted about various ways to tame your Grok filter, which is a highly recommended read.
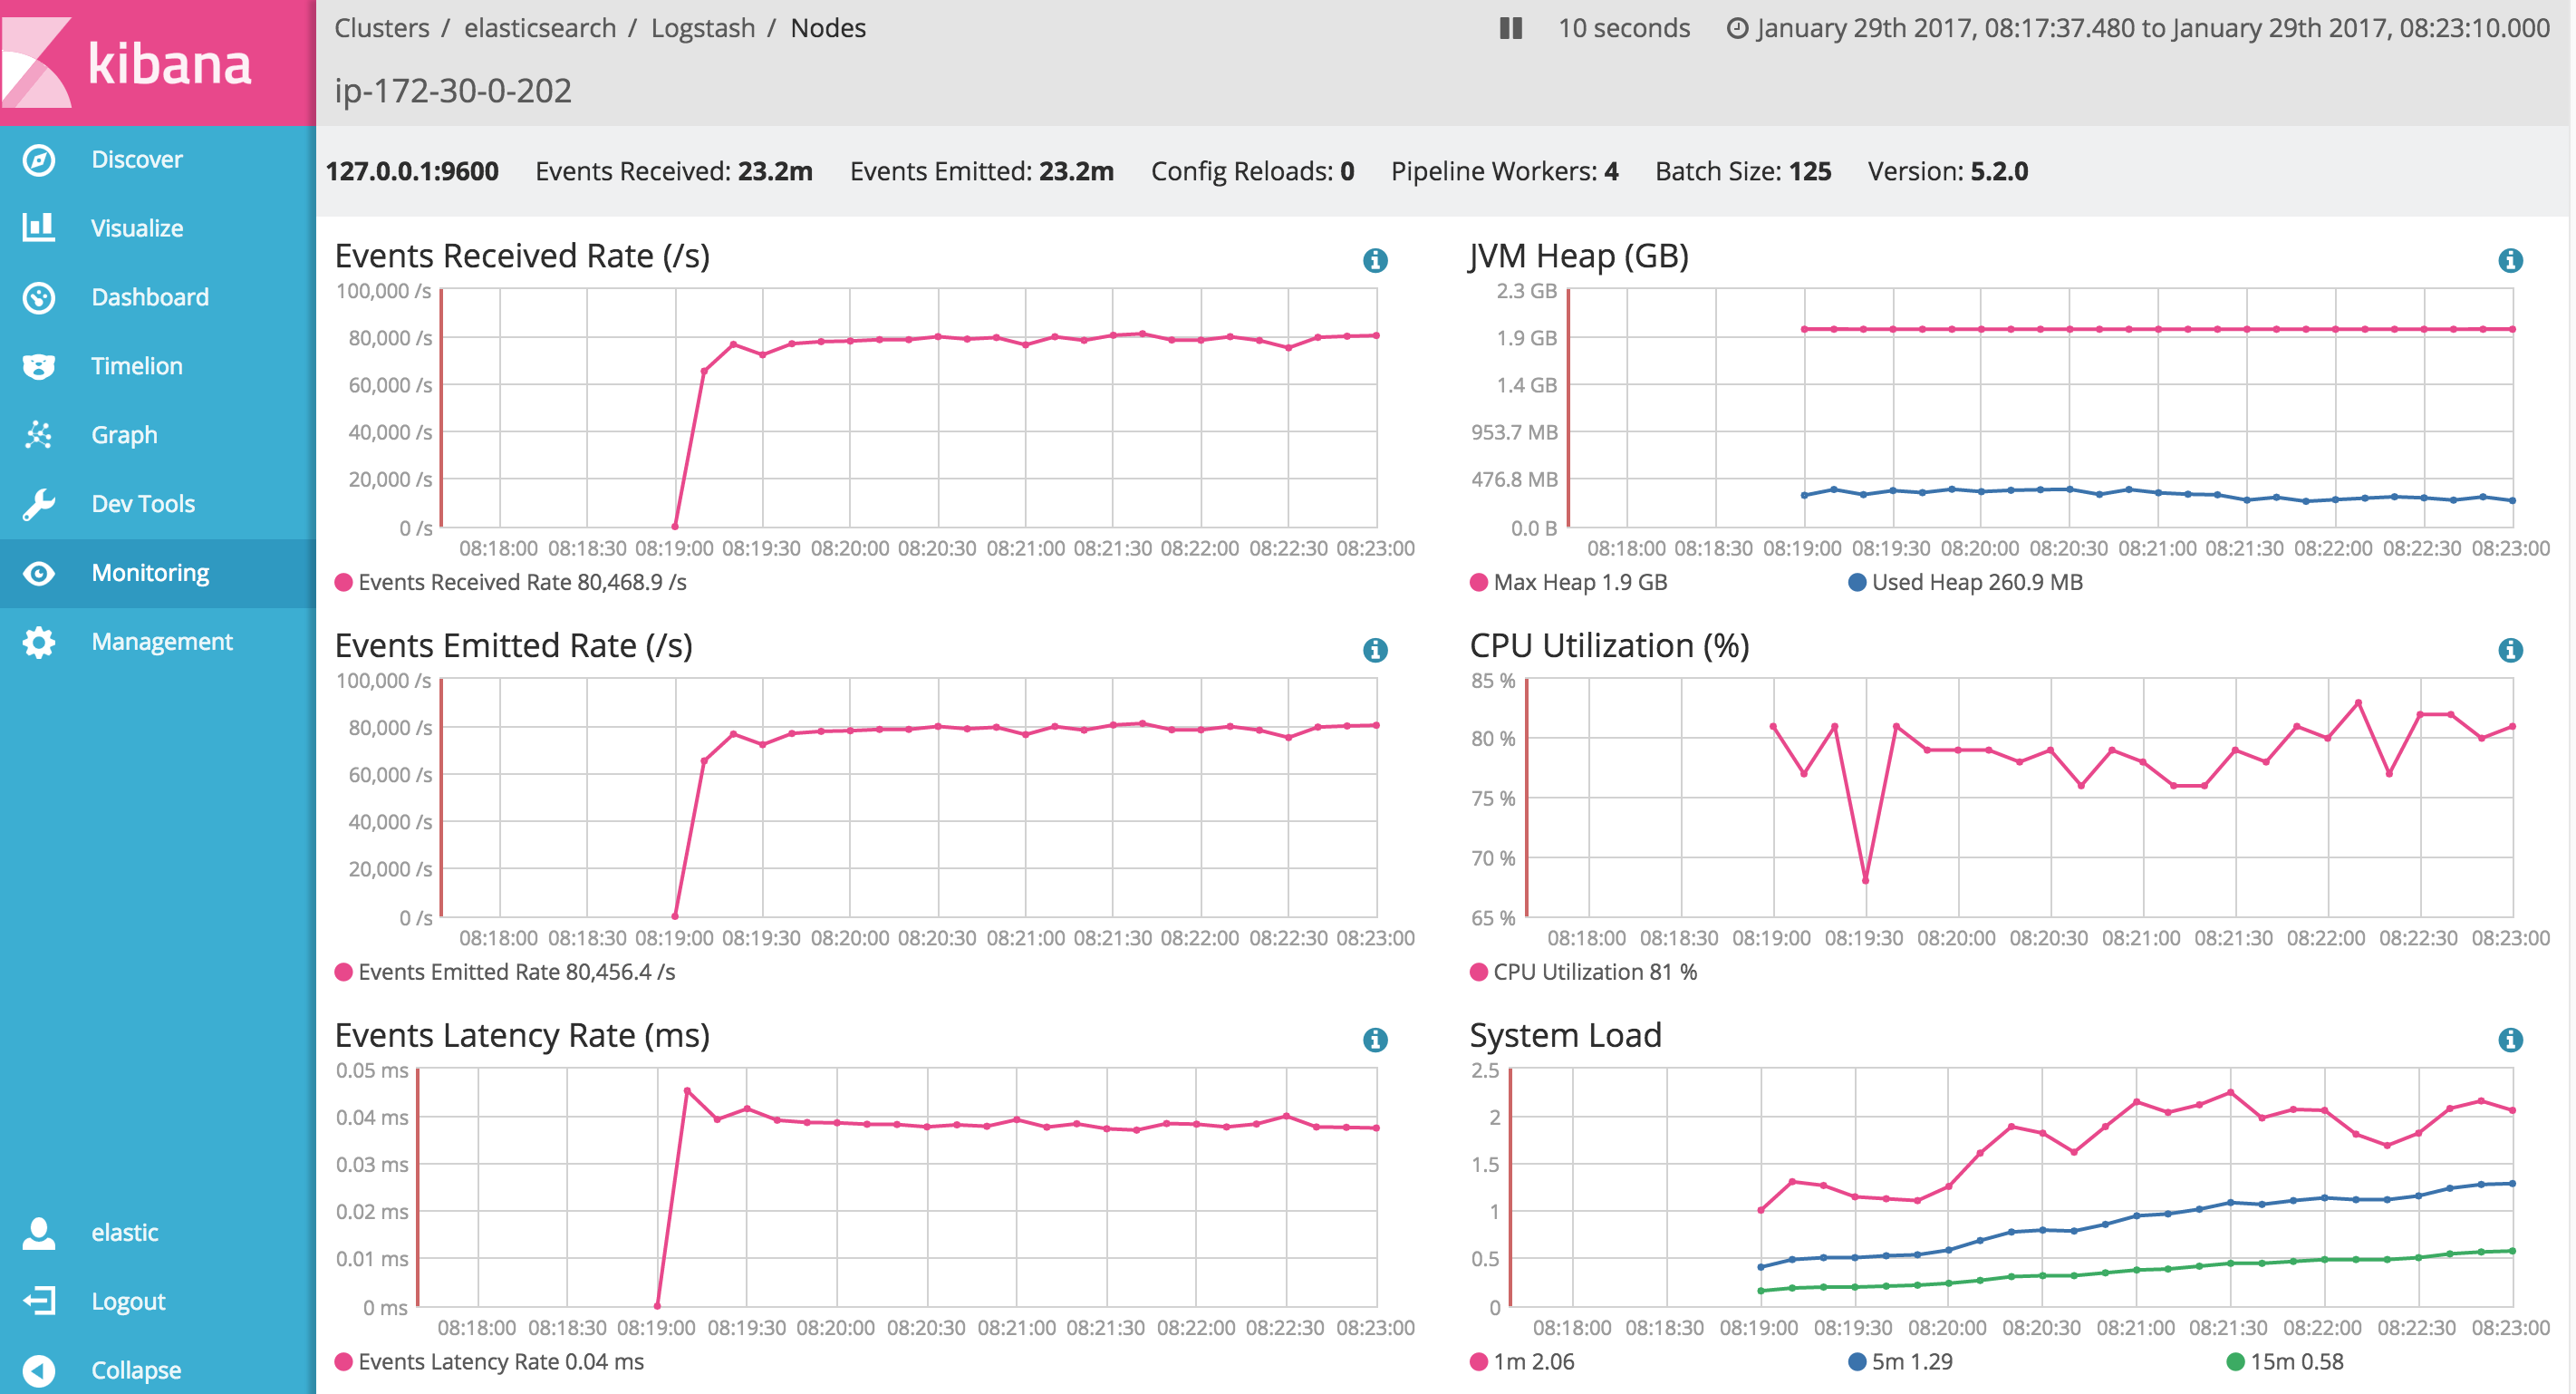
If you head over to the monitoring UI, the events latency graph shows you aggregated information on how long it takes on average for events to be processed in your pipeline.
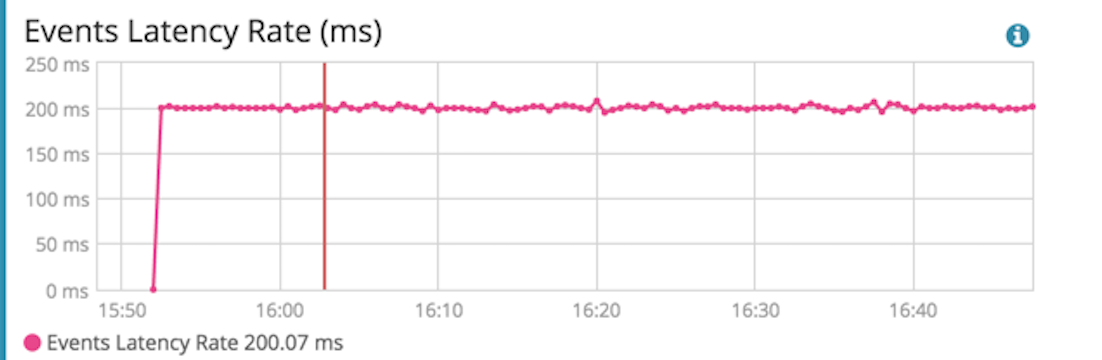
One of my favorite parts of shipping monitoring data to Elasticsearch is the access to historical information. As you iterate over your configs, you can validate from these graphs if your changes made a difference to the overall pipeline latency. This historical information can also be used to spot performance regressions over time in your production setting. You are no longer flying in the dark!
Slowlog
In our previous section, we showed you how to identify the slow sections of the pipeline. But, this doesn't pinpoint which events may have contributed to the slowdown. Enter the slowlog feature.
Slowlog adds the ability to log when a specific event takes an abnormal amount of time to make its way through the pipeline. You can define the criteria when you want the slowlog to be triggered. Just like normal application logs, you can find slow-logs in your —path.logs directory. In your logstash.yml file, add this setting:
slowlog.threshold.warn: 2s
When events take more than 2 seconds to be processed, you should see:
[2016-10-27T13:48:19,308][WARN ][slowlog.logstash.filters.grok] event processing time {:took_in_millis=> 2130, :event=>"{\"sequence\":1,\"@timestamp\":\"2016-10-27T20:48:18.150Z\",\"@version\":\"1\",\"host\":\"elasticbox-2.local\",\"mes
sage: \"217.69.133.237 - - [11/Sep/2014:21:58:29 +0000] "GET /scripts/netcat-webserver HTTP/1.1" 304 - "-" "Mozilla/5.0 (compatible; Linux x86_64; Mail.RU_Bot/2.0; +http://go.mail.ru/help/robots)""\"}\"}
Hot Spots
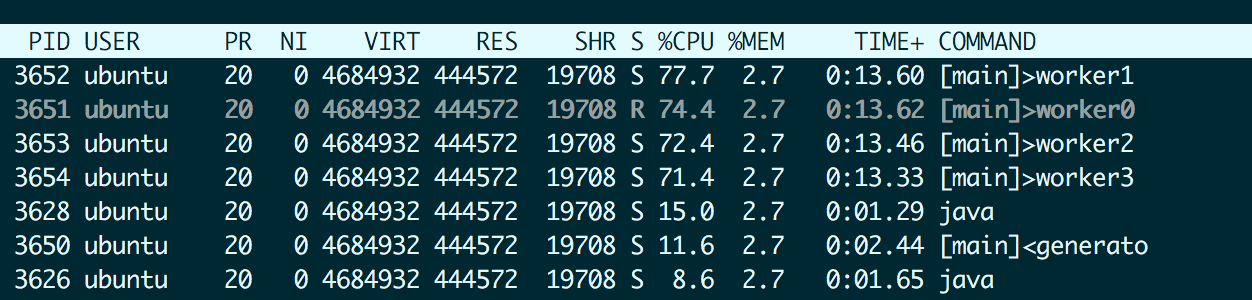
If the CPU on your Logstash instance is running red hot, you can issue a command like top -H to analyze what parts of the Logstash pipeline is consuming the most CPU. Logstash threads are labeled based on the stage and plugin name, so from the output of top, one can quickly find out which parts are CPU intensive. For example, [main]>worker1 denotes a filter + output thread, while [main]<generator denotes a generator input.
While this is super useful, it would be nice to zoom into those threads to find the expensive parts. We have an API just for that — the hot threads API provides a thread dump or a snapshot of the java threads sorted by the time spent.
curl localhost:9600/_node/hot_threads?human
::: {}
Hot threads at 2017-01-29T04:18:55+00:00, busiestThreads=3:
================================================================================--------------------------------------------------------------------------------
64.07 % of cpu usage, state: runnable, thread name: '[main]>worker0'
    org.jruby.RubyRegexp$SearchMatchTask.run(RubyRegexp.java:273)
    org.jruby.RubyThread.executeBlockingTask(RubyThread.java:1066)
    org.jruby.RubyRegexp.matcherSearch(RubyRegexp.java:235)
    org.jruby.RubyRegexp.search19(RubyRegexp.java:1780)
    org.jruby.RubyRegexp.matchPos(RubyRegexp.java:1720)
    org.jruby.RubyRegexp.match19Common(RubyRegexp.java:1701)
    org.jruby.RubyRegexp.match_m19(RubyRegexp.java:1680)
    org.jruby.RubyRegexp$INVOKER$i$match_m19.call(RubyRegexp$INVOKER$i$match_m19.gen)
    org.jruby.internal.runtime.methods.JavaMethod$JavaMethodOneOrNBlock.call(JavaMethod.java:350)
    org.jruby.runtime.callsite.CachingCallSite.call(CachingCallSite.java:168)
In the above example response, we see again that the regex engine used by the Grok filter is the busiest thread. You could also use this API to find out if your Logstash is stuck performing I/O operations.
Conclusion
In this post, we introduced you to our new monitoring UI feature and showed a few ways to identify slow parts of Logstash. We are not done yet — our roadmap has exciting monitoring features that will make Logstash and your pipelines even more of a breeze to manage. This post is part of a series on monitoring, so stay tuned for our next one and all our product updates.