GeoIP in the Elastic Stack
Intro
One of the cool things about the Elastic Stack is that you can take ordinary log files and transform them into a treasure trove of value. From finding out how much bandwidth your internal users are using to help plan for staff growth and internet capacity for all of your offices. Discovering what browsers access your site to guide if you choose mobile or desktop optimisation. Or seeing exactly where your end users are logging in from so that the marketing and sales departments can improve their engagement. It's all possible with a few simple steps!
A common request we see is how to take IP addresses or hostnames, the representation of a host or system people use to access other systems on the internet, and turn them into a latitude and longitude point so you can answer the sorts of questions we just asked. Or in other words - geoip translations.
This post digs into the basics of getting started with geoip in the Elastic Stack, as well as some common troubleshooting tips.
Enhance!
Let's use a fake Apache log line as the sample data, this one in fact:
104.194.203.69 - - [01/Apr/2017:16:21:15 +0000] "GET /favicon.ico HTTP/1.1" 200 3638 "-" "Mozilla/5.0 (Macintosh; Intel Mac OS X 10_11_6) AppleWebKit/537.36 (KHTML, like Gecko) Chrome/52.0.2743.116 Safari/537.36"
From there we'll leverage both the Ingest API and Logstash to demonstrate how you can use multiple methods for processing your data. Both methods will rely on very similar steps to convert an IP address or hostname into a set of geo coordinates, which means you can easily convert one to the other.
As a quick overview of what will happen, the Ingest API and Logstash both take the IP/hostname info that is part of an event, do a lookup in an internally stored copy of the MaxMind GeoLite2 Free database, and then create a number of extra fields in the event with the geo coordinates and other fields such as city, state and country. From there we can plot these on a map in Kibana.
Let's get processing and see what this all looks like. :)
Ingest API
The Ingest API was added to Elasticsearch 5.0 and is a neat way of leveraging existing cluster resources to process documents, using things like grok to pattern match and extract. Use cases so far include sending logs directly to Elasticsearch from Filebeat or processing Arxiv.org papers with the ingest-attachment plugin (the replacement for mapper-attachment).
And if these don't fit your need you can even design your very own ingest plugin using this cookie-cutter, for example, to provide natural language processing functionality natively to Elasticsearch.
For our use case, we need to install the geo-ip plugin, as it's not included by default, so on all nodes in our cluster we will run;
sudo /usr/share/elasticsearch/bin/elasticsearch-plugin install ingest-geoip
And then make sure to restart the node(s) to enable the plugin.
Now one of the neat things with the Ingest API is that you can simulate a pipeline, basically run a trial of what the event processing steps generate, but without indexing the event into Elasticsearch. This allows you to test your processor ahead of time and make appropriate changes if needed.
To run this simulation, we simply define our pipeline and pass in our sample document like this (note - we do need to escape any quotes in the event with backslashes);
POST _ingest/pipeline/_simulate
{
  "pipeline" : {
"processors" : [
    {
      "grok": {
        "field": "message",
        "patterns": ["%{COMBINEDAPACHELOG}"]
      }
    },
    {
      "geoip": {
        "field": "clientip"
      }
    }
  ]
  },
  "docs": [
    {
      "_source": {
        "message": "104.194.203.69 - - [01/Apr/2017:16:21:15 +0000] \"GET /favicon.ico HTTP/1.1\" 200 3638 \"-\" \"Mozilla/5.0 (Macintosh; Intel Mac OS X 10_11_6) AppleWebKit/537.36 (KHTML, like Gecko) Chrome/52.0.2743.116 Safari/537.36\""
      }
    }
  ]
}
If you are familiar with Logstash, you can see we are using a pre-defined grok pattern called %{COMBINEDAPACHELOG}. Within that is a %{IPORHOST:clientip} field that we then use in the geoip processor to get the information we want.
The output we get from this call is as follows;
{
  "docs": [
    {
      "doc": {
        "_type": "_type",
        "_id": "_id",
        "_index": "_index",
        "_source": {
          "request": "/favicon.ico",
          "agent": """"Mozilla/5.0 (Macintosh; Intel Mac OS X 10_11_6) AppleWebKit/537.36 (KHTML, like Gecko) Chrome/52.0.2743.116 Safari/537.36"""",
          "geoip": {
            "continent_name": "Oceania",
            "city_name": "Alexandria",
            "country_iso_code": "AU",
            "region_name": "New South Wales",
            "location": {
              "lon": 151.2,
              "lat": -33.9167
            }
          },
          "auth": "-",
          "ident": "-",
          "verb": "GET",
          "message": """104.194.203.69 - - [01/Apr/2017:16:21:15 +0000] "GET /favicon.ico HTTP/1.1" 200 3638 "-" "Mozilla/5.0 (Macintosh; Intel Mac OS X 10_11_6) AppleWebKit/537.36 (KHTML, like Gecko) Chrome/52.0.2743.116 Safari/537.36"""",
          "referrer": """"-"""",
          "response": "200",
          "bytes": "3638",
          "clientip": "104.194.203.69",
          "httpversion": "1.1",
          "timestamp": "01/Apr/2017:16:21:15 +0000"
        },
        "_ingest": {
          "timestamp": "2017-04-11T04:19:00.518Z"
        }
      }
    }
  ]
}
Next, we can save this pipeline to Elasticsearch, set a template to make sure that the geoip values are treated correctly and then use Filebeat to push data directly to our cluster for ingestion and storage, with our added geoip info being added automatically!
Logstash
Just like with the ingest API, the geoip filter in Logstash is our starting point. This comes as part of the default Logstash package so we don't need to do anything other than get stuck into our configuration.
A basic configuration to process our event will look like this;
input { stdin {} }
filter {
  grok { match => { "message" => "%{COMBINEDAPACHELOG}" } }
  geoip { source => "clientip" }
}
output { stdout { codec => "rubydebug" } }
We are again using a pre-defined grok pattern and, unsurprisingly, the grok patterns for Ingest API are the same as for the grok filter in Logstash. This lets us reuse the functionality with ease.
After processing the sample data with our configuration we get;
{
        "request" => "/favicon.ico",
          "agent" => "\"Mozilla/5.0 (Macintosh; Intel Mac OS X 10_11_6) AppleWebKit/537.36 (KHTML, like Gecko) Chrome/52.0.2743.116 Safari/537.36\"",
          "geoip" => {
              "timezone" => "Australia/Sydney",
                    "ip" => "104.194.203.69",
              "latitude" => -33.9167,
        "continent_code" => "OC",
             "city_name" => "Alexandria",
         "country_code2" => "AU",
          "country_name" => "Australia",
         "country_code3" => "AU",
           "region_name" => "New South Wales",
              "location" => [
            [0] 151.2,
            [1] -33.9167
        ],
           "postal_code" => "1435",
             "longitude" => 151.2,
           "region_code" => "NSW"
    },
           "auth" => "-",
          "ident" => "-",
           "verb" => "GET",
        "message" => "104.194.203.69 - - [01/Apr/2017:16:21:15 +0000] \"GET /favicon.ico HTTP/1.1\" 200 3638 \"-\" \"Mozilla/5.0 (Macintosh; Intel Mac OS X 10_11_6) AppleWebKit/537.36 (KHTML, like Gecko) Chrome/52.0.2743.116 Safari/537.36\"",
       "referrer" => "\"-\"",
     "@timestamp" => 2017-04-14T00:40:18.814Z,
       "response" => "200",
          "bytes" => "3638",
       "clientip" => "104.194.203.69",
       "@version" => "1",
           "host" => "bender.local",
    "httpversion" => "1.1",
      "timestamp" => "01/Apr/2017:16:21:15 +0000"
}
Now note that the location is actually an array of coordinates, and it keeps the latitude and longitude as separate fields in case it is needed. Bingo!
Given that we want to store the data in Elasticsearch, so that we can analyse it with Kibana, make sure you change the output to use the elasticsearch output plugin.
Mapping, for Maps
Both Logstash and Filebeat can auto-manage the template they need to ensure that a geoip field that is sent to Elasticsearch is correctly handled as a geo_point data type.
Assuming we are using the default Logstash or Filebeat index name pattern, sending our sample event from Logstash to Elasticsearch means we also apply the default template that ships with either Logstash or with Filebeat. The specific parts of interest for us are;
"geoip"  : {
  "dynamic": true,
  "properties" : {
    "ip": { "type": "ip" },
    "location" : { "type" : "geo_point" },
    "latitude" : { "type" : "half_float" },
    "longitude" : { "type" : "half_float" }
  }
}
What this all means is that any field called geoip.location, which is how we refer to these nested fields, that is sent to Elasticsearch will be automatically mapped as a geo_point.
If you are using the Ingest API directly you will need to make sure you have an existing template in place. The easiest option here is to copy the above Logstash or Filebeat templates, from the links, and alter them accordingly.
Eagle eyed readers would have noted that the geoip data outputs from Ingest API and Logstash were differently formatted. Elasticsearch accepts multiple geoip formats as the GeoJSON standard allows this as well, you can see the different formats that are allowed in the documentation.
Let's get pointy
Now that we have processed data inside Elasticsearch, let's build some graphs! Once you have added an index pattern to Kibana, we can make sure the field is defined as a geopoint. A correctly mapped field will look like this under the Index Pattern settings;
![]()
And like this in Discover;

Now that is all confirmed and completed, head over the Visualisation section and create a new tile map, using the index pattern you just defined. Once you pick the pattern, and assuming your geopoints are correctly mapped, Kibana will automatically populate the visualisation settings such as which field to aggregate on, and display the map almost instantly. Which will look something like this;
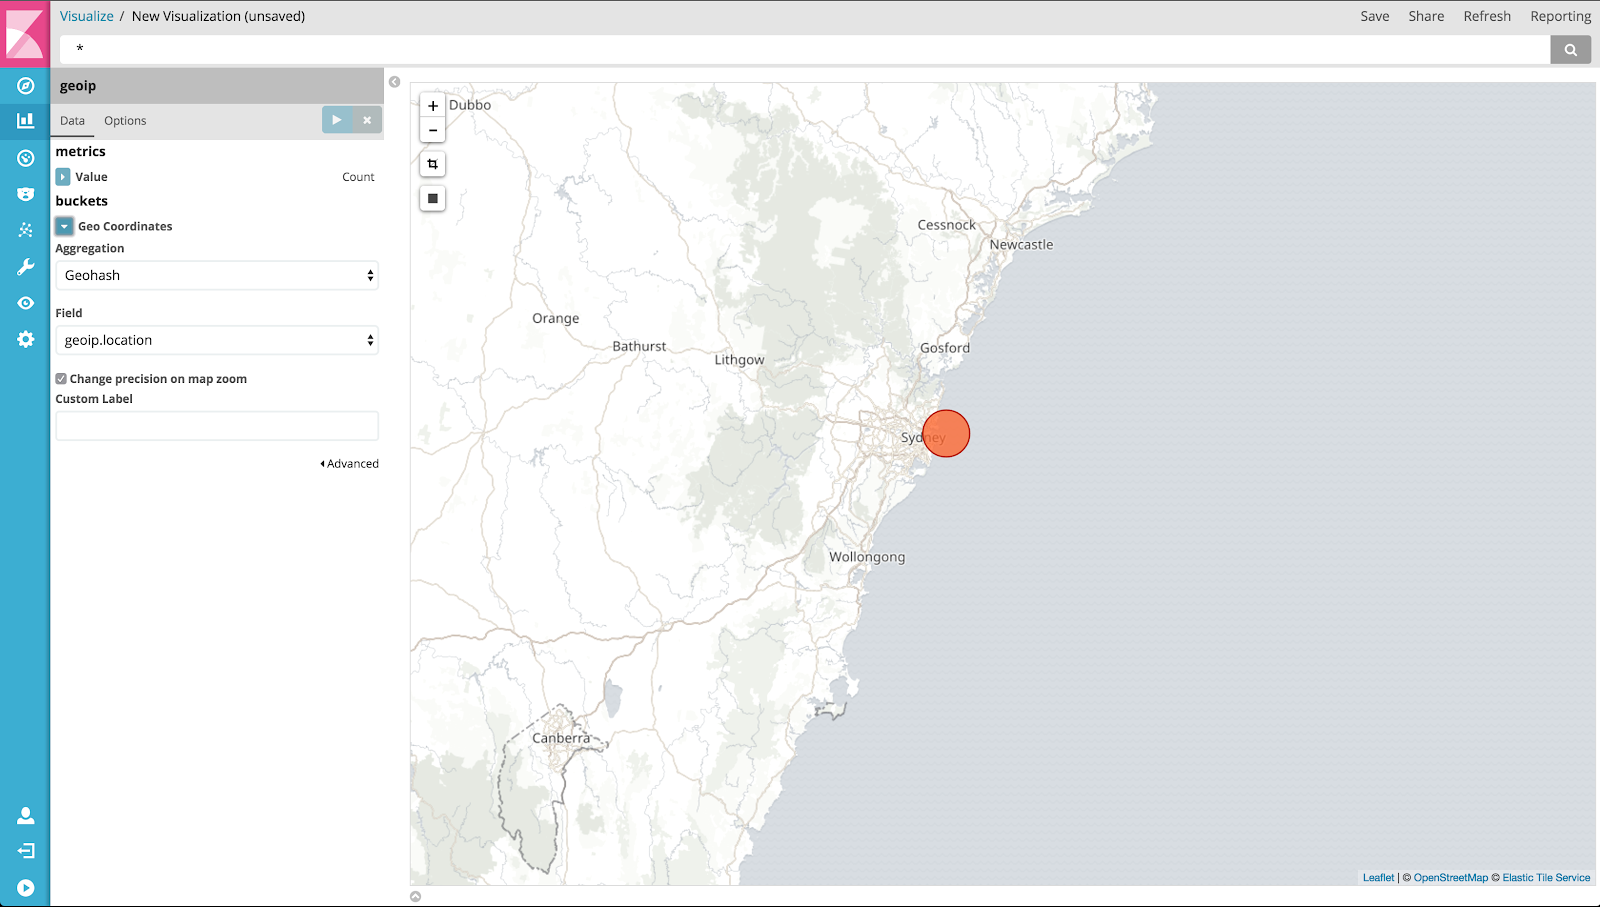
In our example we only have one data point (G'Day mates!), but with more you can zoom and pan and Kibana will redistribute the aggregated data as needed, and you can even create a geo bounding box or filter to get to the specific data you need.
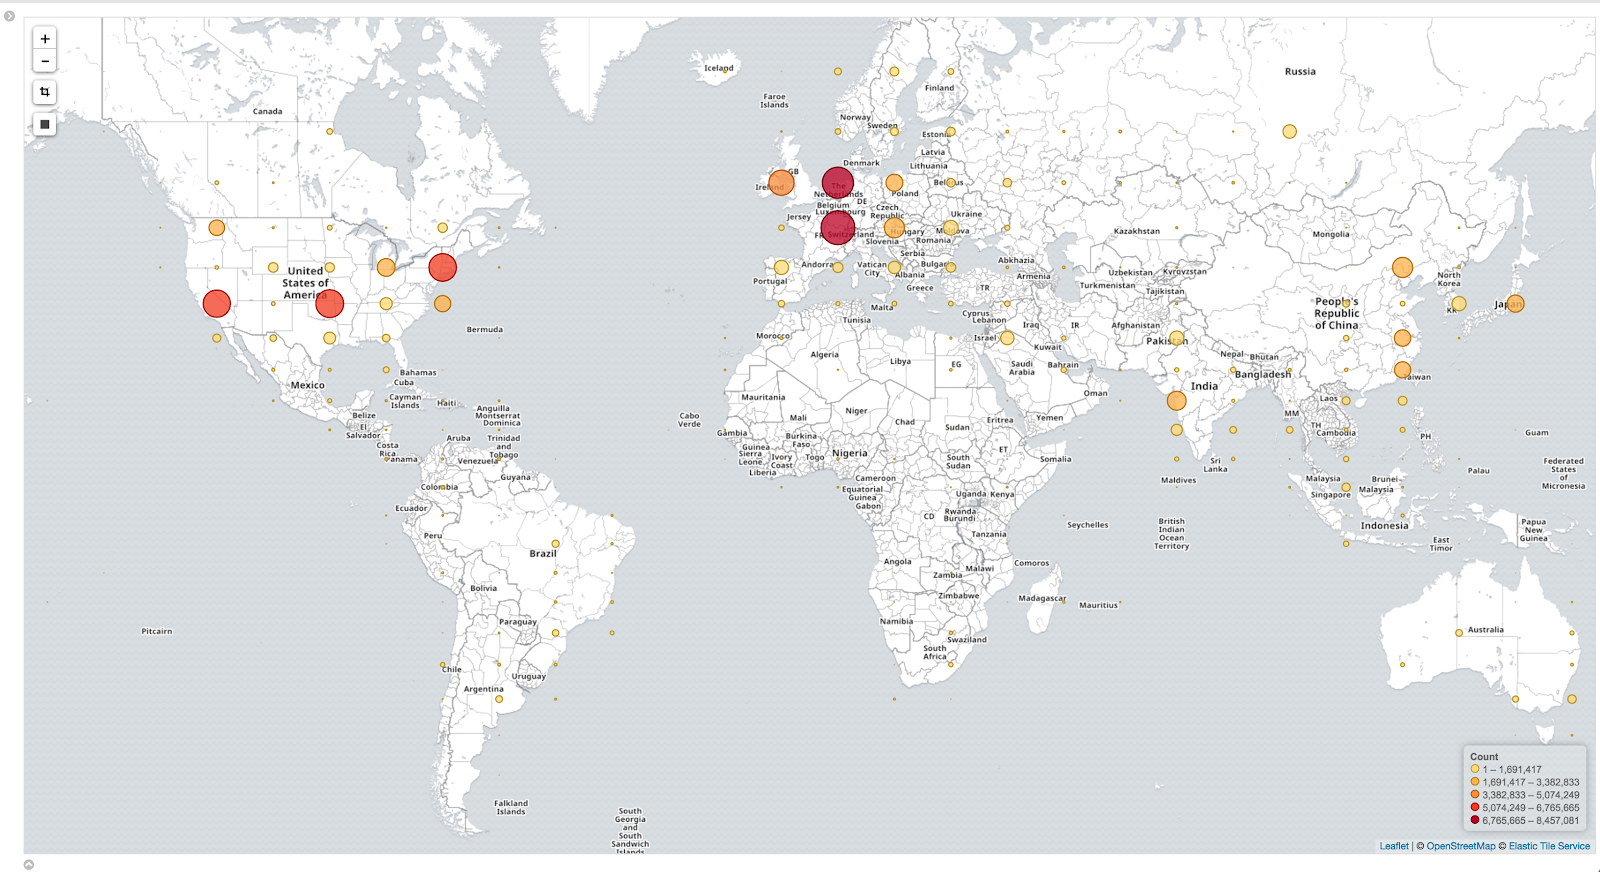
Here's an example of a more populated map. This data is 100% real and extracted from visitors to our blog, ie you, here and now!
What if I can't create a map?
Sometimes things don't go to plan. You've indexed your data into Elasticsearch and now you want to use it in Kibana, but when you try to create a new tilemap there's no field to select! Much sadness ensues.
This is a problem users face when working with geoip and it can be caused by a few common anti-patterns.
Moving things to custom fields
A few things we see from time to time are configs like this;
geoip {
  source => "src_ip"
  target => "geoip"
  add_field => [ "[geoip][coordinates]", "%{[geoip][longitude]}" ]
  add_field => [ "[geoip][coordinates]", "%{[geoip][latitude]}"  ]
}
mutate {
  convert => [ "[geoip][coordinates]", "float"]
}
The geoip filter already creates a location field, as we saw in the examples above, using add_field simply duplicates the data and won't match the default template in Elasticsearch. This means that the data will likely be dynamically mapped to a numeric array and you won't be able to use a map in Kibana without further modifications.
Another variation is changing the target value from the default - geoip. If you do this you will need to update the index mapping/template to cater for this. More on this next.
Custom Index Names
If you use a custom index name/pattern in the elasticsearch output, or change the default target field for the geoip data to be populated in, you will need to copy the default Logstash/Filebeat template we mentioned above and make sure that it matches these changes. You can do this by copying the file that Logstash/Filebeat uses and then referring to the change one, or take the template from the Elasticsearch APIs and modify that.
One quick tip if you take this approach, look for and update the "template": "logstash-*", value in the template or file.
Ultimately it might be easier to use an index name of logstash-customvalue-YYYY.MM.DD (where customvalue is a value of your choosing), rather than changing the pattern entirely. This way the default template will still apply.
_geoip_lookup_failure
If you get this then Logstash could not find the field you said should contain an IP or hostname to map. Check your grok pattern is extracting the field correctly and your geoip filter references it correctly.
Using a stdout { codec => rubydebug } section in your Logstash output can also help you see what is, or isn't, happening.
Inaccurate Geolocation
You may find the IP is matched to an inaccurate location. Be aware that the free Maxmind database that is used is “comparable to, but less accurate than, MaxMind's GeoIP2 databases”, and, “IP geolocation is inherently imprecise. Locations are often near the center of the population.” See the MaxMind site for further details.
There are commercially available databases that may be more accurate. To use one you will need to define the database path in your Logstash configuration, or database_file for Ingest API, to point to the obtained database file.
No results found
Check that your time picker - in the top right of the window - is pointing to the correct time window that your data lies in. If it is correct then head to Discover and make sure the events in the time window definitely have a geoip field.
If you still get nothing then double check things from the beginning of this post, especially the mappings.
I see data points, but no maps
Kibana uses the Elastic Tile Map service to provide the tiles that make up the actual map. However some organisations may block access to this service with firewalls or proxies and this will break the ability to display your favourite geographic region in the browser. Browser plugins like Privacy Badger have also been know to stop loading of the tiles, so double check these as well - maybe try with an incognito tab.
If you cannot work around security policies you may need to look at setting up your own tile map service, or pointing Kibana to an alternative WMS compatible service, as mentioned in the documentation.
Outro
As we can see, geoip extraction is super valuable across many different use cases. And with just a few steps we've shown two simple methods for getting this information from an event and displaying it with Kibana.
We haven't touched on the ability to use custom maps in detail, but if you want some inspiration or guidance check out either of these two blog posts - Kibana and a Custom Tile Server for NHL Data or Earthquake data with the Elastic Stack.
Ultimately, don't overthink your configuration. Stick with the defaults for field and index names where you can, and if in doubt check the documentation.
If you are still running into problems, or have other questions, then head on over to our community forums for further assistance from our awesome and amazing Logstash Community Maintainers and the rest of the Elastic team!