How to OTel: A blueprint for OpenTelemetry adoption
_(1).png)

 Share on Twitter
Share on Twitter

 Share on LinkedIn
Share on LinkedIn

 Share on Facebook
Share on Facebook

 Share by Email
Share by Email

 Print this page
Print
OpenTelemetry (OTel) has undeniably become the standard for observability. We are witnessing a shift in the industry — a point in time where major powerhouses like AWS and Google are moving away from proprietary agents in favor of OTel standards. However, while the desire to adopt is high, the execution remains a hurdle. Many teams are struggling to move from the why to the how, getting stuck on architecture, migration paths, and identifying the right use cases.
As practitioners who work with teams adopting OTel in real-world environments every day, we see a repeating pattern: Organizations often view OpenTelemetry merely as a tool swap. The reality is that successful adoption requires treating OTel not just as a technology but as a new operating model.
So, we’ve provided a strategic blueprint for OTel adoption. Let’s move beyond the buzzwords to the practicalities of implementation and architecture.
OpenTelemetry’s real value: Context, not just agnosticity
When executives sign off on OpenTelemetry, they usually do so for a few reasons, including vendor agnosticity and efficiency. They want to collect data once and avoid the "vendor lock-in" problem where proprietary agents speak languages that don’t play well with others.
While avoiding lock-in is valuable, it is not the single most important driver for adoption. The true power of OpenTelemetry lies in reducing investigation time by preserving the context layer.
We need to stop thinking about observability in terms of the "three pillars" (logs, metrics, and traces) and start thinking of it as a braid. If you have a system producing CPU metrics and another system producing logs, but they call the hostname two different things, normalization becomes a nightmare. You cannot correlate that data effectively.
This is where OTel’s semantic conventions shine. Naming is hard; OTel solves this by forcing an agreement on what we call things. By leveraging these conventions, in particular, resource attributes, we can identify the specific entities emitting telemetry whether it’s a VM, a Kubernetes pod, or a specific node. This creates out-of-the-box correlation. The goal is to query a single entity and see every signal associated with it without manual translation.
The "Collector First" architecture
A common pitfall is treating OTel adoption as a "big bang" replacement of current monitoring tools. This is a recipe for failure. Instead, we recommend a Collector First strategy.
The OpenTelemetry collector is central to your architecture. It allows you to receive data, process it (by filtering, tagging, and enriching), and export it to multiple backends. By placing collectors in your infrastructure before fully reinstrumenting your applications, you decouple the data generation from the data destination.
The Edge vs. Gateway debate
When architecting your collector deployment, you must distinguish between the Edge and the Gateway.
The Edge collector: Ideally, this sits close to your application (e.g., as a sidecar or daemonset). Crucially, you must keep this lightweight. Do not perform heavy transformations or tail-based sampling here. If the collector on the edge gets overwhelmed, that back pressure reflects onto your application, impacting user experience.
The Gateway collector: This is your centralized processing layer. This is where you scale for ingestion, handle heavy sampling, and manage burstiness.
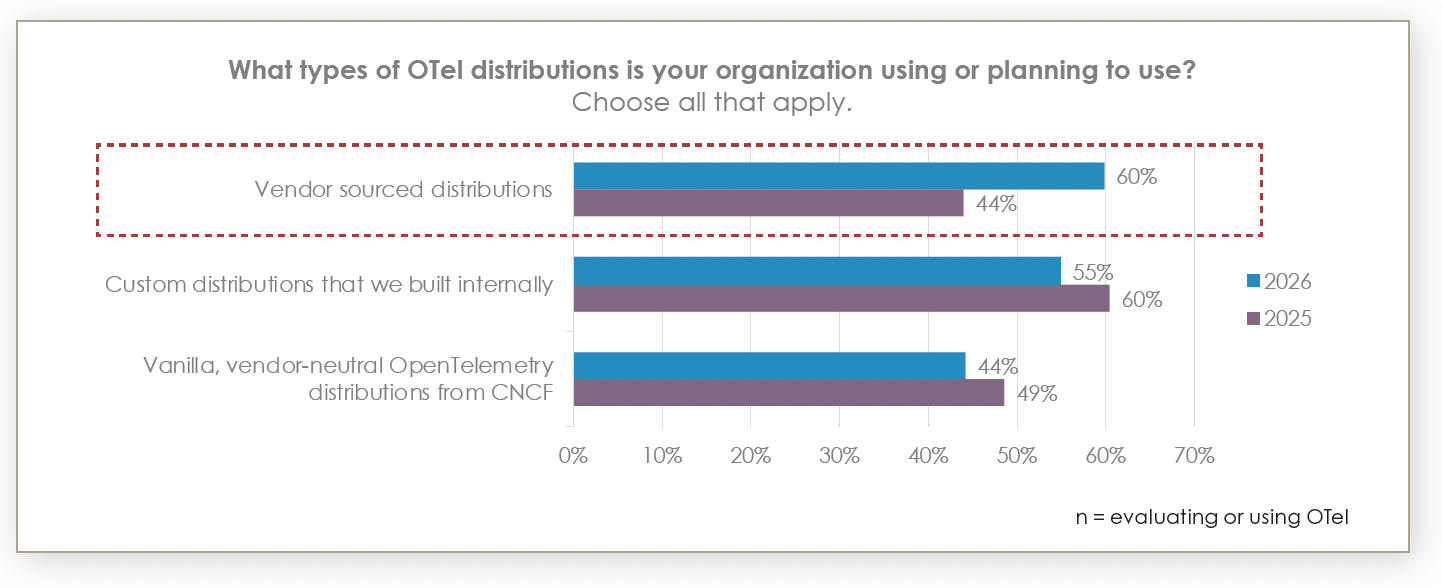
An important consideration is the use of vendor distributions. Many teams prefer to use upstream "vanilla" OTel to ensure neutrality. However, upstream "contrib" repositories contain everything under the sun and aren't necessarily production-hardened. A vendor distribution can offer necessary support, tested builds, and quicker fixes. A recent survey of over 500 observability leaders showed a visible shift away from vanilla OTel and customer builds to vendor-sourced distributions.
The litmus test for vendor neutrality isn't whether you use a distro but whether you are pushing OpenTelemetry Protocol (OTLP) from the edge. As long as your edge talks OTLP, you remain agnostic. If a vendor requires a proprietary exporter at the edge, you are reintroducing lock-in; the gateway, on the other hand, can be swapped with vendor-specific distributions.
The strangler pattern for migration
How do you move a massive IT environment to OTel without disrupting operations? We advocate for the strangler pattern.
Do not rip and replace deeply integrated legacy systems immediately. Instead, slowly migrate systems by picking low-hanging fruit first. Kubernetes is the natural starting point. Because OTel shares DNA with the CNCF ecosystem, it is a native fit for Kubernetes environments.
You can start by deploying the OTel operator and using Helm charts to spin up collectors. Receivers can pull Prometheus metrics from Kubernetes endpoints, normalize them into OTel semantic conventions, and push them down the pipeline. Once the infrastructure layer is reporting correctly, you can move inward toward application logic.
Application instrumentation: The duality of auto and manual
There is a misconception that you must choose between automatic instrumentation (using agents) and manual instrumentation (coding SDKs). The most mature organizations use both.
Auto-instrumentation: This gets you 70%–80% of the way there. By simply adding annotations to your Kubernetes pods, you can inject instrumentation to capture standard HTTP requests, database calls, and response times.
Manual instrumentation: This is where you bridge the gap between "system uptime" and "business health." You should manually instrument your code to capture business-specific attributes, such as Customer IDs.
Imagine a scenario where a transaction is slow. Auto-instrumentation tells you the database query lagged. Manual instrumentation allows you to search your traces for a specific customer ID to see if a VIP client was affected. You can even inject these attributes into your logs, making the entire dataset searchable by business context.
Operationalizing OpenTelemetry
Finally, successful adoption requires an operating model. You need clear ownership of schemas, pipelines, and cost controls. You cannot simply assume that more telemetry equals more insights.
To maintain sanity, validation is key. We recommend using tools like Weaver to maintain schema consistency and Instrumentation Score to validate the quality of your telemetry. These projects help ensure that as your adoption scales, your data remains usable and compliant with the semantic conventions you’ve agreed upon.
The verdict: OpenTelemetry becomes the de facto standard for observability data
We are moving toward a future where OpenTelemetry is the default — both invisible and ubiquitous. It is expanding beyond traces and metrics into CI/CD pipelines and even large language model (LLM) observability.
The industry is shifting. You can choose to reinstrument your applications every time you change vendors, or you can adopt OpenTelemetry to future-proof your observability architecture once and for all. The path forward is not just about installing a collector; it is about adopting a strategy that prioritizes context, consistency, and gradual, managed migration to open source standards for your observability platform.
For more expertise from Elastic on OpenTelemetry, watch our webinar: Getting started with OpenTelemetry: Planning and tips for observability teams.
The release and timing of any features or functionality described in this post remain at Elastic's sole discretion. Any features or functionality not currently available may not be delivered on time or at all.
Share
- Share on Twitter
Share on Twitter
- Share on LinkedIn
Share on LinkedIn
- Share on Facebook
Share on Facebook
- Share by Email
Share by Email
- Print this page
Print