このページのコンテンツは、選択された言語ではご利用いただけません。Elasticでは現在、コンテンツをさまざまな言語でご利用いただけるよう取り組んでいます。お使いの言語が準備されるまでお待ちくださるようお願いいたします。
On-demand webinar
Advanced tips for visualizing and presenting data in Kibana
Hosted by:

Jason Burns
Principal Product Manager
Elastic

Shaun McGough
Principal Product Manager
Elastic
Overview
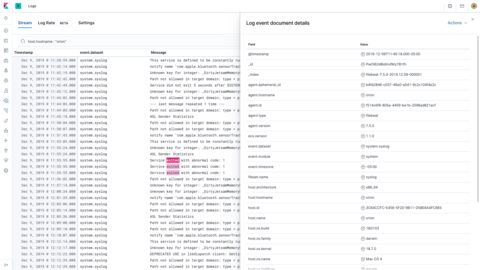
Data analysis is rarely a linear start-to-finish process — no matter how much we wish it was. Good data analysis always prompts additional questions. Supporting the questions-and-answers cycle is something Kibana was built to do. Learn protips for how to use Kibana’s latest capabilities to rapidly move from data questions to beautifully formatted answers in the form of dashboards and interactive reports in Canvas.
View next