On-demand webinar
Kibana Visualizations Deep Dive
Hosted by:

Chris Cowan
Principal Engineer II
Elastic

Thomas Neirynck
Software Engineer
Elastic

Peter Pišljar
Overview
Have you noticed Kibana has been looking mighty fine lately?
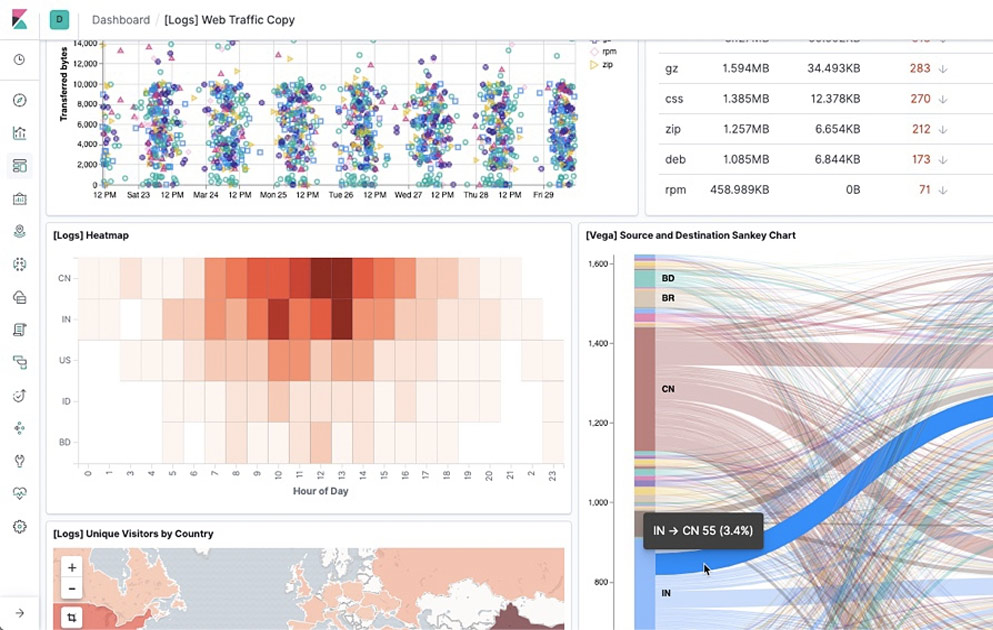
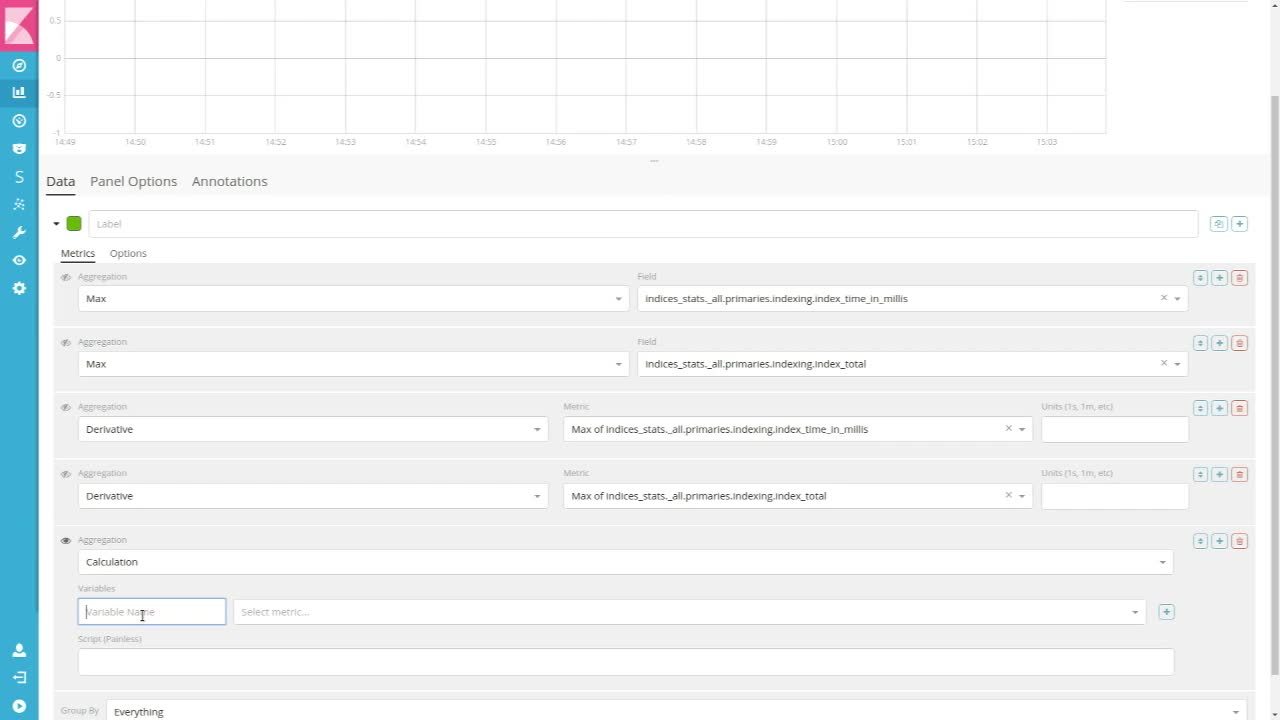
Attend this session to dive deeper into Kibana’s latest visualizations. You’ll get a detailed walkthrough of Tagcloud and Heatmap, new visualizations in Kibana 5.2, as well as insight into where we’re taking visualizations next. From a roadmap perspective, we’ll focus in particular on new geospatial visualizations we are working to bring out in 5.x. As a developer, you’ll also get a behind-the-scenes perspective on the evolving world of visualizations and how it may affect your custom visualization plugins. Finally, we’ll discuss dedicated UIs for time-series visualizations, from Timelion to a new visual builder for pipeline aggregations.
View next
Upcoming webinar
From search to agents: How buyer expectations are reshaping AI platforms in 2026