このページのコンテンツは、選択された言語ではご利用いただけません。Elasticでは現在、コンテンツをさまざまな言語でご利用いただけるよう取り組んでいます。お使いの言語が準備されるまでお待ちくださるようお願いいたします。
Logging
Keep a pulse of all log files flowing in from your servers, virtual machines, and containers in a purpose-built and intuitive interface for viewing logs. Pin structured fields and explore related logs without leaving your current screen. Dive into your real-time streaming logs in Kibana for a console-like experience.
Explore similar demos


Security
Accelerate data onboarding with Elastic AI Import
Elastic’s Automatic Import feature saves analysts from the lengthy process of building custom data parsers, allowing them to instead focus on threat hunting and improve their organization’s security posture. In this demo, see how Elastic AI Import feature can process both supported or unsupported log sources, normalizing and enriching them for analysts.
Security
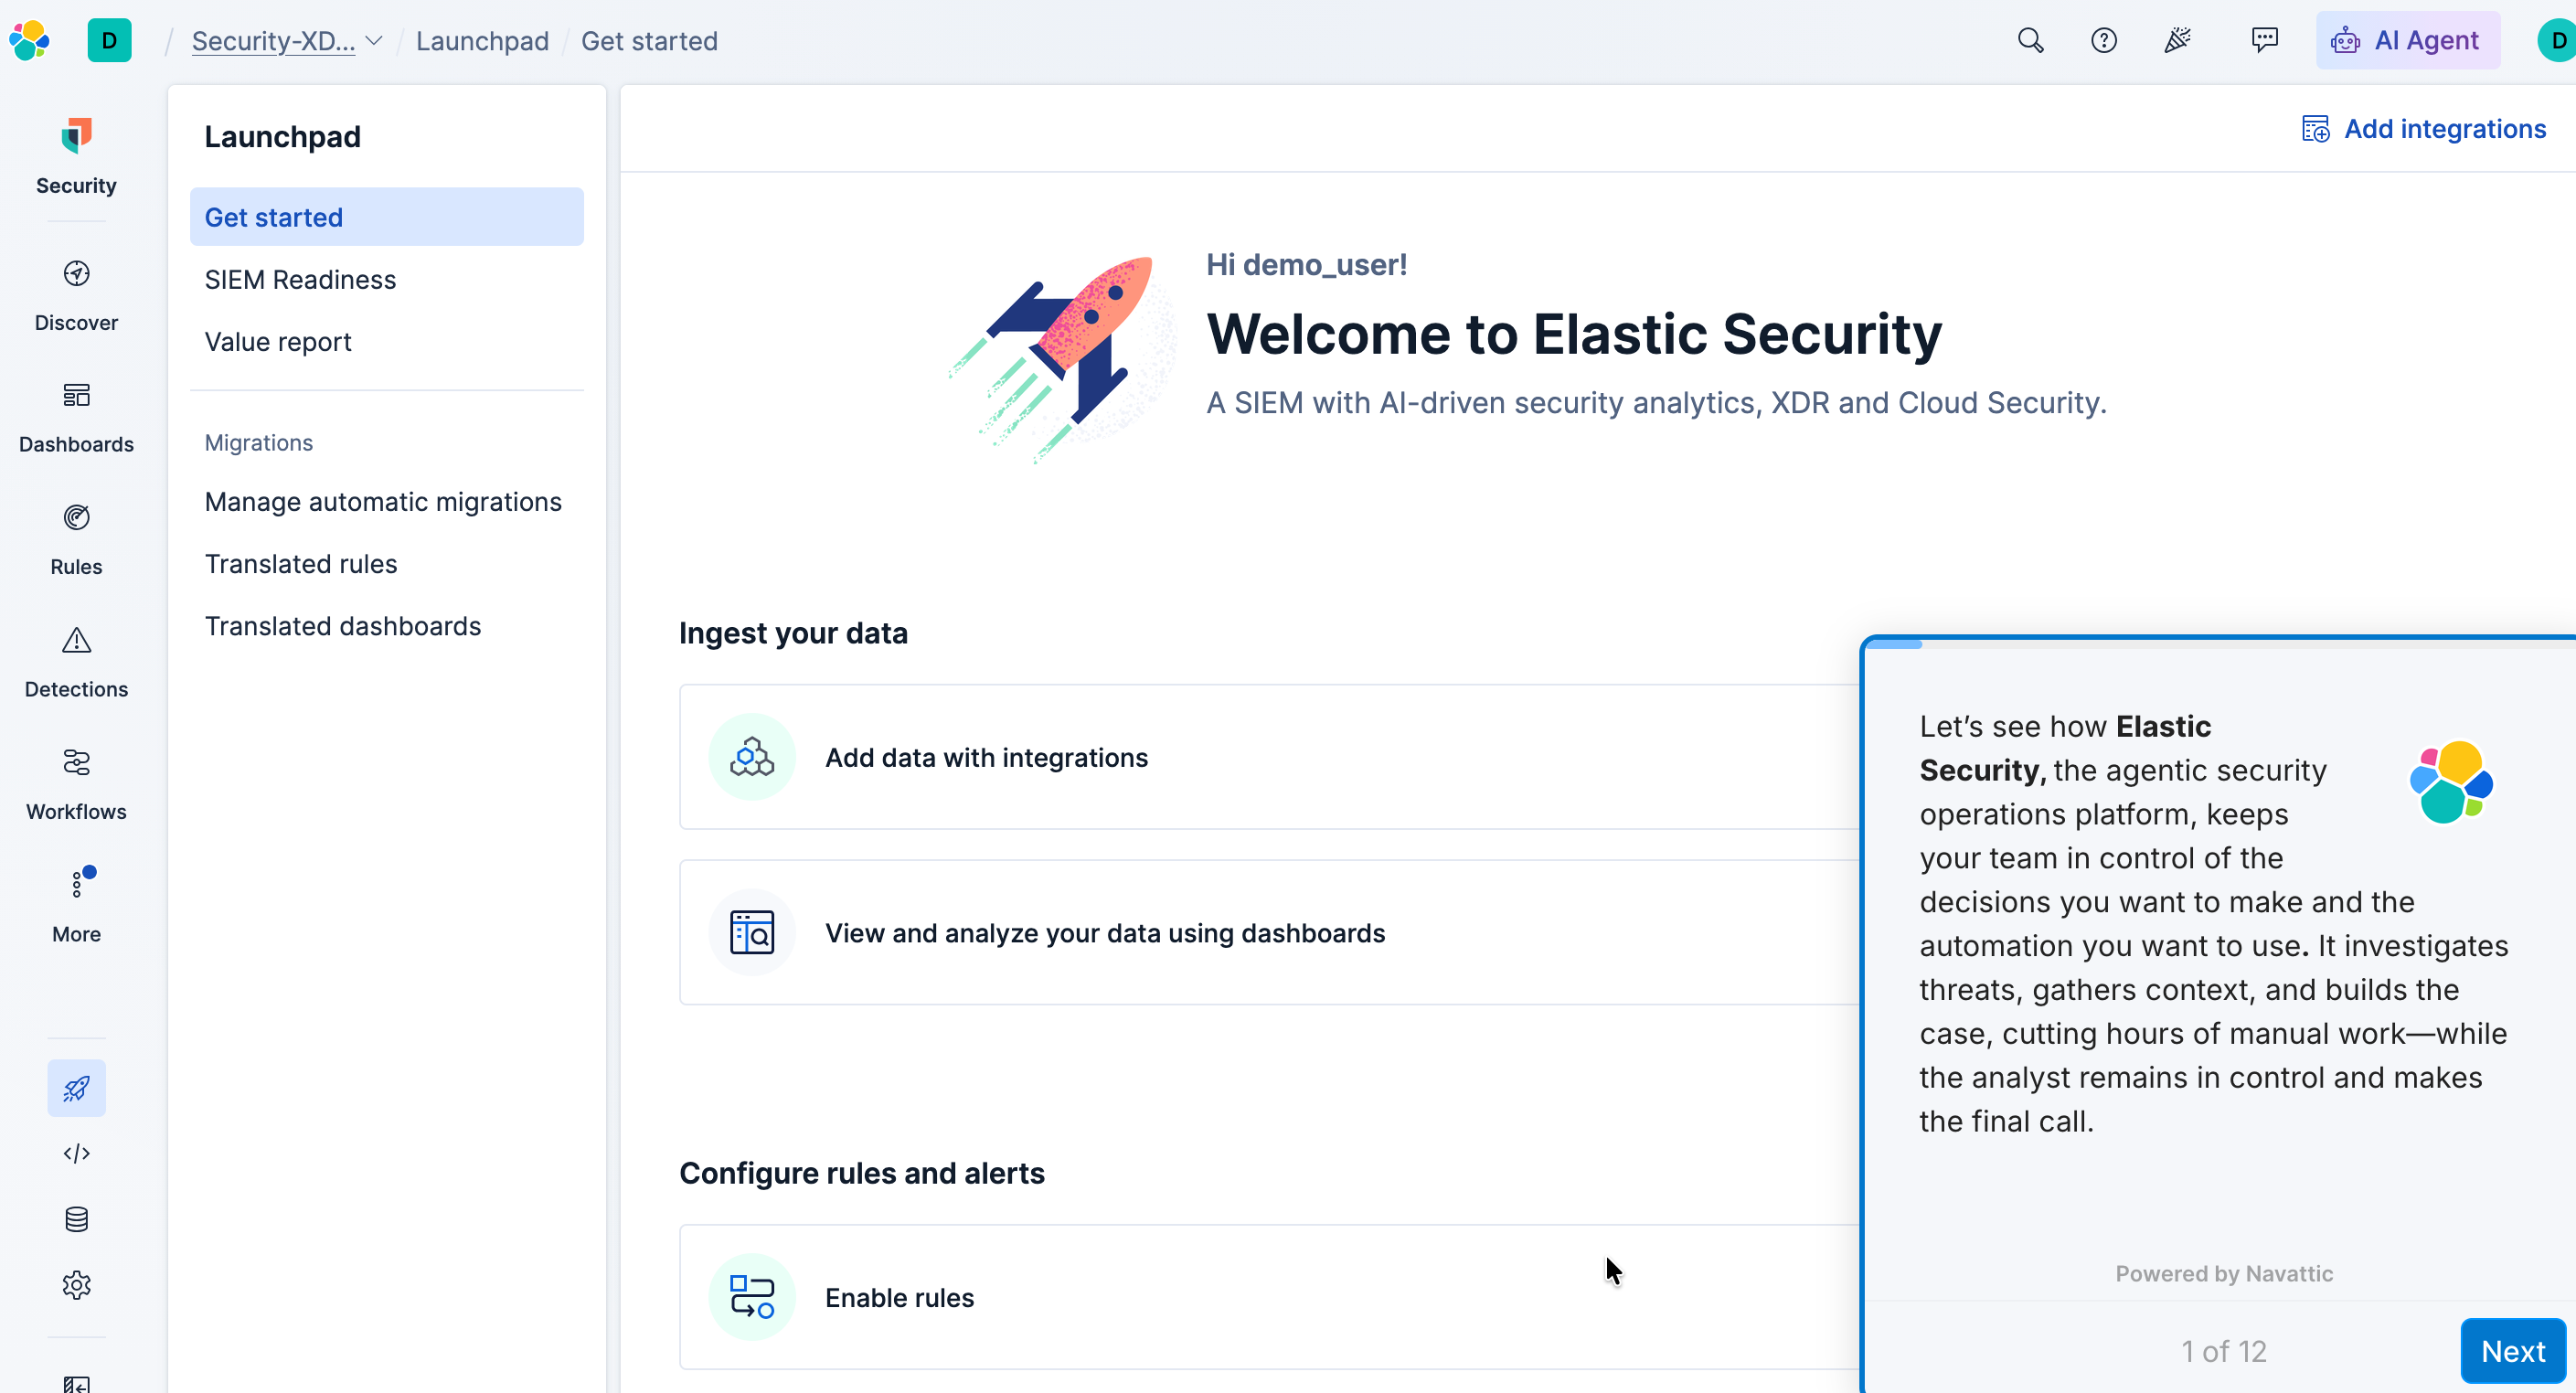
Elastic Security: Agentic Security Operations Platform
Step through Elastic’s agentic SOC live. Watch autonomous agents correlate and investigate a real alert end-to-end, then stage a response through Elastic Workflows—with deterministic playbooks and agentic reasoning working side by side. You stay in control at every gate, approving agent actions and seeing exactly how judgment and verification remain with the analyst while the busywork runs itself.
Security
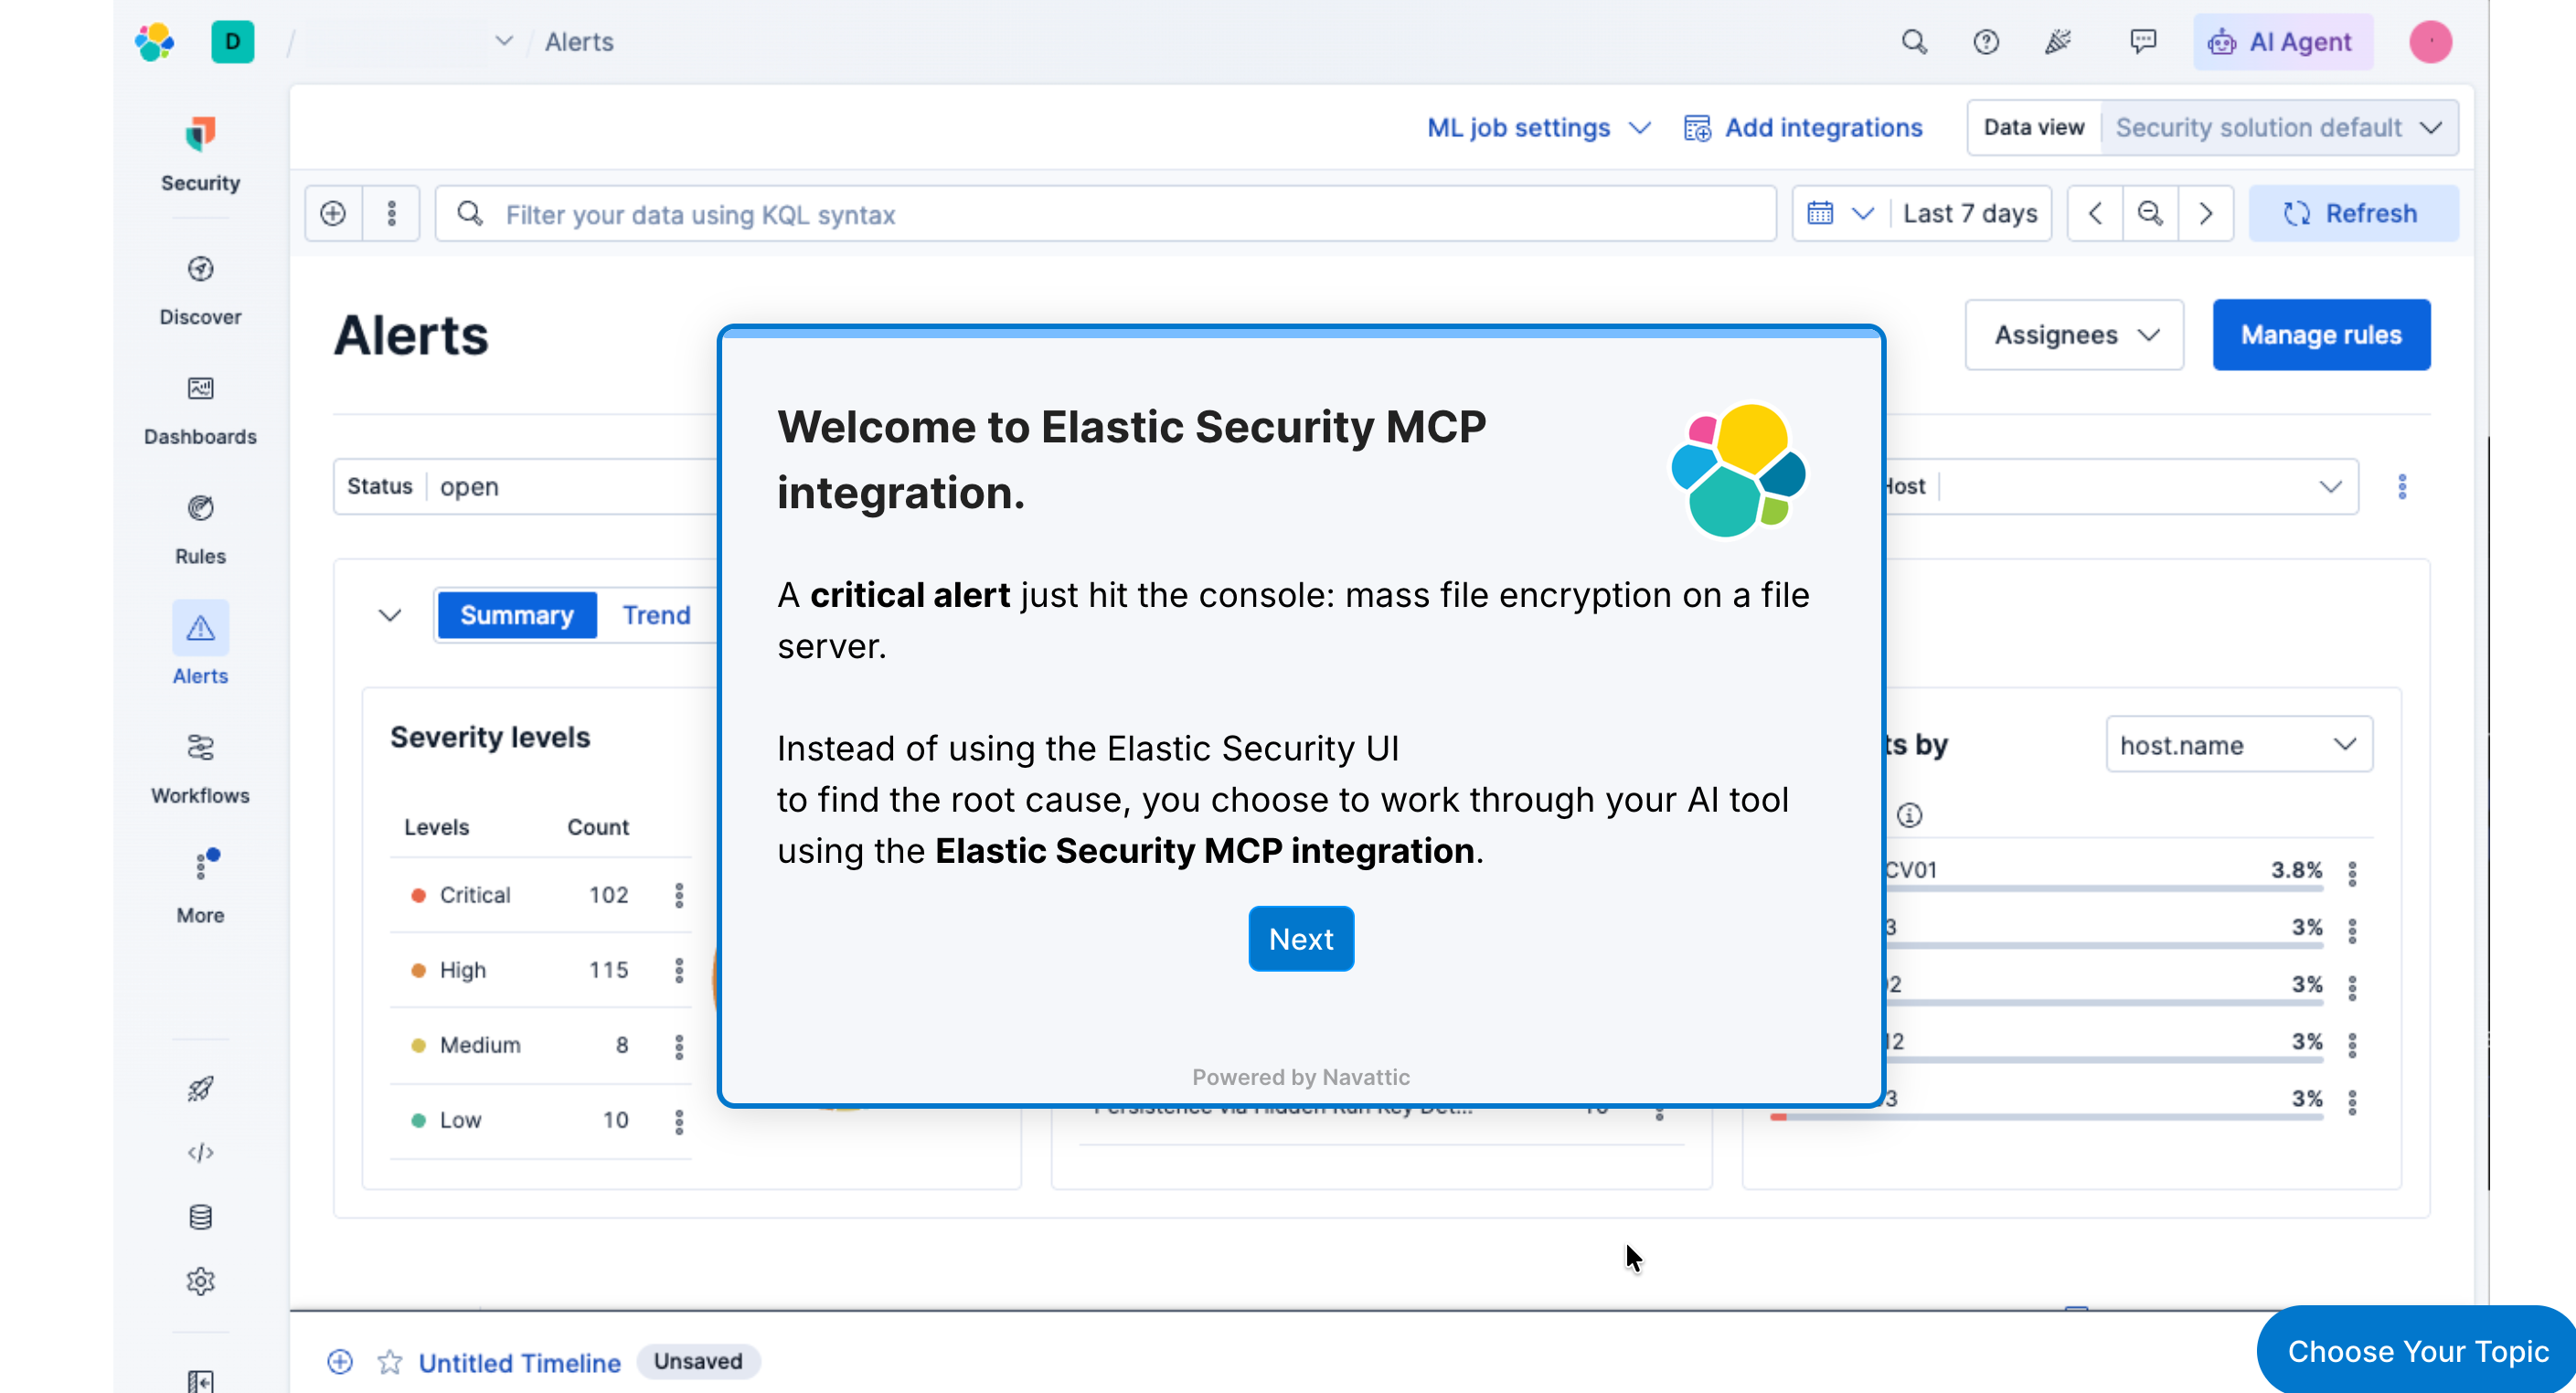
Elastic Security MCP Integration
A critical alert just hit the Elastic Security console: mass file encryption on a file server. Instead of using the web UI to find the root cause, you choose to work through your AI tool using the Elastic Security MCP integration.