Monitoring your infrastructure with OpenTelemetry
Observability 101: Lesson 3 of 4 — In this 15 minute lab, use Elastic Observability to dive into a java issue with high-cpu usage using the data collected from the Elastic Distributions of OpenTelemetry (EDOT). Resolve this issue using the Elastic AI Assistant as well as leverage runbook to prevent recurrence.
Essayez Elasticsearch gratuitement pendant 14 jours pour approfondir et tester ces fonctionnalités.
Voir des démos similaires

Observability
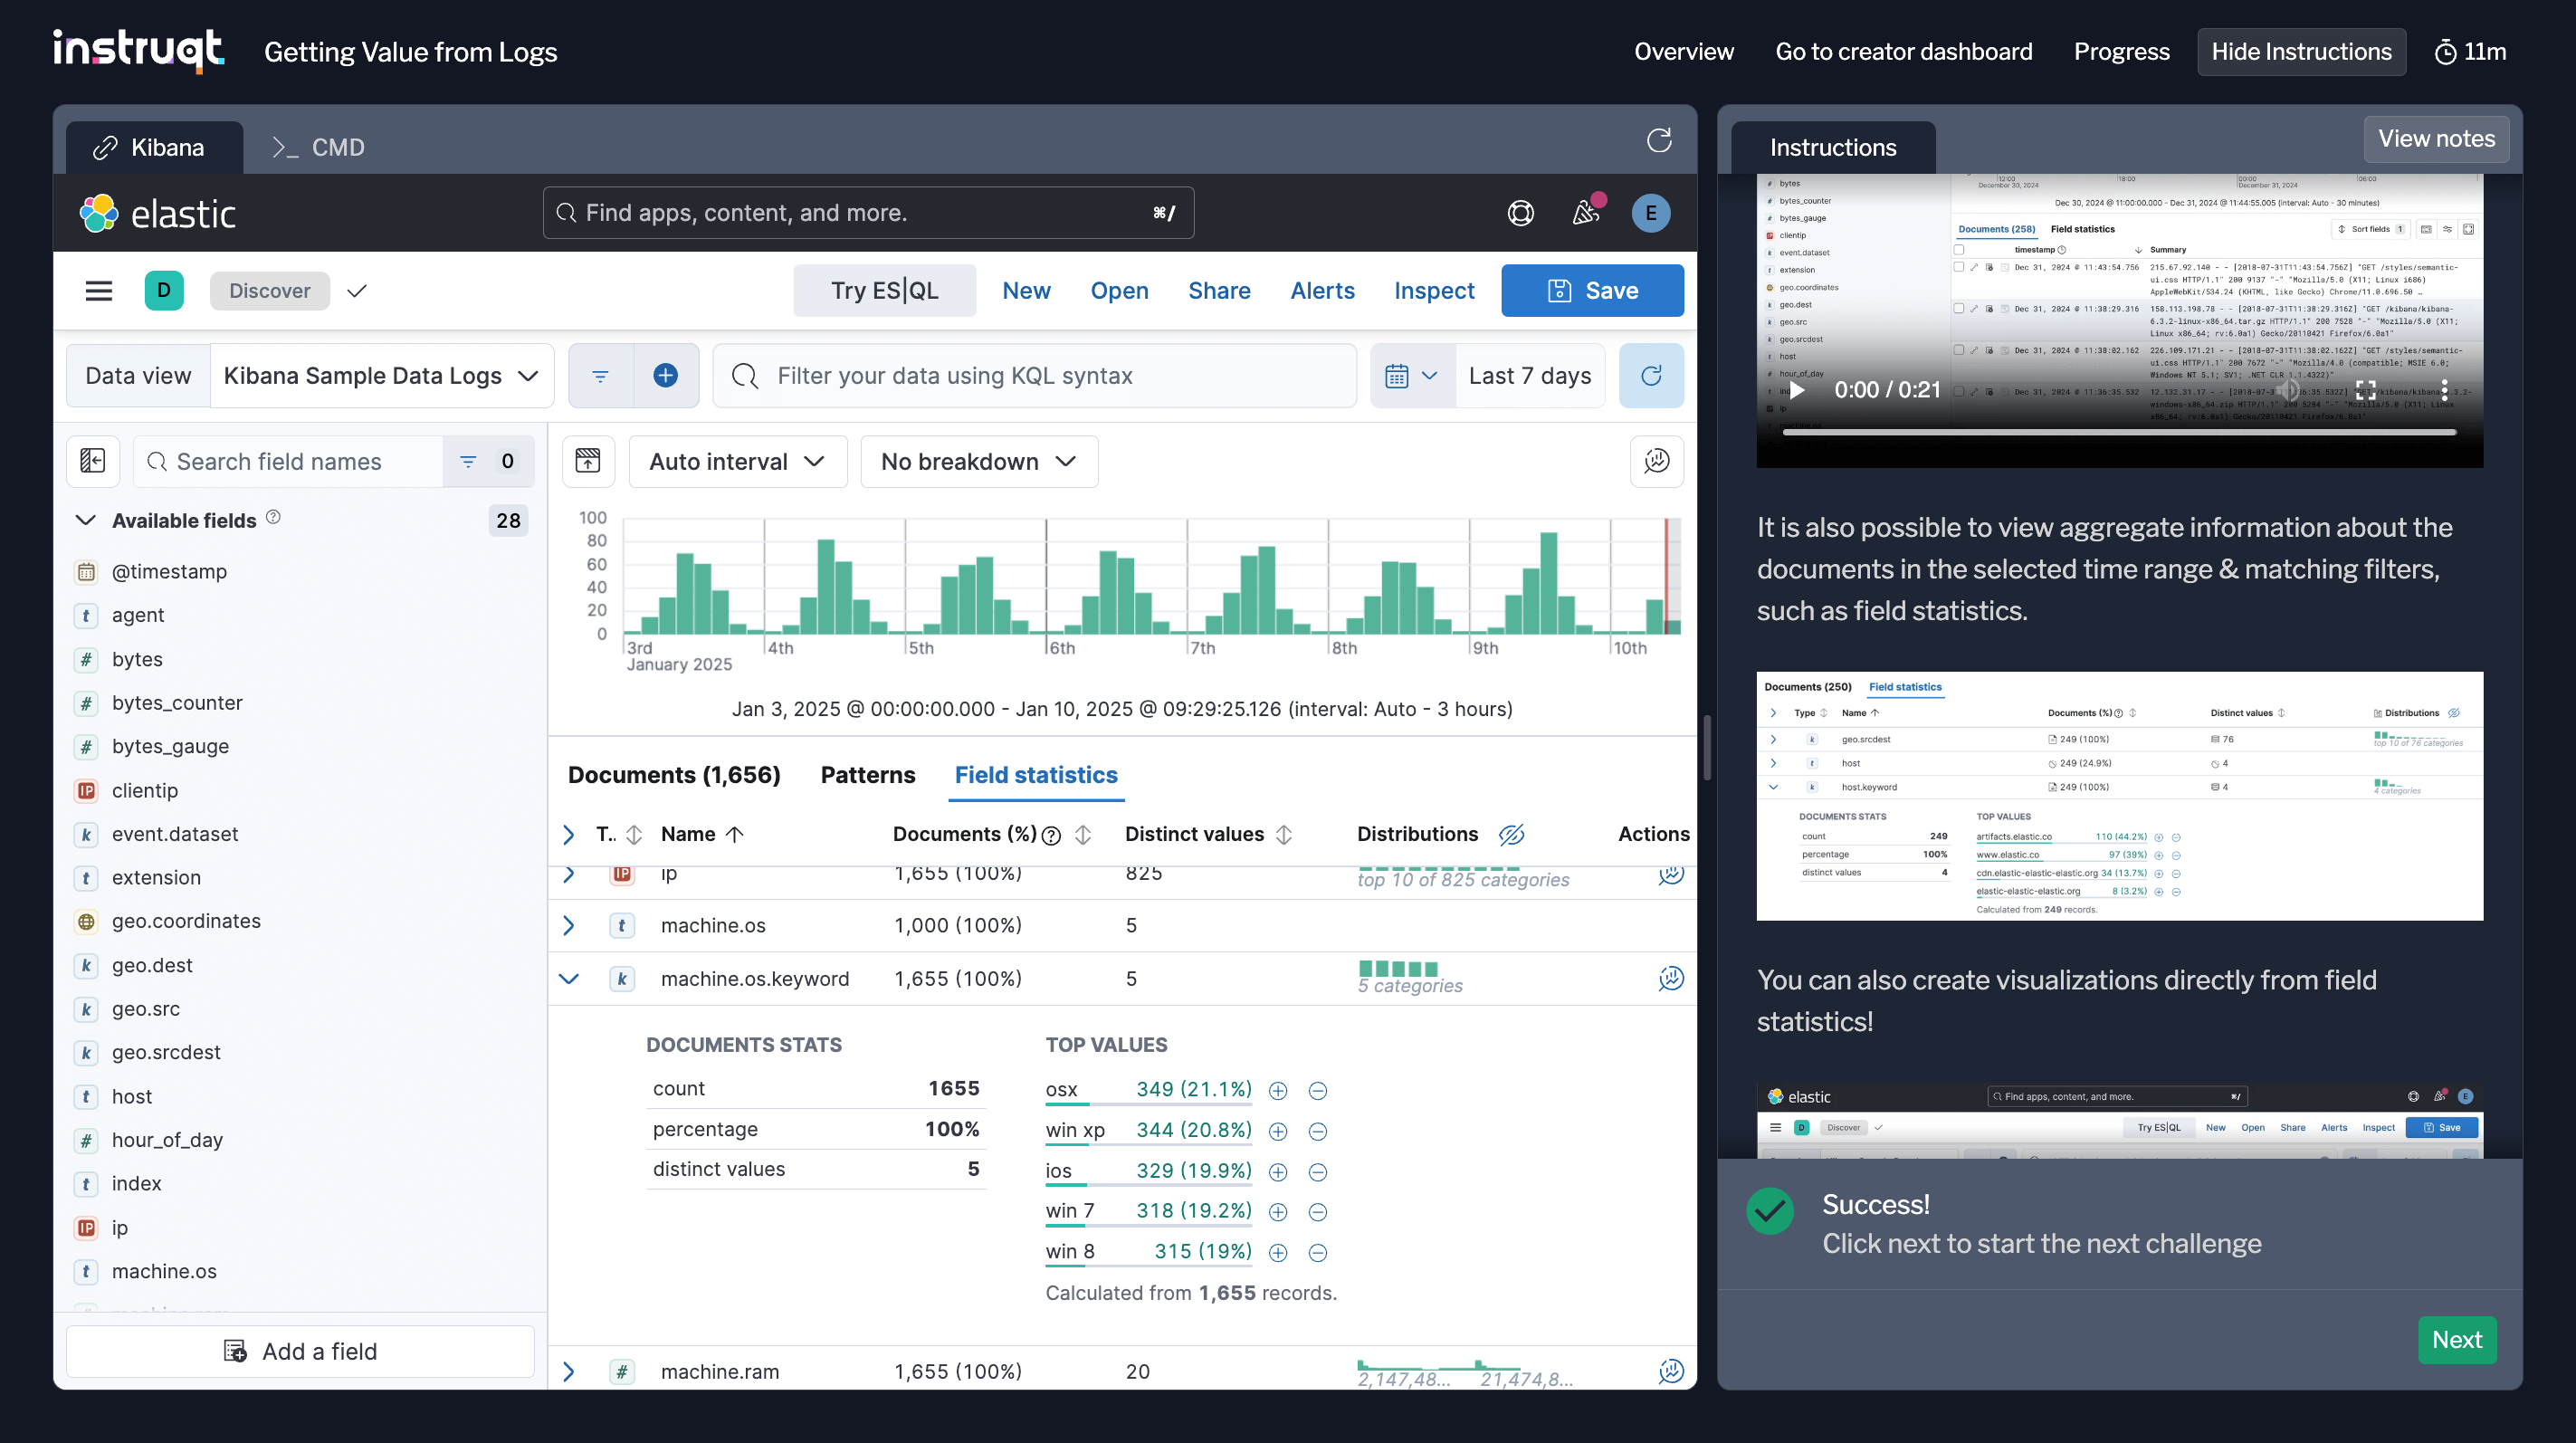
Getting value from logs
Observability 101: Lesson 1 of 4 — Learn the basics of logs and how to derive value by leveraging KQL and ES|QL, creating visualizations and anomaly detection jobs. By the end of this 15 minute Elastic Observability lab, you’ll be able to ask a question about your logs and return an answer.

Observability
Ingestion de logs, de métriques et de traces avec OpenTelemetry
Observability 101 : Leçon 2 sur 4 — Découvrez Elastic Observability en intégrant les logs, les métriques et les traces à l’aide d’Elastic Distribution for OpenTelemetry (EDOT). Dans cet atelier de 15 minutes, utilisez le collecteur OpenTelemetry (otel) pour structurer et définir vos logs.
Observability
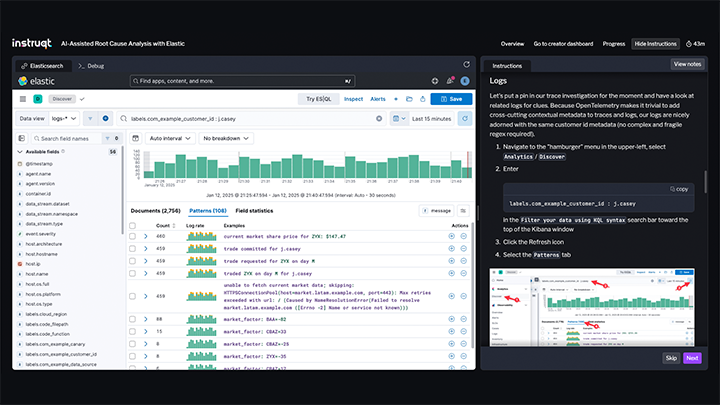
Root cause analysis with AI
Observability 101: Lesson 4 of 4 — Explore this 15 minute lab and use Elastic Observability's machine learning and AI technologies to perform Root Cause Analysis (RCA) of a customer-reported issue. Combine clues from traces and logs at scale with Elastic's AI Assistant to come to a faster resolution.