Monitoring your infrastructure with OpenTelemetry
Observability 101: Lesson 3 of 4 — In this 15 minute lab, use Elastic Observability to dive into a java issue with high-cpu usage using the data collected from the Elastic Distributions of OpenTelemetry (EDOT). Resolve this issue using the Elastic AI Assistant as well as leverage runbook to prevent recurrence.
Experimente o Elasticsearch gratuitamente por 14 dias para explorar e testar essas funcionalidades.
Explore outras demonstrações semelhantes

Observabilidade
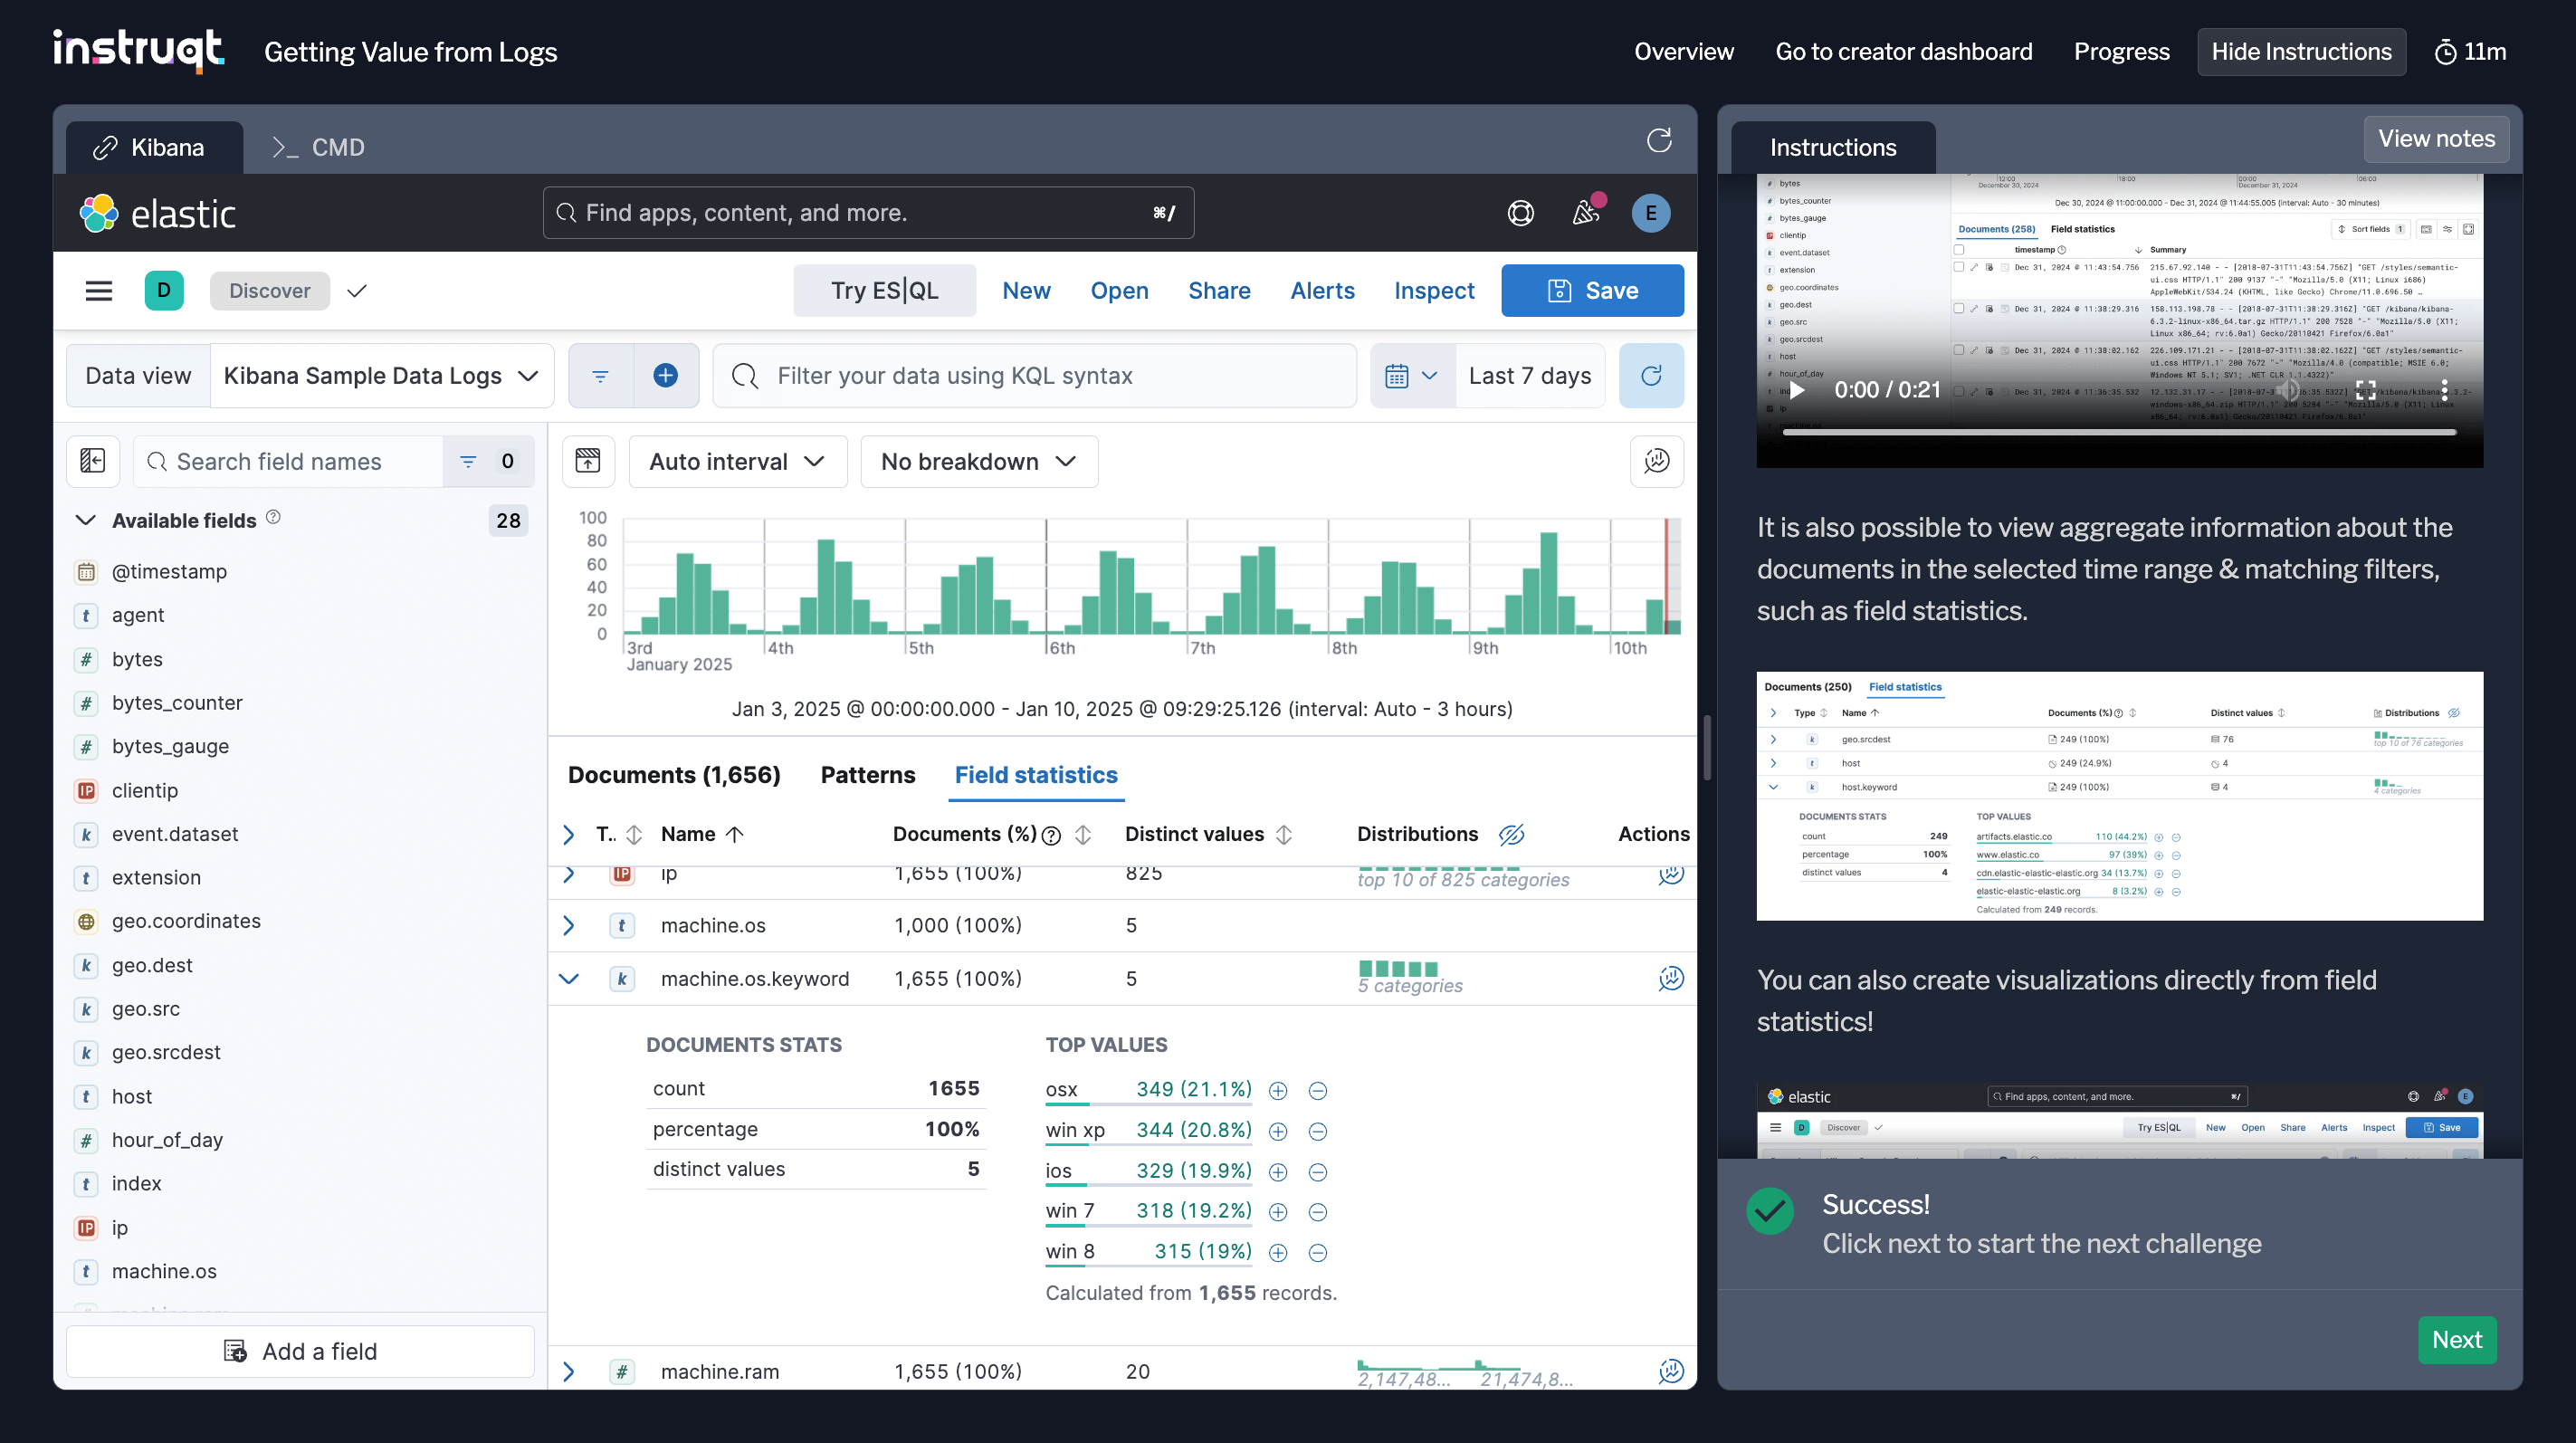
Getting value from logs
Observability 101: Lesson 1 of 4 — Learn the basics of logs and how to derive value by leveraging KQL and ES|QL, creating visualizations and anomaly detection jobs. By the end of this 15 minute Elastic Observability lab, you’ll be able to ask a question about your logs and return an answer.

Observabilidade
Ingerindo logs, métricas e rastreamentos com OpenTelemetry
Observability 101: Lição 2 de 4 — Comece com a Elastic Observability integrando logs, métricas e traços usando a Elastic Distribution for OpenTelemetry (EDOT). Neste laboratório de 15 minutos, use o coletor OpenTelemetry (OTel) para fornecer estrutura e definição aos logs.
Observabilidade
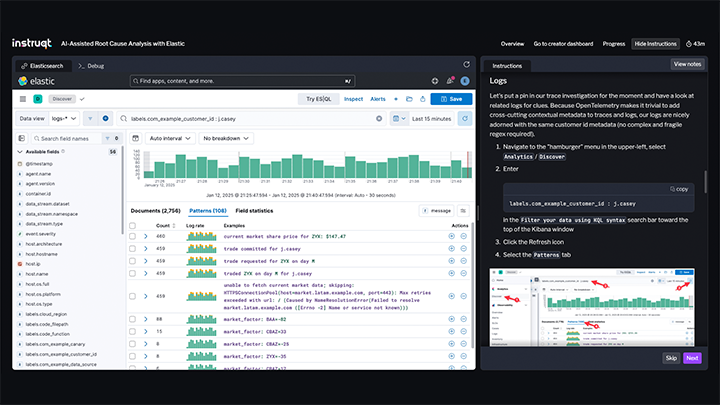
Root cause analysis with AI
Observability 101: Lesson 4 of 4 — Explore this 15 minute lab and use Elastic Observability's machine learning and AI technologies to perform Root Cause Analysis (RCA) of a customer-reported issue. Combine clues from traces and logs at scale with Elastic's AI Assistant to come to a faster resolution.