OpenTelemetry를 사용해 로그, 메트릭 및 추적 정보 수집
통합 가시성 101: 4강 중 2강 — Elastic Distribution for OpenTelemetry (EDOT)를 사용해 로그, 메트릭 및 추적을 온보딩하고 Elastic 통합 가시성을 시작하세요. 이 15분 실습에서는 opentelemetry(otel) 수집기를 사용하여 로그에 구조와 정의를 제공합니다.
14일 동안 Elasticsearch를 무료로 사용하면서 이러한 기능을 자세히 테스트해 보세요.
유사한 데모 살펴보기

통합 가시성
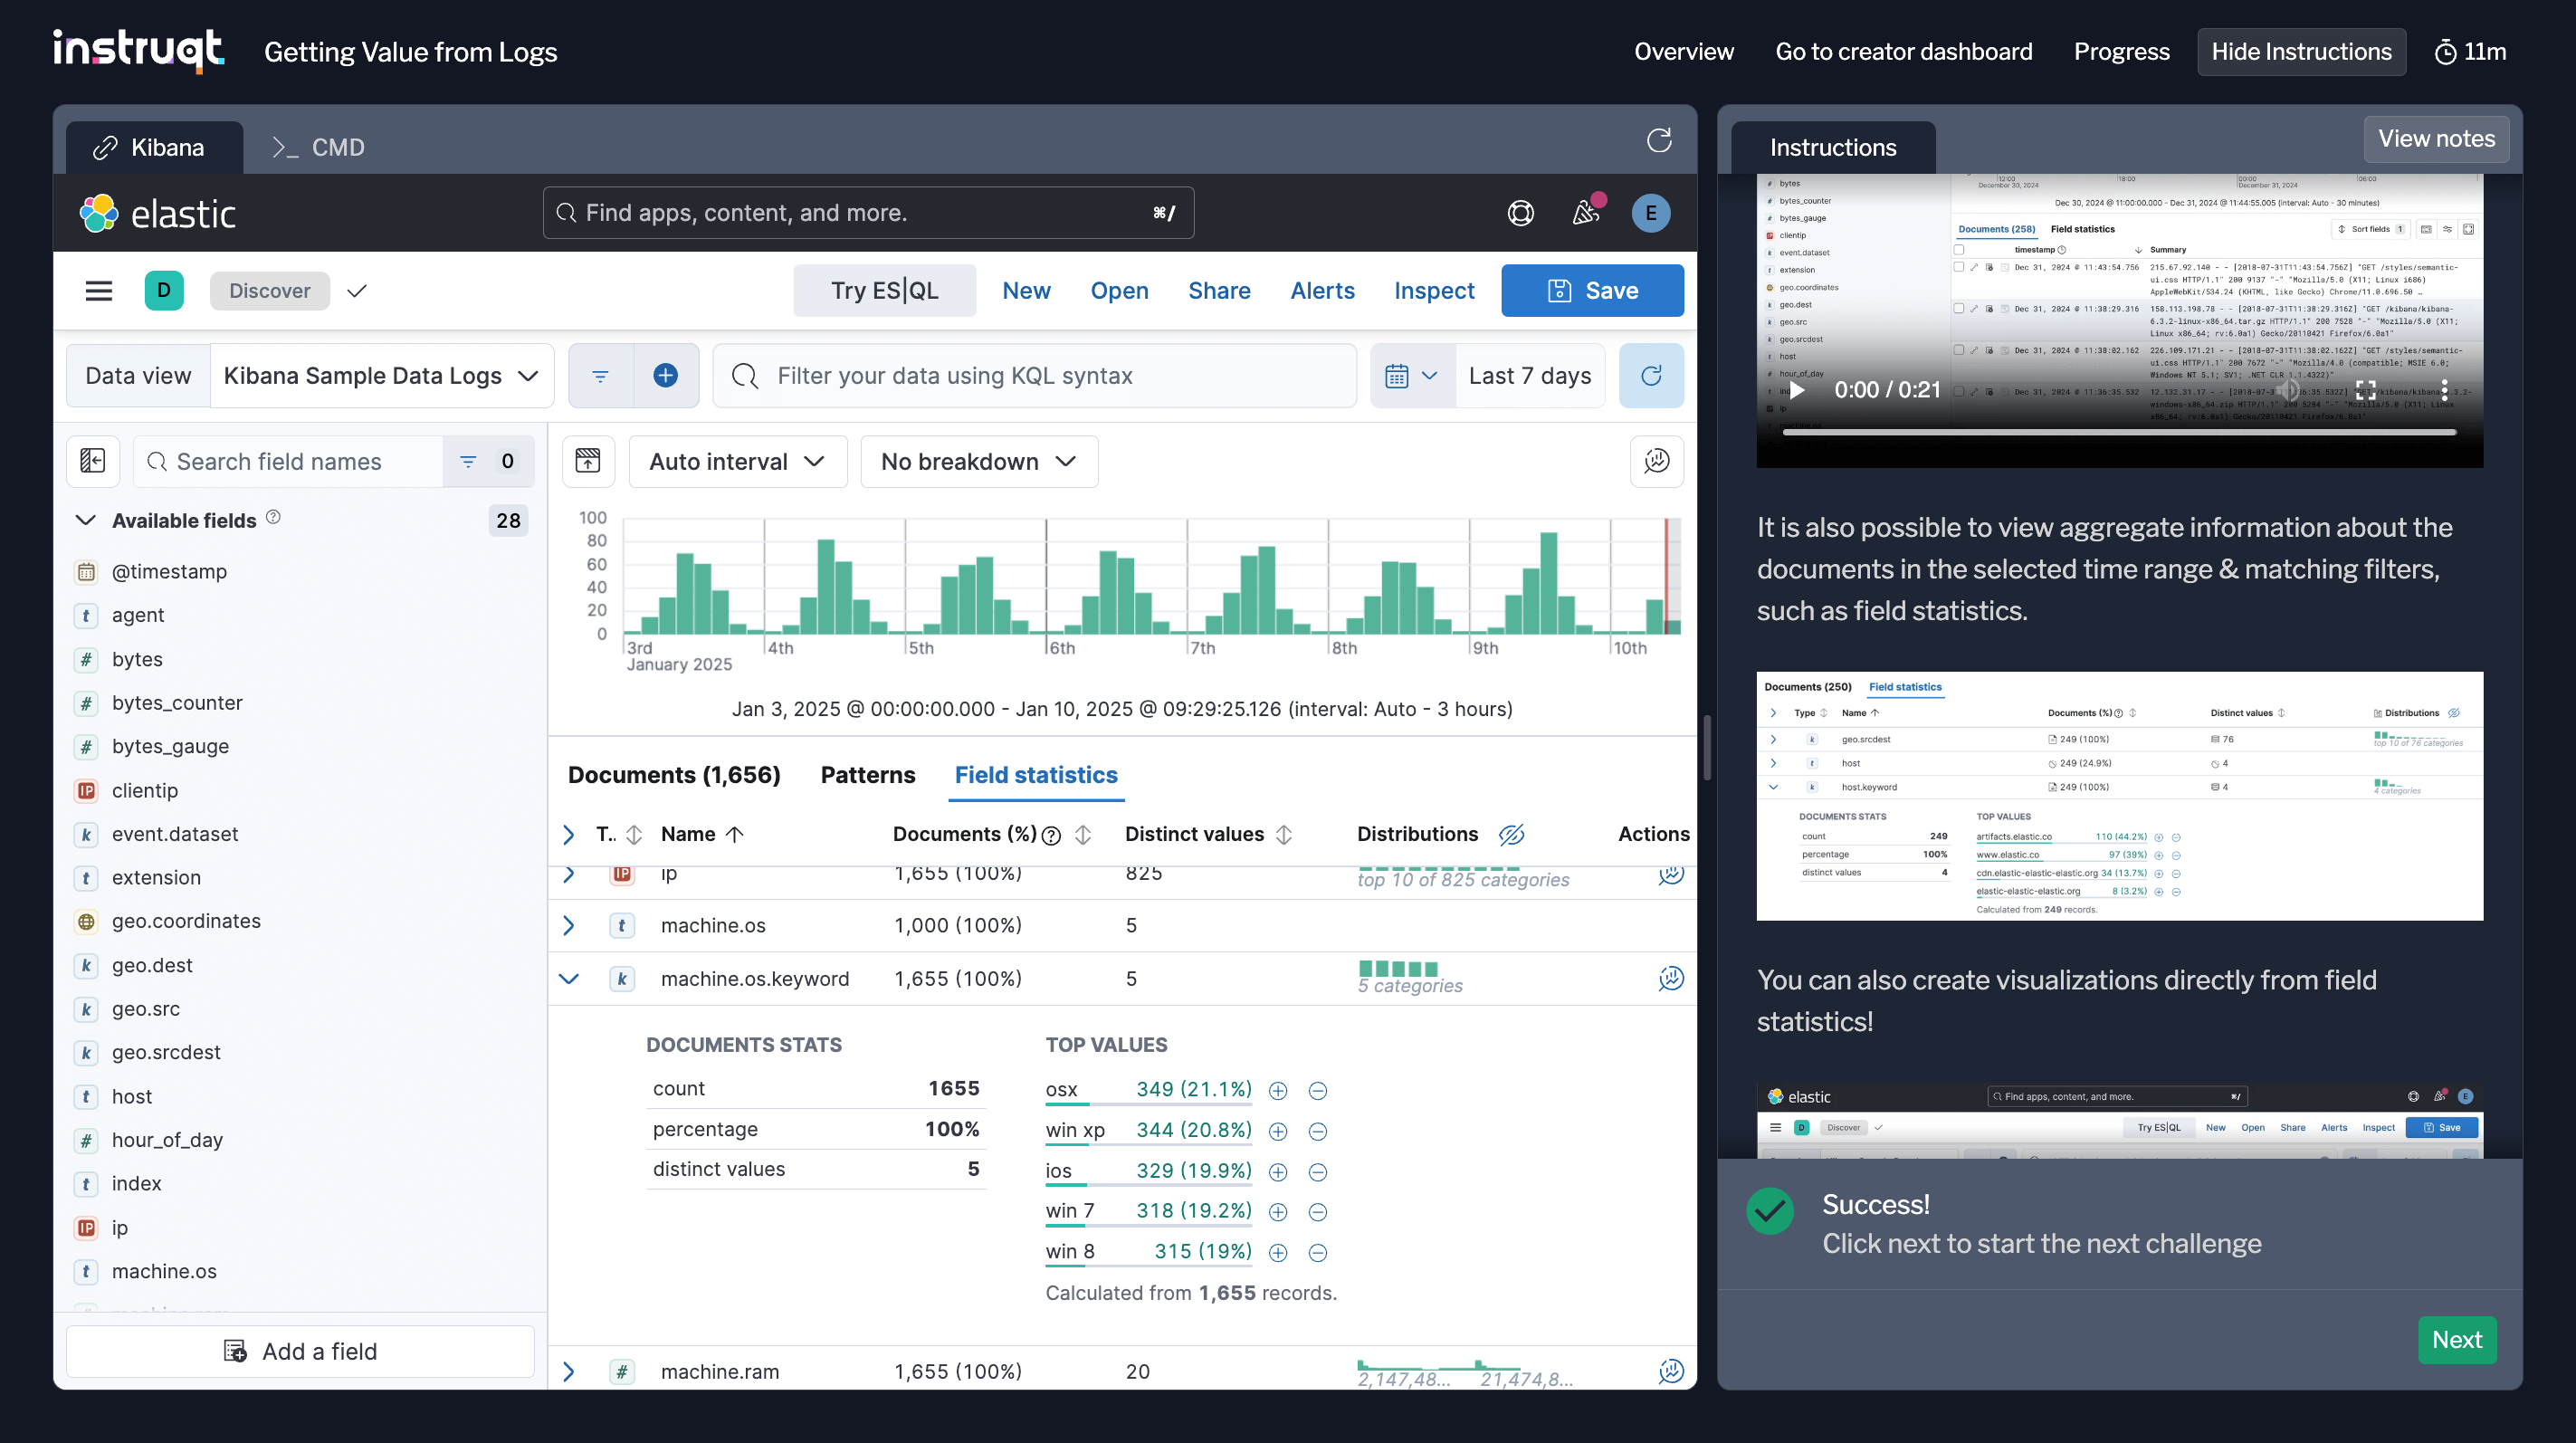
Getting value from logs
Observability 101: Lesson 1 of 4 — Learn the basics of logs and how to derive value by leveraging KQL and ES|QL, creating visualizations and anomaly detection jobs. By the end of this 15 minute Elastic Observability lab, you’ll be able to ask a question about your logs and return an answer.
통합 가시성
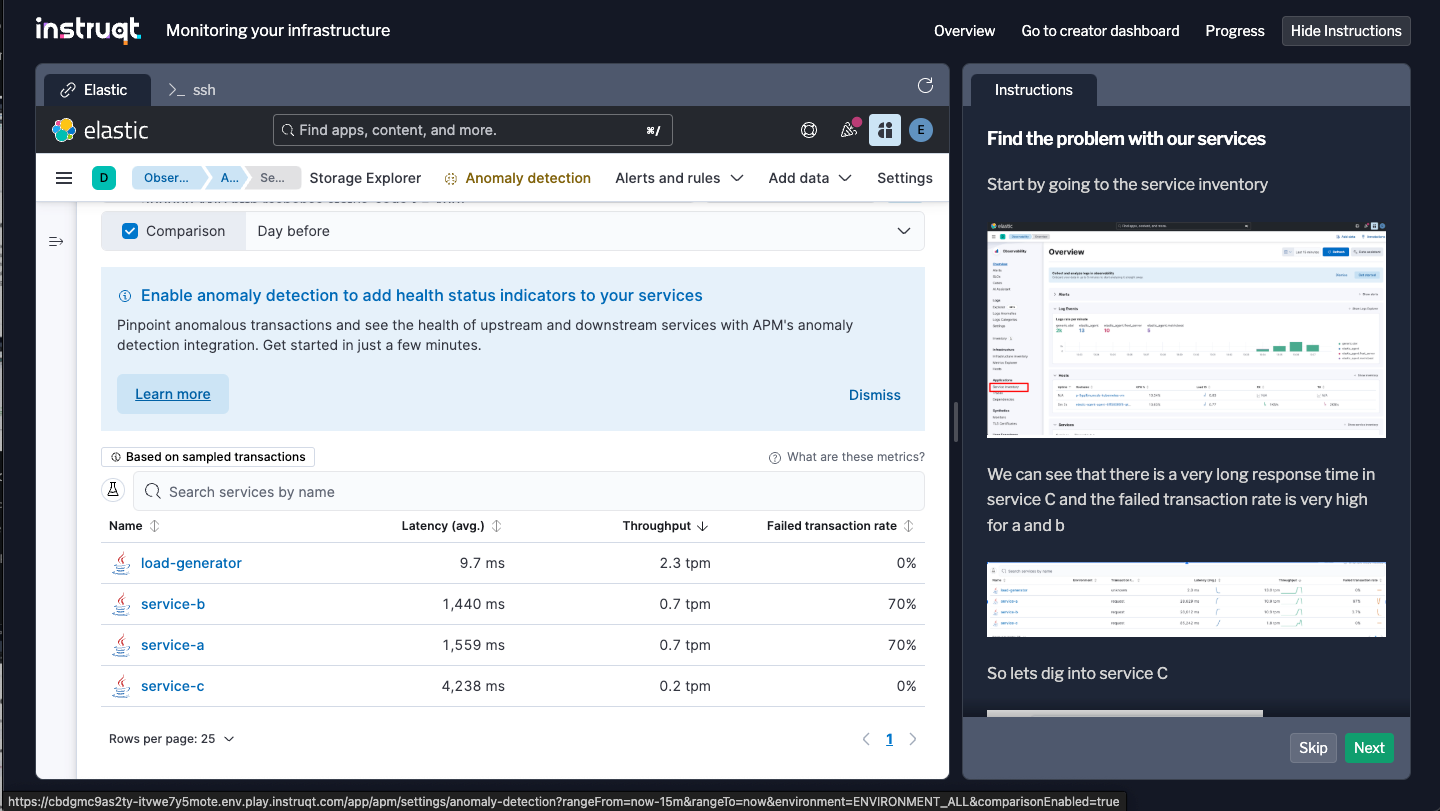
Monitoring your infrastructure with OpenTelemetry
Observability 101: Lesson 3 of 4 — In this 15 minute lab, use Elastic Observability to dive into a java issue with high-cpu usage using the data collected from the Elastic Distributions of OpenTelemetry (EDOT). Resolve this issue using the Elastic AI Assistant as well as leverage runbook to prevent recurrence.
통합 가시성
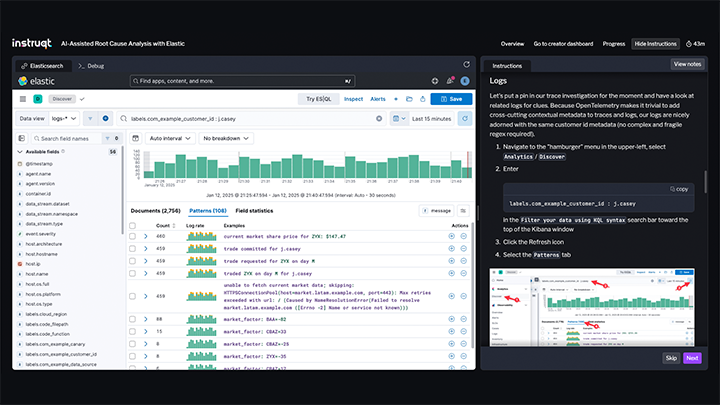
Root cause analysis with AI
Observability 101: Lesson 4 of 4 — Explore this 15 minute lab and use Elastic Observability's machine learning and AI technologies to perform Root Cause Analysis (RCA) of a customer-reported issue. Combine clues from traces and logs at scale with Elastic's AI Assistant to come to a faster resolution.