Monitoring an application running in Docker containers and Kubernetes with the Elastic Stack
You run your apps in containers for rolling updates, efficiency, resiliency, consistency, etc. Your monitoring system should have the same characteristics and even more goodness. Visit the home for container monitoring at Elastic to stay in the know. If you are familiar with containerization and orchestration, skip down to the So what’s different? section, where we will talk about the specifics of monitoring a containerized app.
Docker Containers
A Docker container image is a lightweight, stand-alone, executable package of a piece of software that includes everything needed to run it: code, runtime, system tools, system libraries, settings. Containers isolate software from its surroundings, for example differences between development and staging environments and help reduce conflicts between teams running different software on the same infrastructure.
SOURCE: www.docker.com/what-container
Kubernetes or k8s
Kubernetes is an open-source system for automating deployment, scaling, and management of containerized applications. It groups containers that make up an application into logical units for easy management and discovery. Kubernetes builds upon 15 years of experience of running production workloads at Google, combined with best-of-breed ideas and practices from the community.
K8s is a numeronym (that is a mouthful).
So what’s different?
What the above definitions do not say is that getting logs and metrics out of a container and monitoring the deployment and scaling of them is a little different; not harder, just different. The monitoring system must be designed to be dynamic; as deployments scale, the monitoring system must automatically detect the changes and adapt to them. The burden to maintain the monitoring system cannot be placed on an admin user. Let’s scratch the surface in this post and then dig in deeper in future blogs, where we will detail the specifics for each Elastic module. The video at the bottom shows a realistic example.
Monitoring
Monitoring is an overloaded term. For this discussion, monitoring is collecting, parsing, storing, visualizing, and acting on the logs and metric data from an application or service and the environment which it depends on. If you are running Apache and Redis in Kubernetes and Docker, then (using our definition of monitoring) you need to collect:
- Apache metrics and logs
- Redis metrics and logs
- Kubernetes metrics and logs
- Docker metrics and logs
- Network metrics
- Response times
Then create some visualizations for the service:
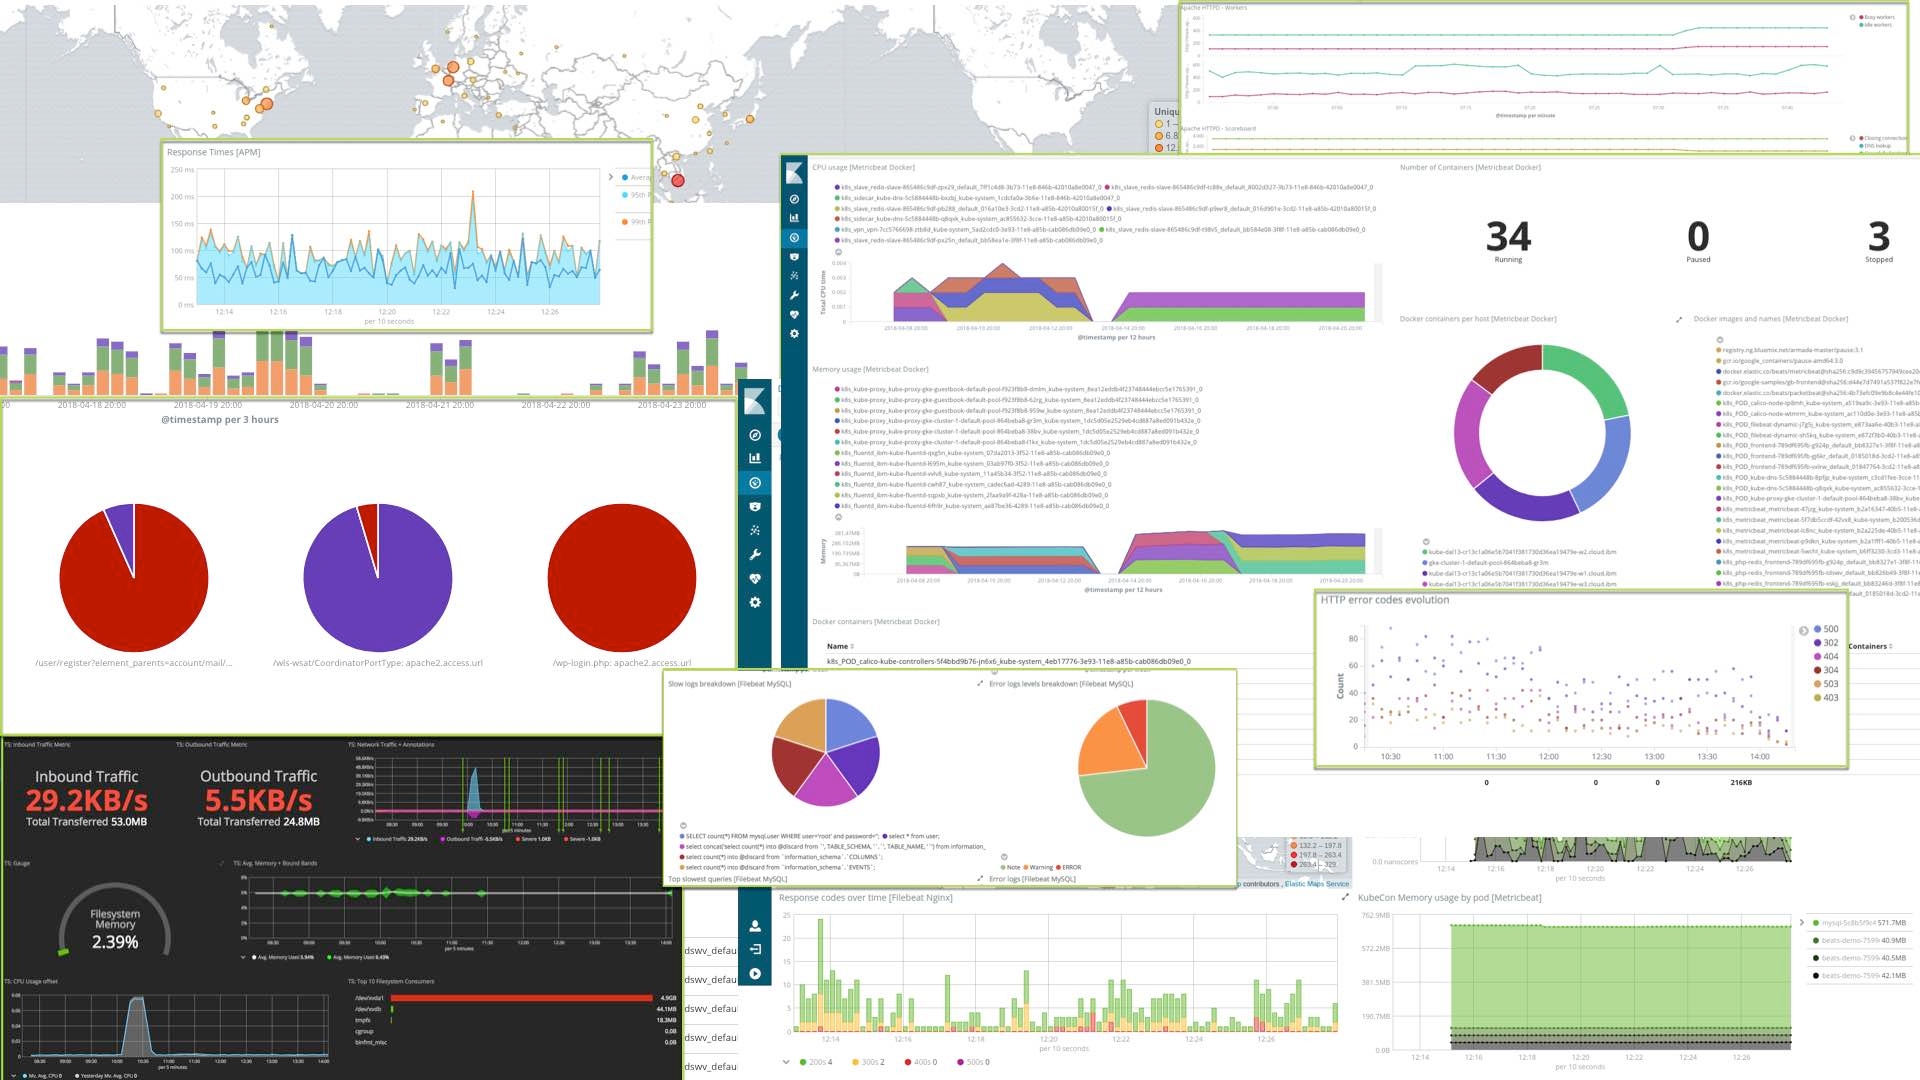
And finally create some automated alerts, maybe with PagerDuty or Slack for when things go bad:

Simple things should be simple
The Elastic Stack (Elasticsearch, Kibana, Beats, and Logstash) provides the ability to do all of the above quickly and easily. Elastic modules include the collection, parsing, index templates, visualizations, etc. for common log formats. You don’t even have to know where the log files are if they are in the default spot for your operating system. In this video we will look at how Elastic is taking advantage of the rich metadata available in a container environment to make managing your app and Docker / Kubernetes easier. All of the files and the README that you will see used in the video are in GitHub. The Kubernetes tutorial (which is wonderful) is in the Kubernetes Docs. In this example we are deploying an app in IBM Cloud Container Service and then using the Elastic Beats and Hosted Elasticsearch Service to autodiscover, collect, parse, index, search, and visualize the information about our app. Here are the topics covered in the video:
- Why monitoring container apps is different
- How a rolling update progresses
- Out-of-the-box Elastic module dashboards
- How Docker metadata drives Beats autodiscover
- Deploying the Kubernetes example PHP Guestbook
- Deploying Beats (the log and metrics shippers that discover, parse, enrich, and send the data to Elasticsearch)
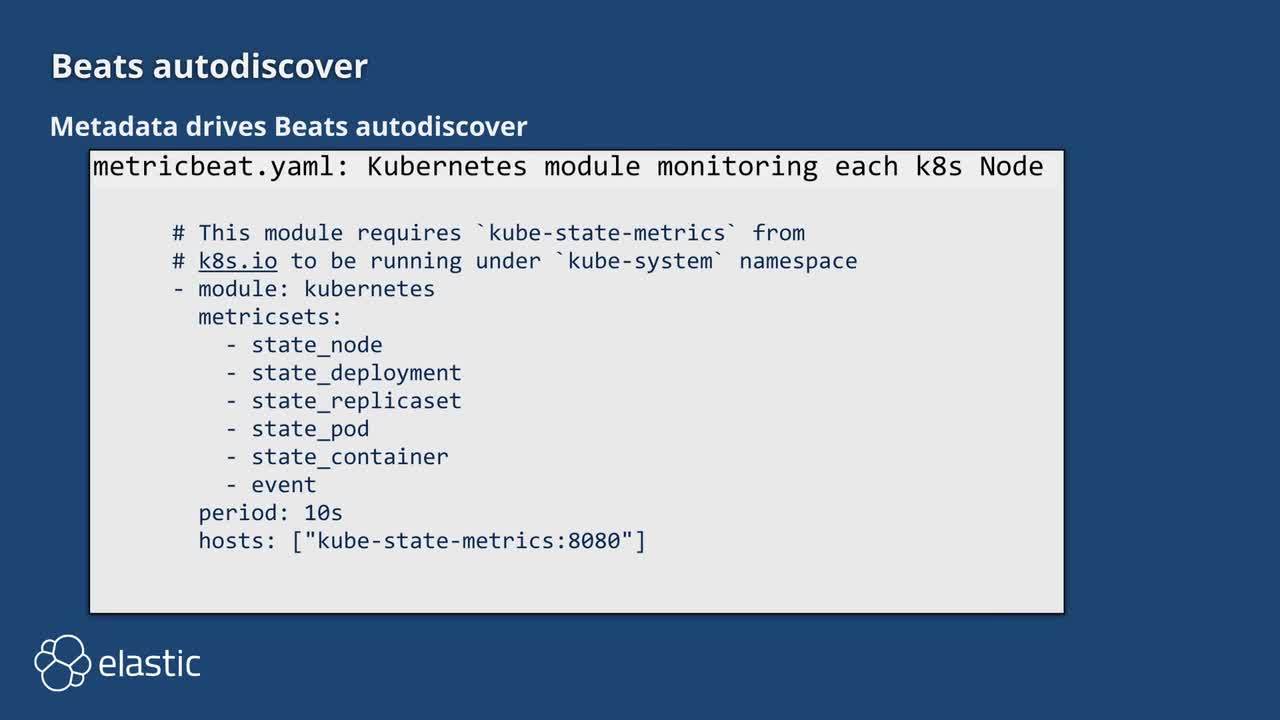
Future blogs will go into the details of the deployment, what each Elastic module provides to get to the goal, and how to expand beyond the out of the box experience (like sending alerts to Slack). If during the video you were wondering how we configured the Beats to pickup specific logs from specific Docker containers then make sure to read up on autodiscover, it is a real timesaver.