Editor's Note (August 3, 2021): This post uses deprecated features. Please reference the map custom regions with reverse geocoding documentation for current instructions.
| This article contains updated instructions for working with the current Elastic Stack. A previous version covered a sample dataset for earlier versions. |
Getting a hosted Elasticsearch environment up and running has never been easier. With Elastic Cloud you can launch your cluster and start ingesting data in minutes. See how in this 3-minute video. This step-by-step set of instructions will walk you through setting up an Elastic Cloud account, creating and securing a Elasticsearch cluster, importing data, and visualizing it in Kibana. Let's get started!
Log into Elastic Cloud
- Go to https://www.elastic.co/cloud/as-a-service and sign up for a free trial
- You will receive a confirmation email. Open it and follow the instructions to start your trial
- Log into your Elastic Cloud account
Create your first hosted Elasticsearch cluster
- Once you have signed in you will see an overview of your deployments. Click on the "Create Deployment" button
- For trials the deployment size is fixed with 4GB memory and 96GB of storage, and two "Availability Zones" (data centers) for higher availability
- Name your deployment, choose the provider and region that you prefer. I am selecting GCP, in the US Central Region
- Add in any plugins you would like, I am sticking with the defaults
- Click on Create to provision your deployment. Provisioning will start and you will receive a notification once it's complete
- Save the password that pops up for the elastic user, we will need it later
Editor’s Note (September 3, 2019): Microsoft Azure is now available as a cloud provider for Elasticsearch Service on Elastic Cloud. For more information, please read the announcement blog.
Using Kibana
Kibana is enabled by default. We'll use the password for the elastic user which we saved earlier. While viewing the deployment details screen, click on the Kibana endpoint:
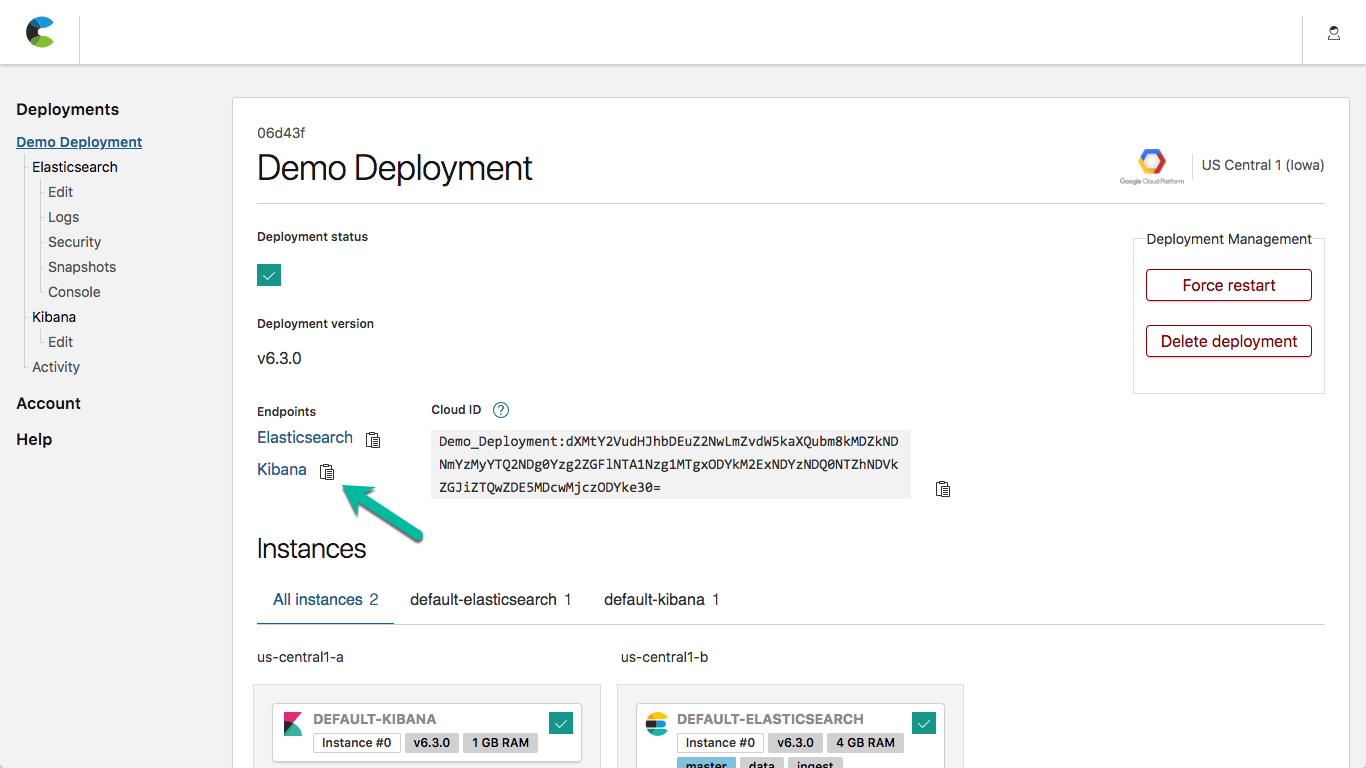
and log in with the elastic user and the generated password we saved from deployment (if you didn't save the password you can reset it from the security tab on the Elastic Cloud deployment overview tab).
Secure your Cluster
Next, let's configure cluster access and security using the X-Pack security module, included with all Elastic Cloud accounts:
- Make sure that you have logged into the Kibana interface with the username elastic & the password you copied from the initial provisioning step
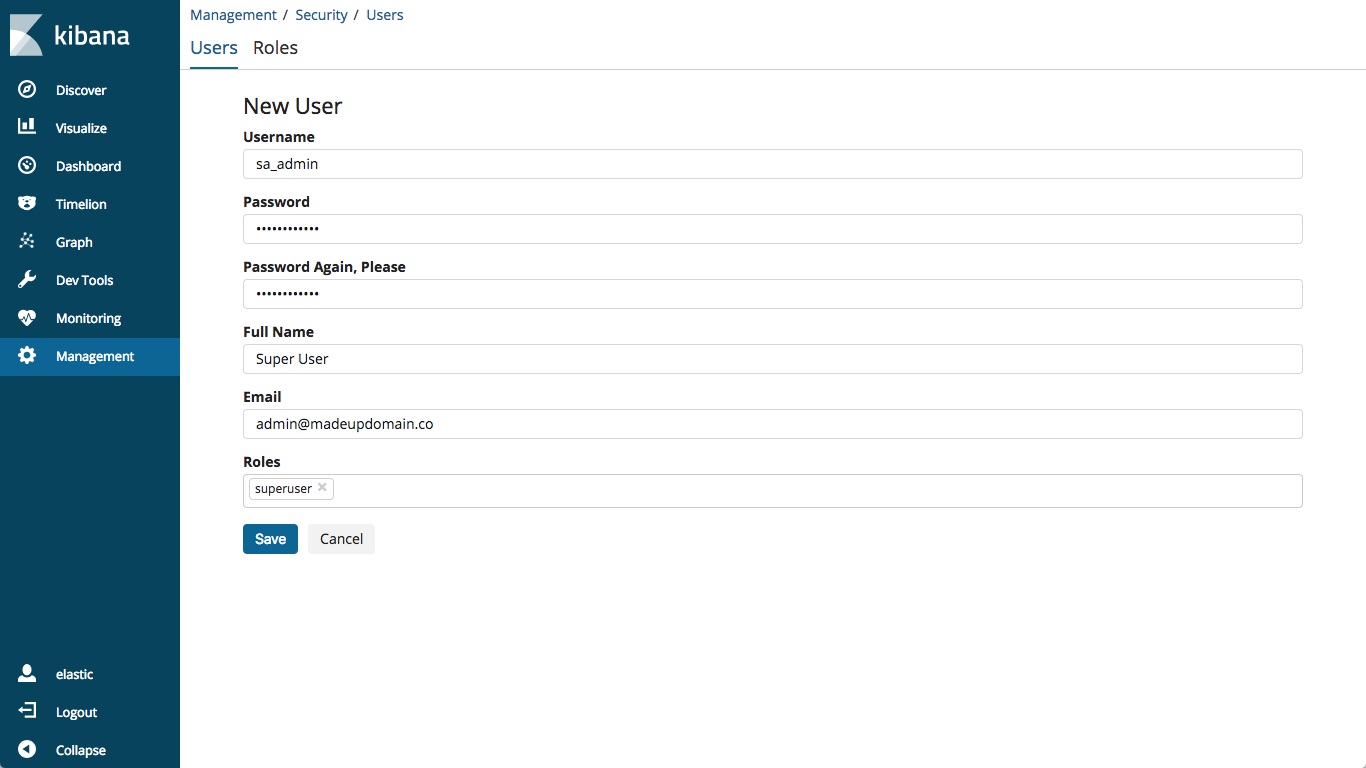
- Create additional users and/or configure existing user names and passwords. I will create a new user,
sa_admin. I will configure thesa_adminuser with thesuperuserrole - Specify the password for the user, I am using something super-secret
- Make sure that you remember the username and password that you added- save your credentials in a secure vault. Or on a Post-it note 😉.
You can update your passwords and add additional users using the same process. You may also use the new security API by following the instructions in our documentation.
Elasticsearch Endpoint
Once you have logged into Kibana, you will see the Discovery tab. However, there is not yet any data to visualize. Let's work on putting some data into Elasticsearch. Let's gather some information so we can be successful!
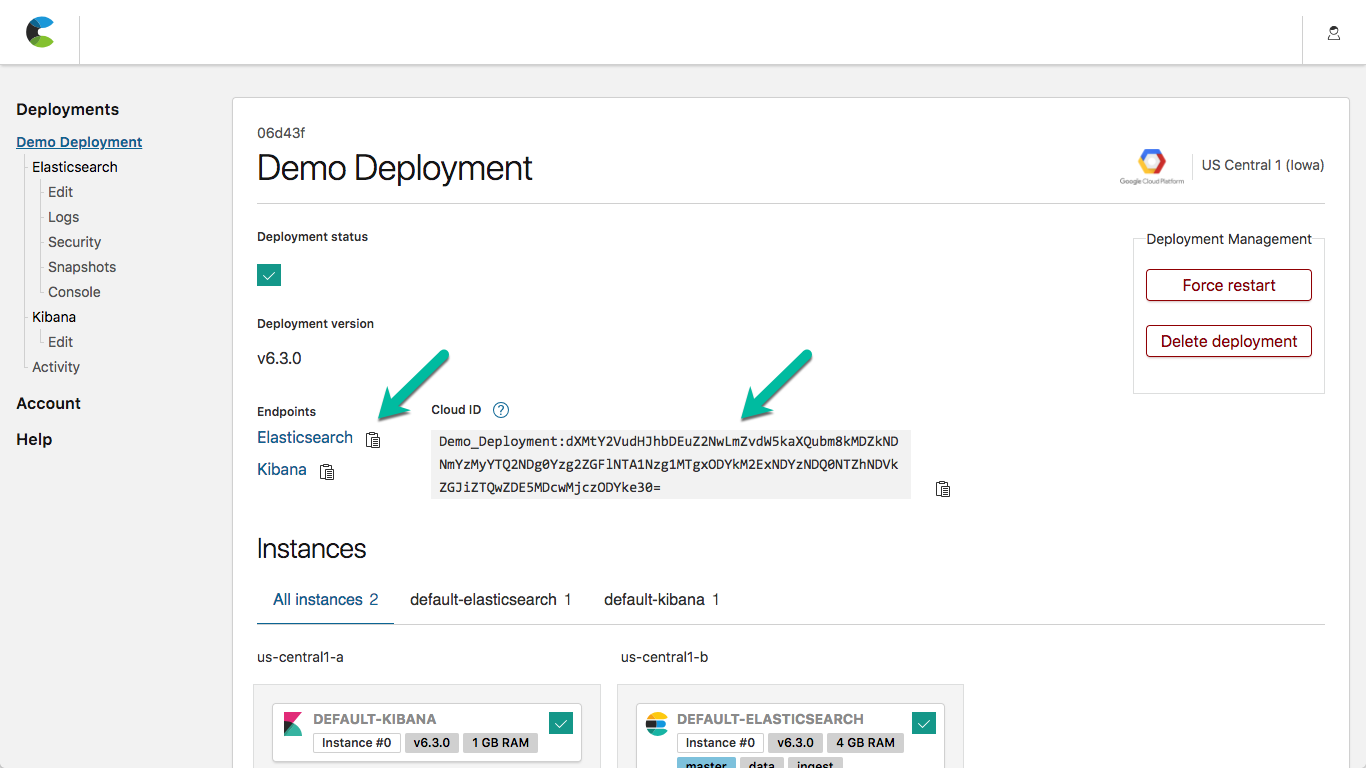
- Go to the Deployment Overview on the Elastic Cloud console. The Elasticsearch endpoint is used for API access to your cluster
- Click on the "clipboard" icon next to the Elasticsearch endpoint link-- this will copy the https URL which will be used in the following steps
- We will also leverage the Cloud ID when loading our sample dataset. Refer to this image to find the pieces that you need
Import Data
Now let’s put some data into our Elasticsearch cluster so we can see the Elastic Stack in action. If you don’t have a sample dataset handy, use one from the various data samples in our GitHub Examples Repo. I'll be using the Apache logs sample and Filebeat (download your system version). To ingest the logs into our hosted Elasticsearch cluster, we will specify the parameters on the command line, but you can also specify them in the configuration file.
1. Loosely following the instructions on the apache logs readme, we will download the apache_logs file by right-clicking on this link and selecting your browser's equivalent of "save to downloads"
2. Download and expand the filebeat archive appropriate for your platform, and change to the filebeat directory
3. Run filebeat, specifying the Cloud ID (from the above configuration screen) and the Cloud Auth parameters (the username & password which we added), along with the absolute path to where you stored the apache_logs file:
./filebeat -e \
     --modules=apache2 \
     --setup \
     -E cloud.id="<cloud-id-from-overview"  \
     -E cloud.auth="<cloud-auth-for-the-user-we-added"  \
     -M "apache2.access.var.paths=[<PATH_TO_APACHE_LOGS_FILE>]"
For example, I'm using:
./filebeat -e \
     --modules=apache2 \
     --setup \
     -E cloud.id="Demo_Deployment:dXMtY2Vu..........jczODYke30="  \
     -E cloud.auth="sa_admin:s00p3rS3cr3t"  \
     -M "apache2.access.var.paths=[/Users/jamie/Downloads/apache_logs]"
4. Note that the above command won't stop when it has finished that file (because it is watching for updates), but you can check the status to determine when it's done. I find it useful to store the value of the Elasticsearch endpoint in an environment variable. In a new terminal window I set this up, substituting the Elasticsearch endpoint URL for the part after the = sign:
export ES_ENDPOINT=https://somelongid.provider.domain.co:9243
For example, I ran:
export ES_ENDPOINT=https://06d43fc32a46484c86dae50578518186.us-central1.gcp.foundit.no:9243
(This is the convention that I follow in the checks below, of course you can just paste it in each time as well)
5. You can verify that your data exists in Elasticsearch by going to ES_ENDPOINT/apache_elastic_example/_count, where ES_ENDPOINT is the Elasticsearch endpoint URL. Assuming that you set the environment variable above, you can do this using the curl command (make sure that you specify the user parameter for basic authentication for our https endpoint)
%> curl --user sa_admin:s00p3rS3cr3t ${ES_ENDPOINT}/apache_elastic_example/_count
{"count":607,"_shards":{"total":5,"successful":5,"failed":0}}
6. Continue checking the count, and once it reaches 10000 you can stop the filebeat process (ctrl-c will do the trick)
%> curl --user sa_admin:s00p3rS3cr3t ${ES_ENDPOINT}/filebeat-*/_count
{"count":10000,"_shards":{"total":5,"successful":5,"failed":0}}
7. You can verify the health of your cluster by hitting to ES_ENDPOINT/_cat/indices. You should see your filebeat-* index listed along with its statistics (notice that the exact name of the index depends on when you ingested the data):
%> curl --user sa_admin:s00p3rS3cr3t ${ES_ENDPOINT}/_cat/indices
green  open .kibana                   6EL2PmMfSzK7777PPxm_DA 1 0   143 0 265.3kb 265.3kb
green  open .security-6               -h44-IzPQCCp3S3KREaDQA 1 0     1 0     5kb     5kb
yellow open filebeat-6.2.4-2018.05.21 qwuGJyfGSw23O1bLy97I0g 3 1 10000 0   3.2mb   3.2mb
Visualize Data
Now let's access your Kibana instance and continue with the example instructions to visualize our data.
Go to Index Pattern options under the Management tab and verify that the filebeat-* index is in Kibana. If not, add it, click Next Step, then select the @timestamp as the time filter field name. Finally, hit the Create index pattern button.
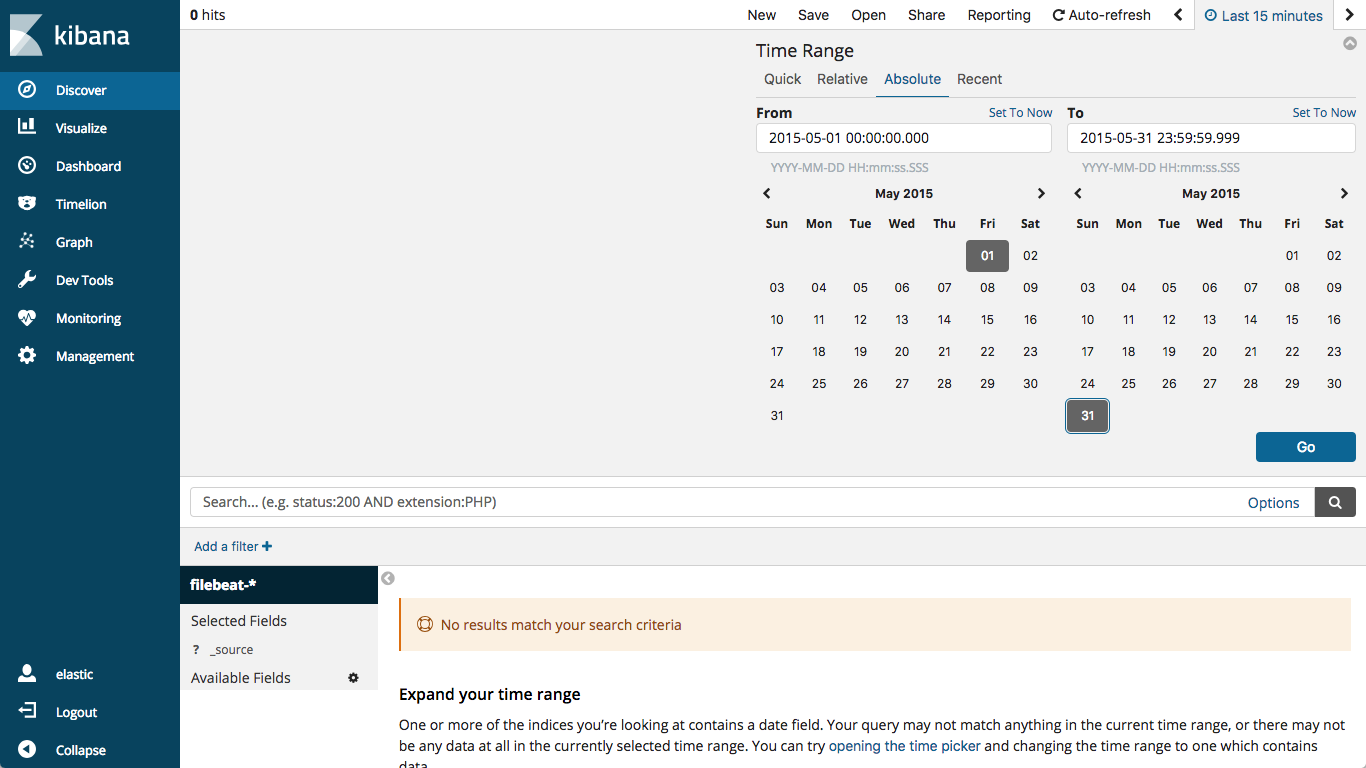
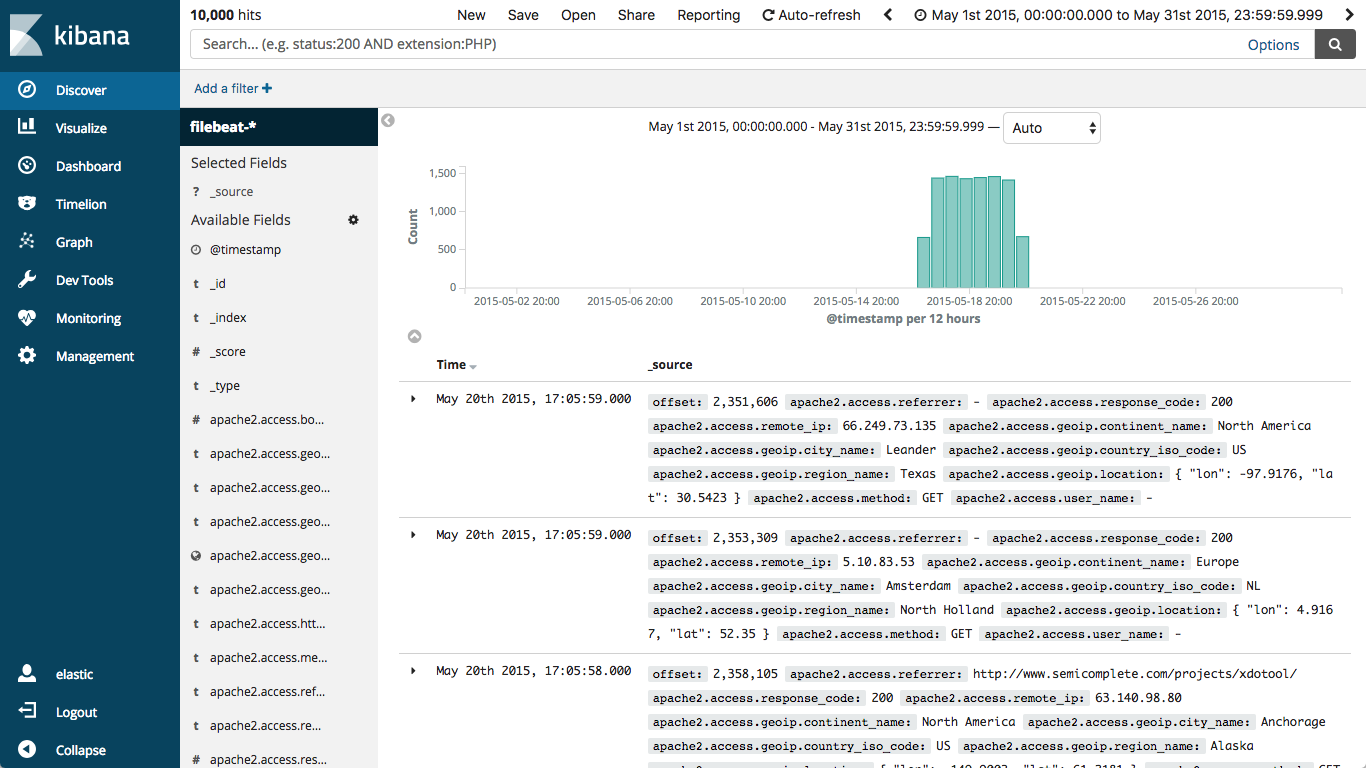
1. You can look at your data by selecting the filebeat-* index on the Discover tab, then changing the time window to May 2015 (which is when our data was generated):
which would then look like this:
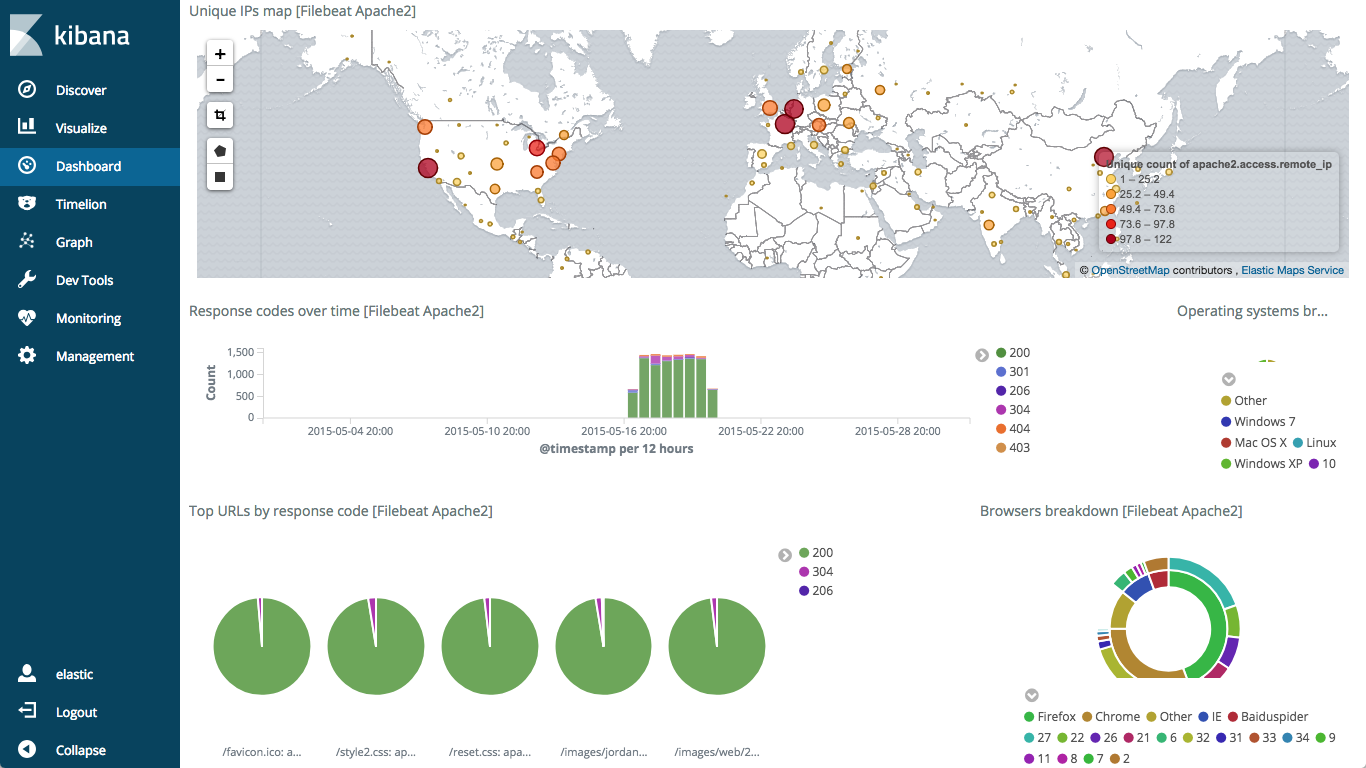
2. Since we started filebeat with the --setup flag, it automatically loaded the dashboards for us. Navigate over to the Dashboard sidebar, and select the [Filebeat Apache2] Access and error logs dashboard.
Summary
We have successfully set up a deployment, imported sample data, and looked at our first saved dashboard! Now you have some sample Apache log data in Elasticsearch and you can begin to get some insight and more importantly value from your logs. You can continue exploring with other sample datasets from the Examples repo and the Kibana getting started guide or start sending your own data by using Logstash or Beats.
Here are some other useful links to help you on the journey of using the Elastic Stack on Cloud.
- Cloud https://www.elastic.co/guide/en/cloud/current/index.html
- Kibana https://www.elastic.co/guide/en/kibana/current/index.html
- Elasticsearch https://www.elastic.co/guide/en/elasticsearch/reference/current/index.html
- Beats https://www.elastic.co/guide/en/beats/libbeat/current/index.html
- Logstash https://www.elastic.co/guide/en/logstash/current/index.html
Or, you can continue your Training with some official classes by some world-class Education Engineers: https://www.elastic.co/training