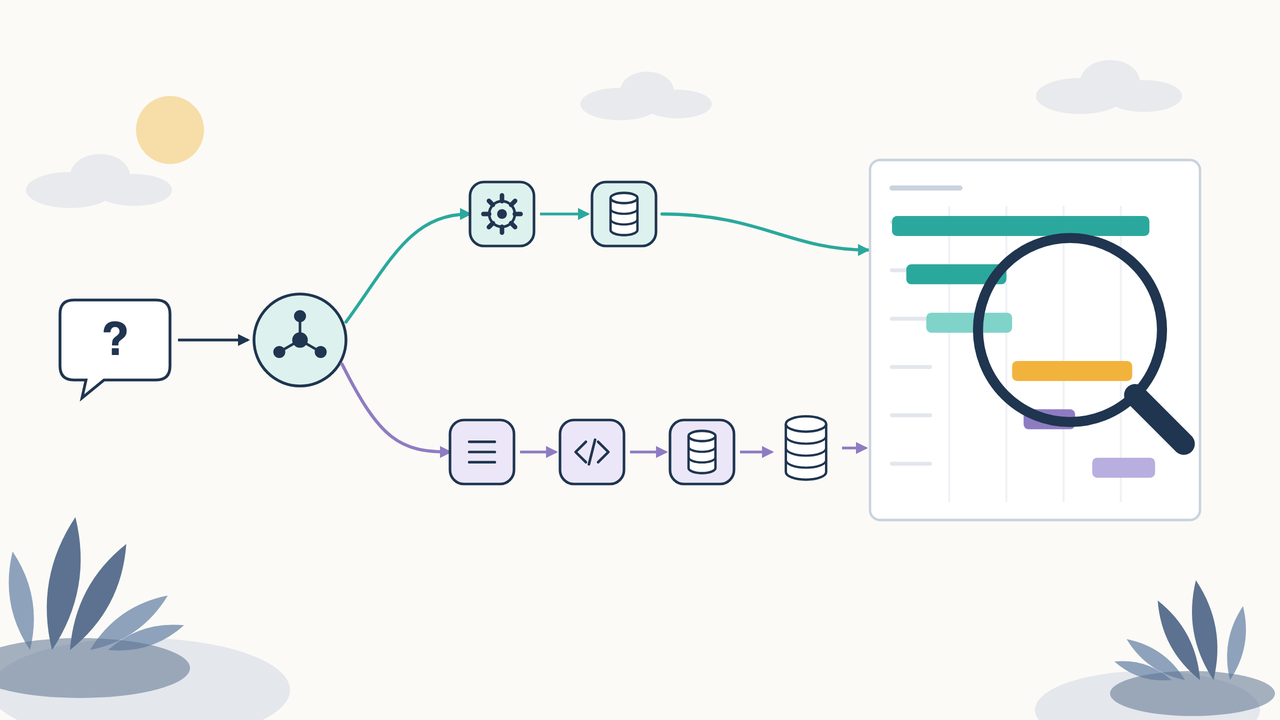
Three model calls, 92% of the wait: AI agent observability with OpenTelemetry
A cheaper model cut spend by 76% to 83% per question and got slower on four of five, which the OpenTelemetry GenAI traces from this LangChain agent explain step by step.
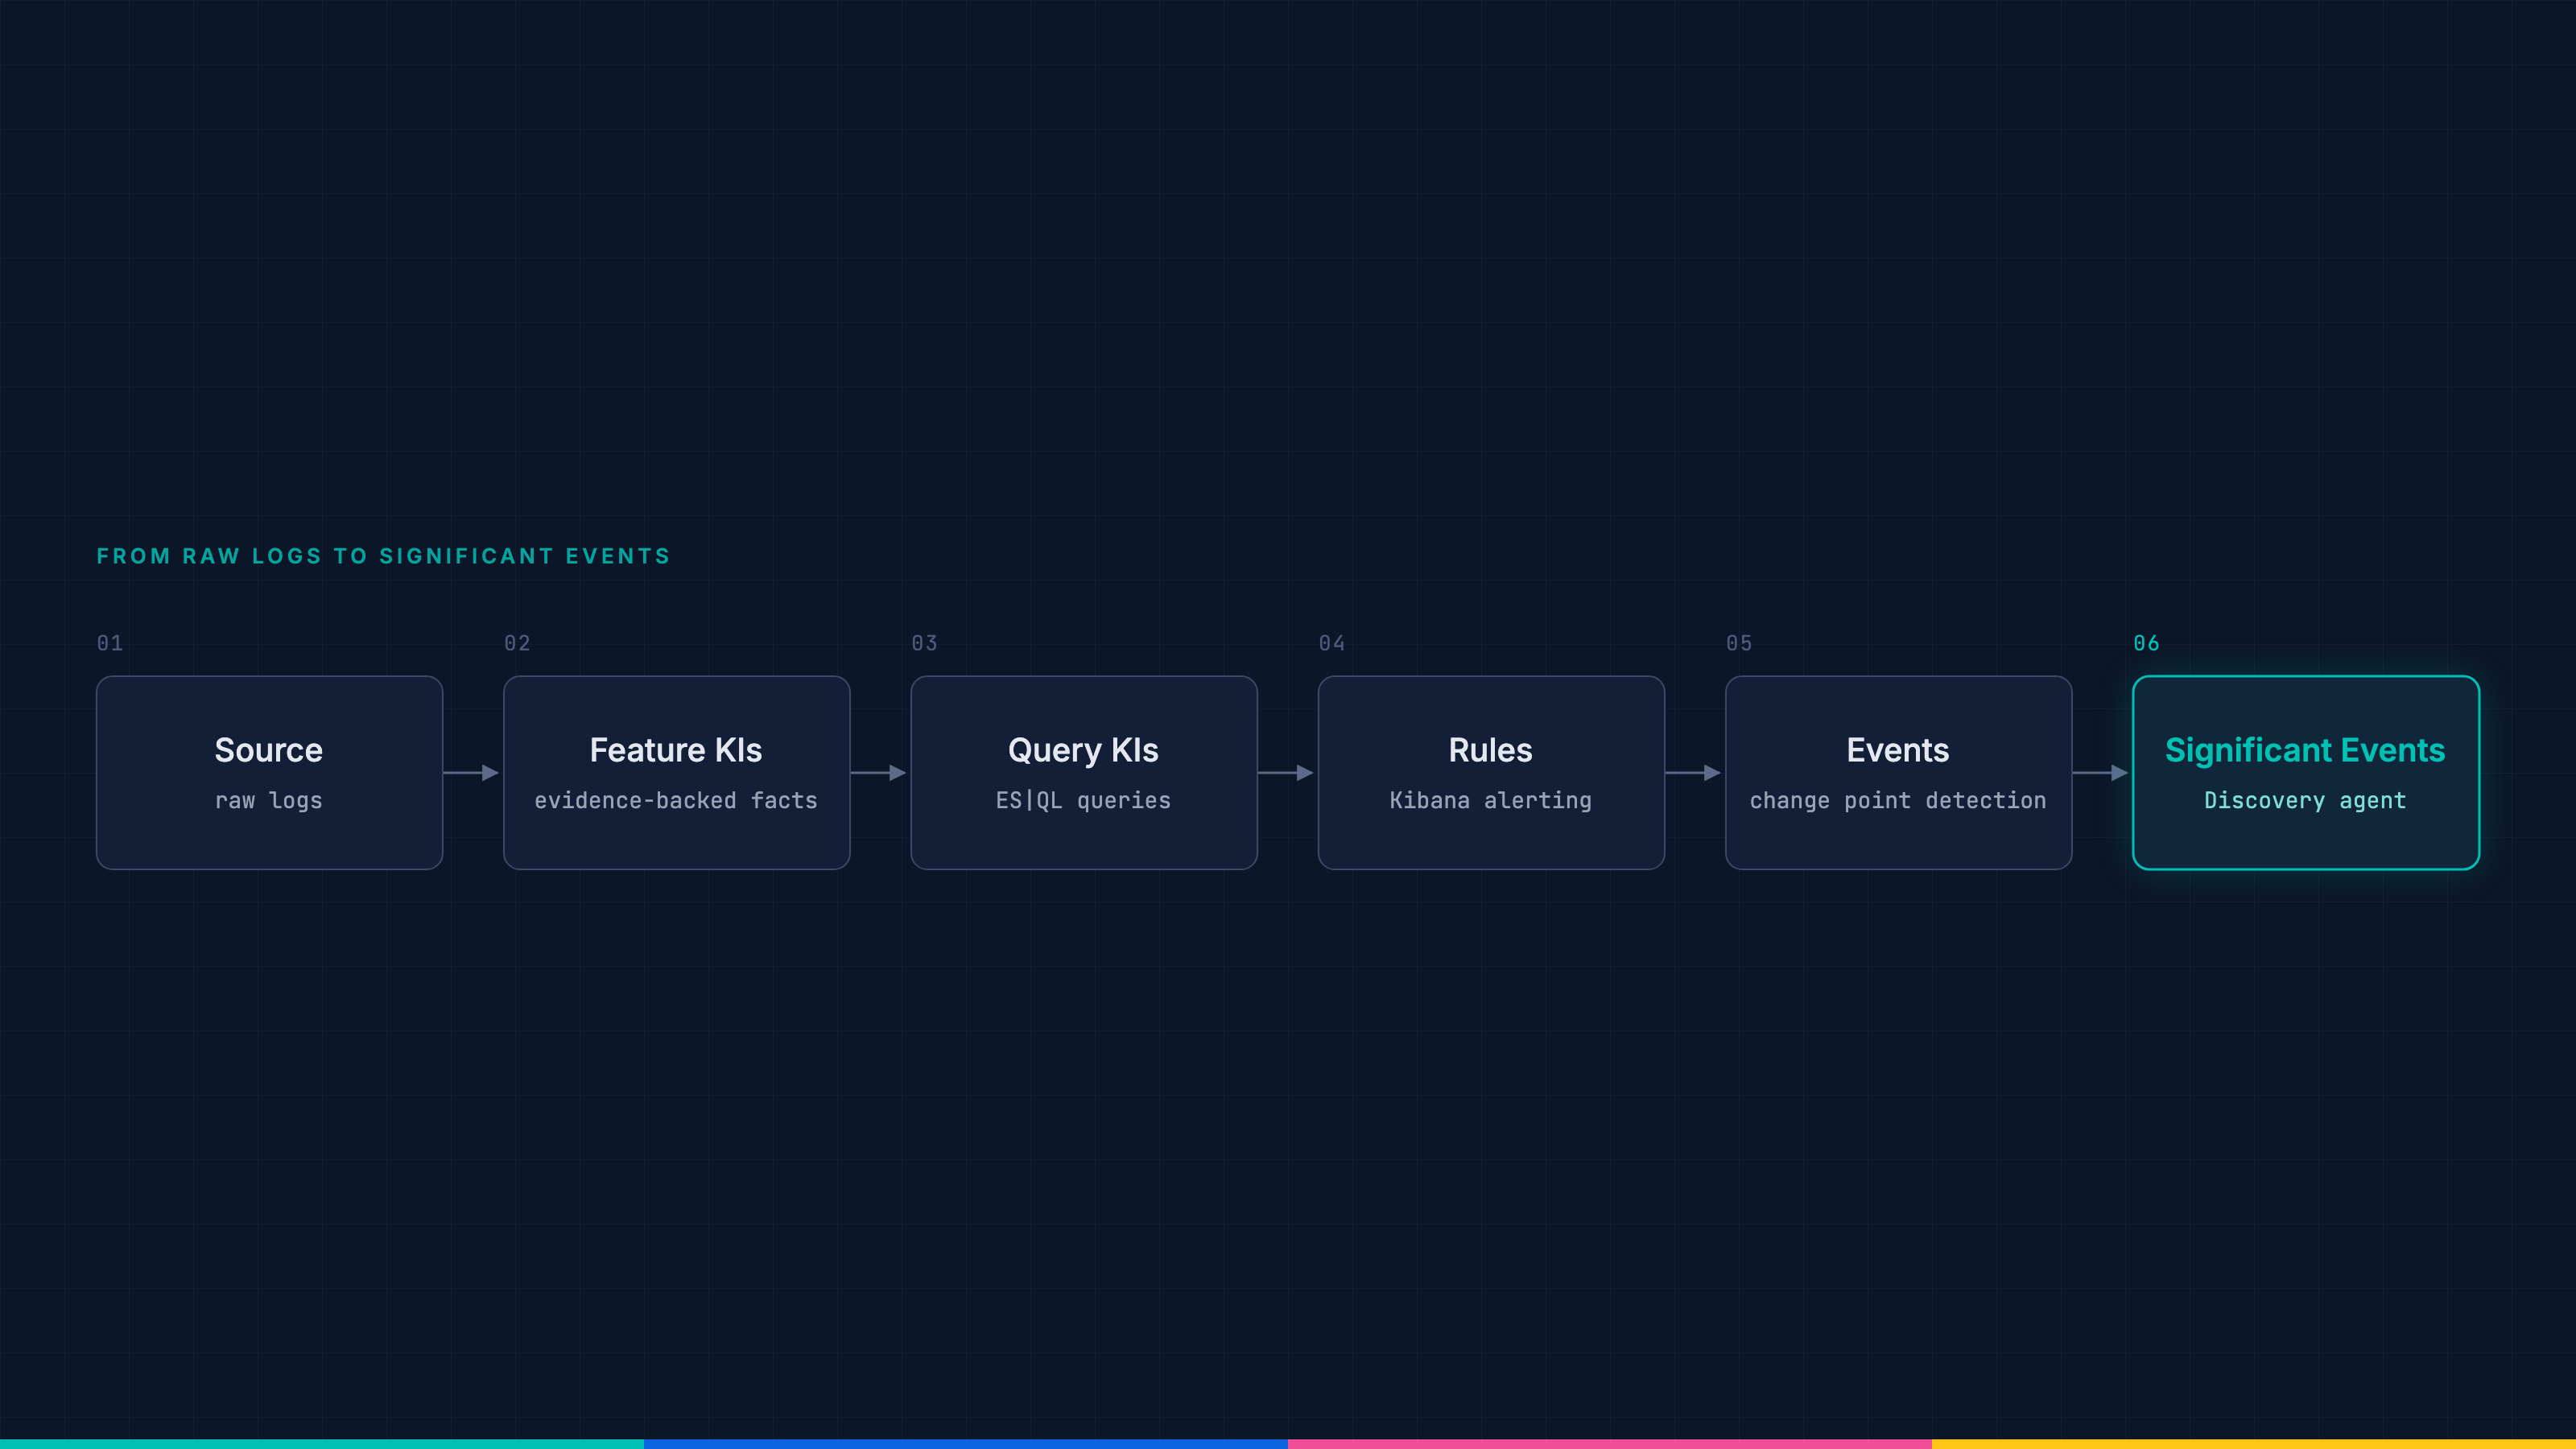
Two rules, one outage, one alert: How change point detection cuts alert noise
The discovery agent re-runs each firing rule’s own ES|QL query against the logs unchanged, so the alert names the unreachable service with the query that proves it.
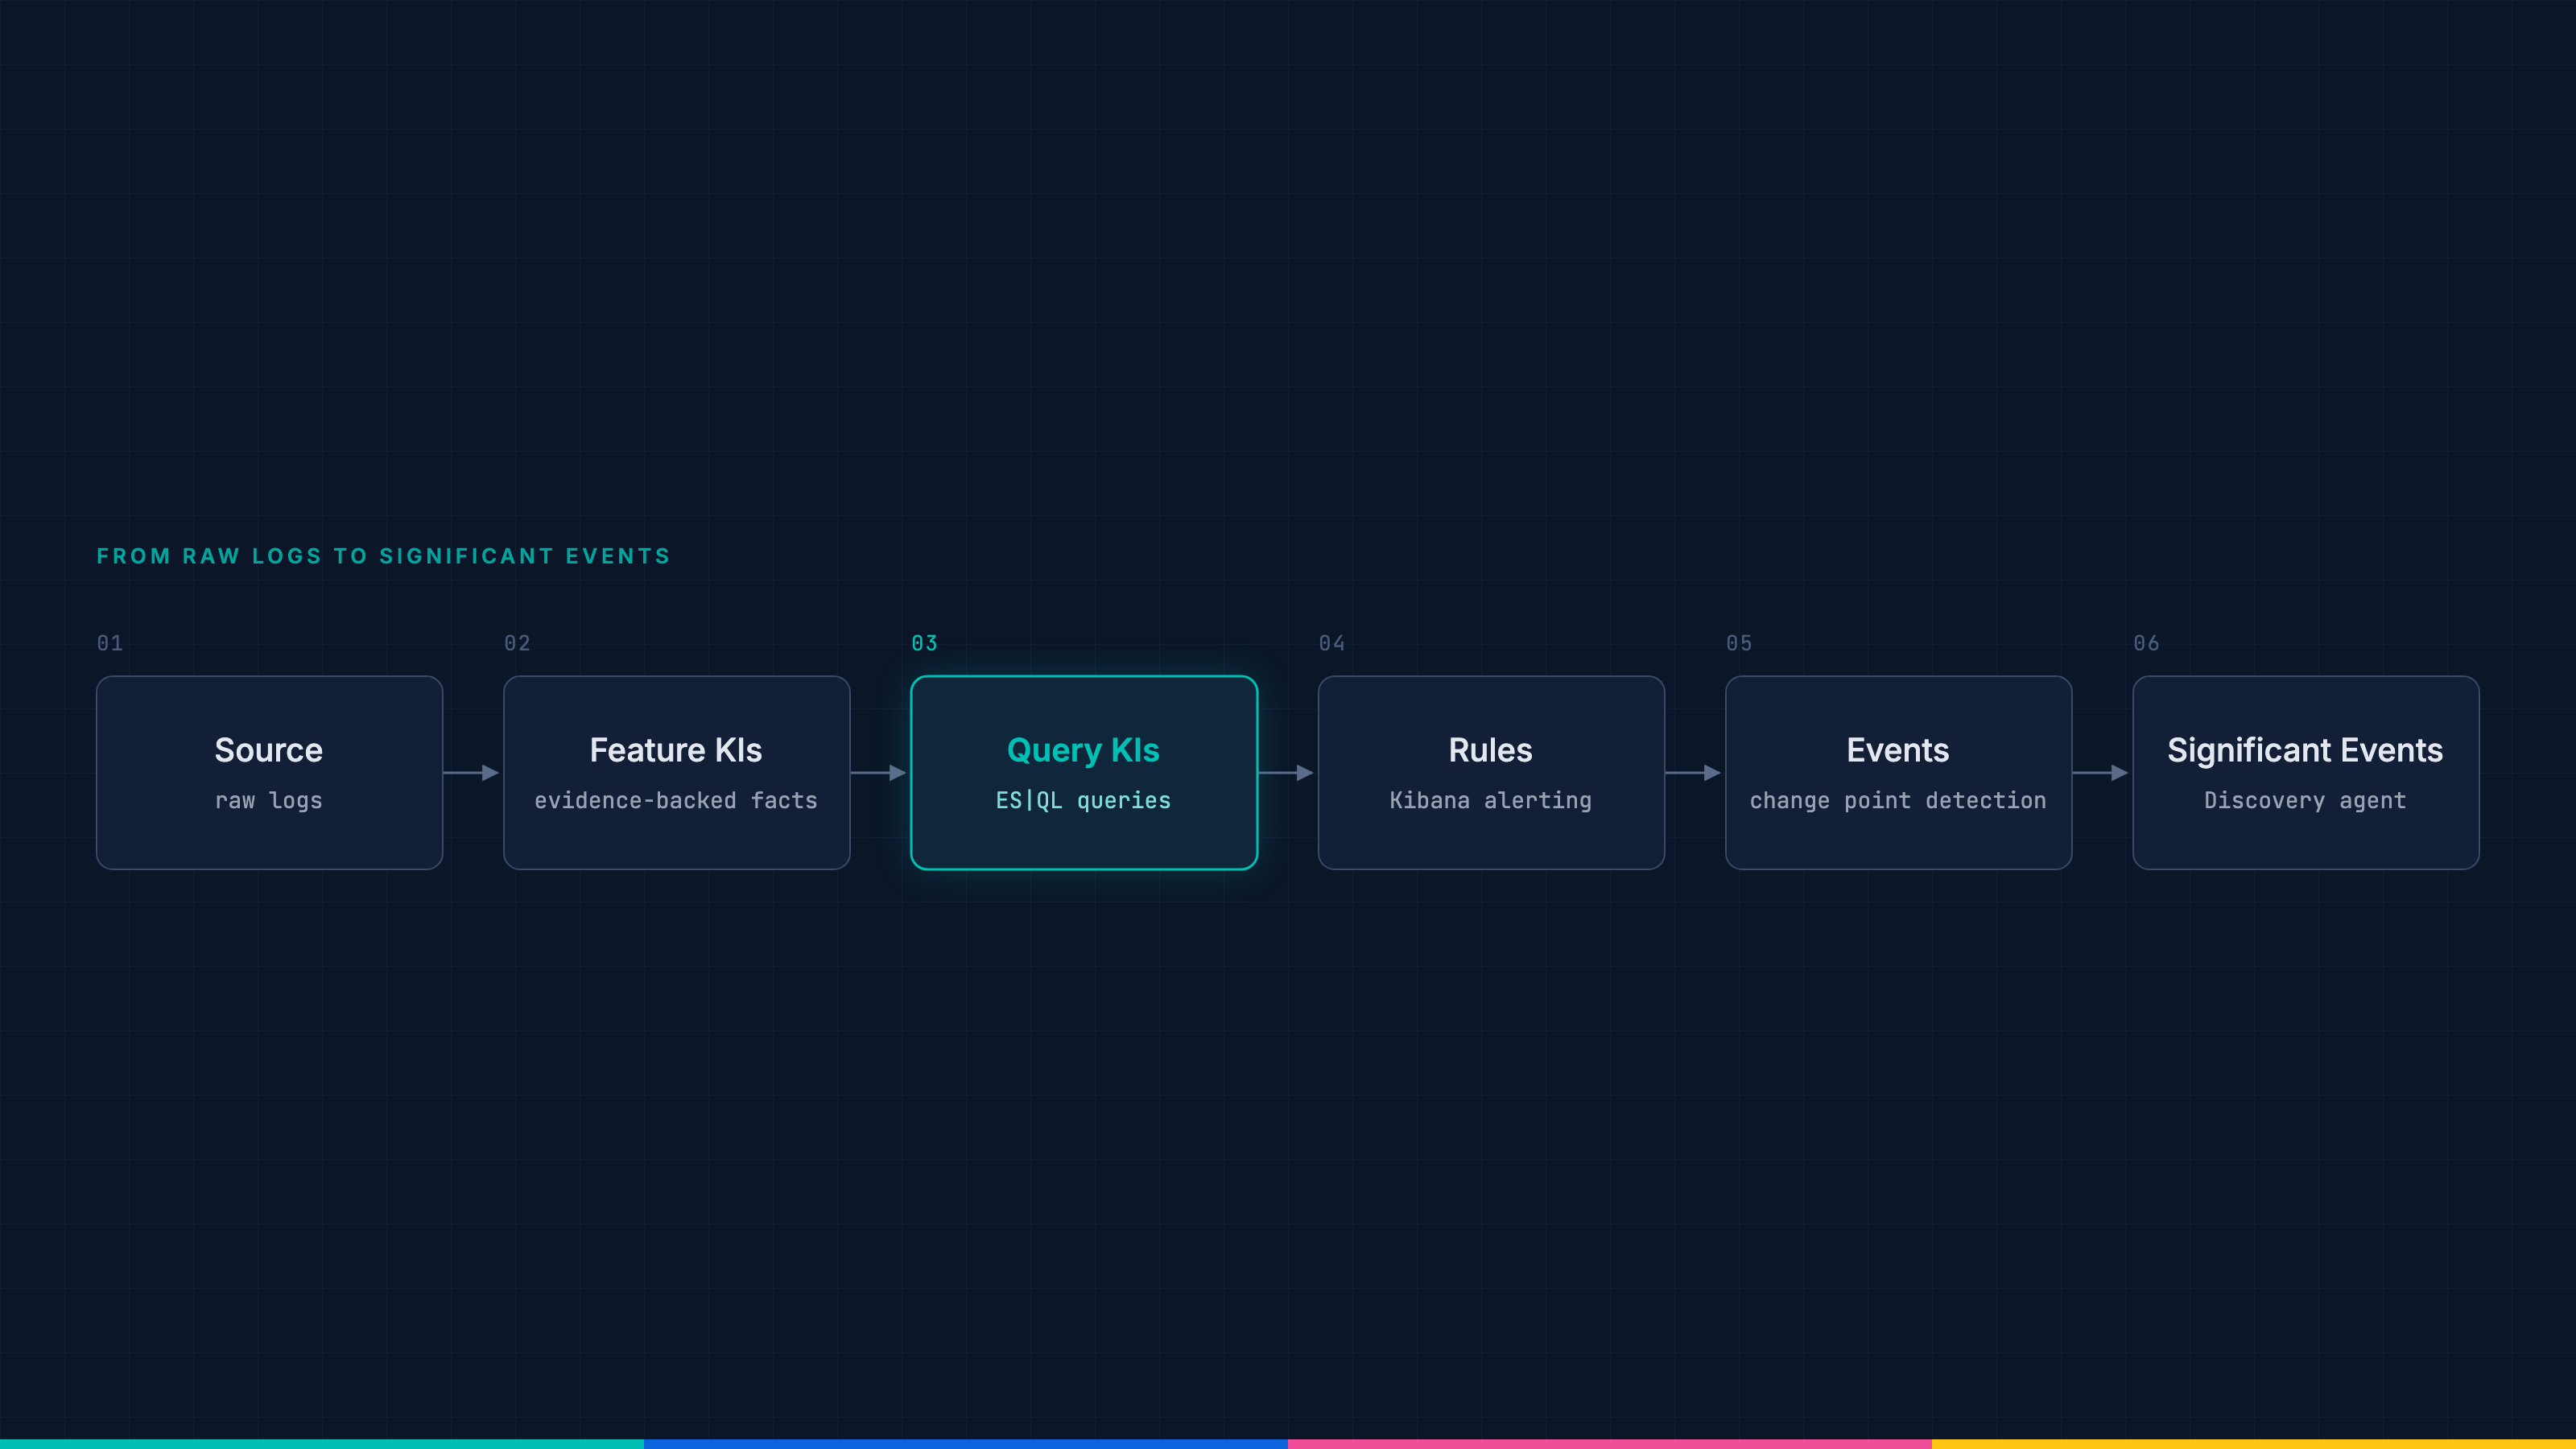
Your logs already wrote the alert: Generating ES|QL detection queries in Elasticsearch
On the OpenTelemetry demo, the top generated ES|QL detection query matches 0 documents while the shop is healthy and 676 during a payment outage.
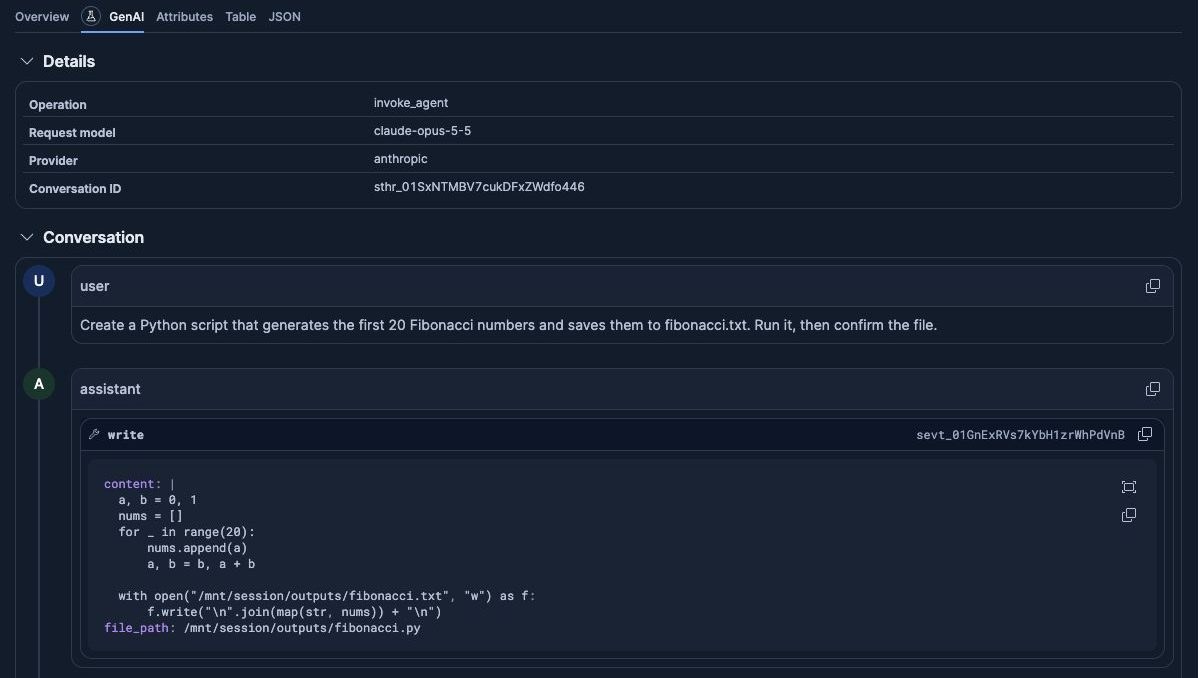
AI agent observability in Elastic for Claude Platform with OpenTelemetry
Send Claude Platform traces to Elastic and the whole turn arrives in Kibana. The service sits in your service inventory next to the rest of your stack, so you can observe it, create alert rules, and create SLOs.
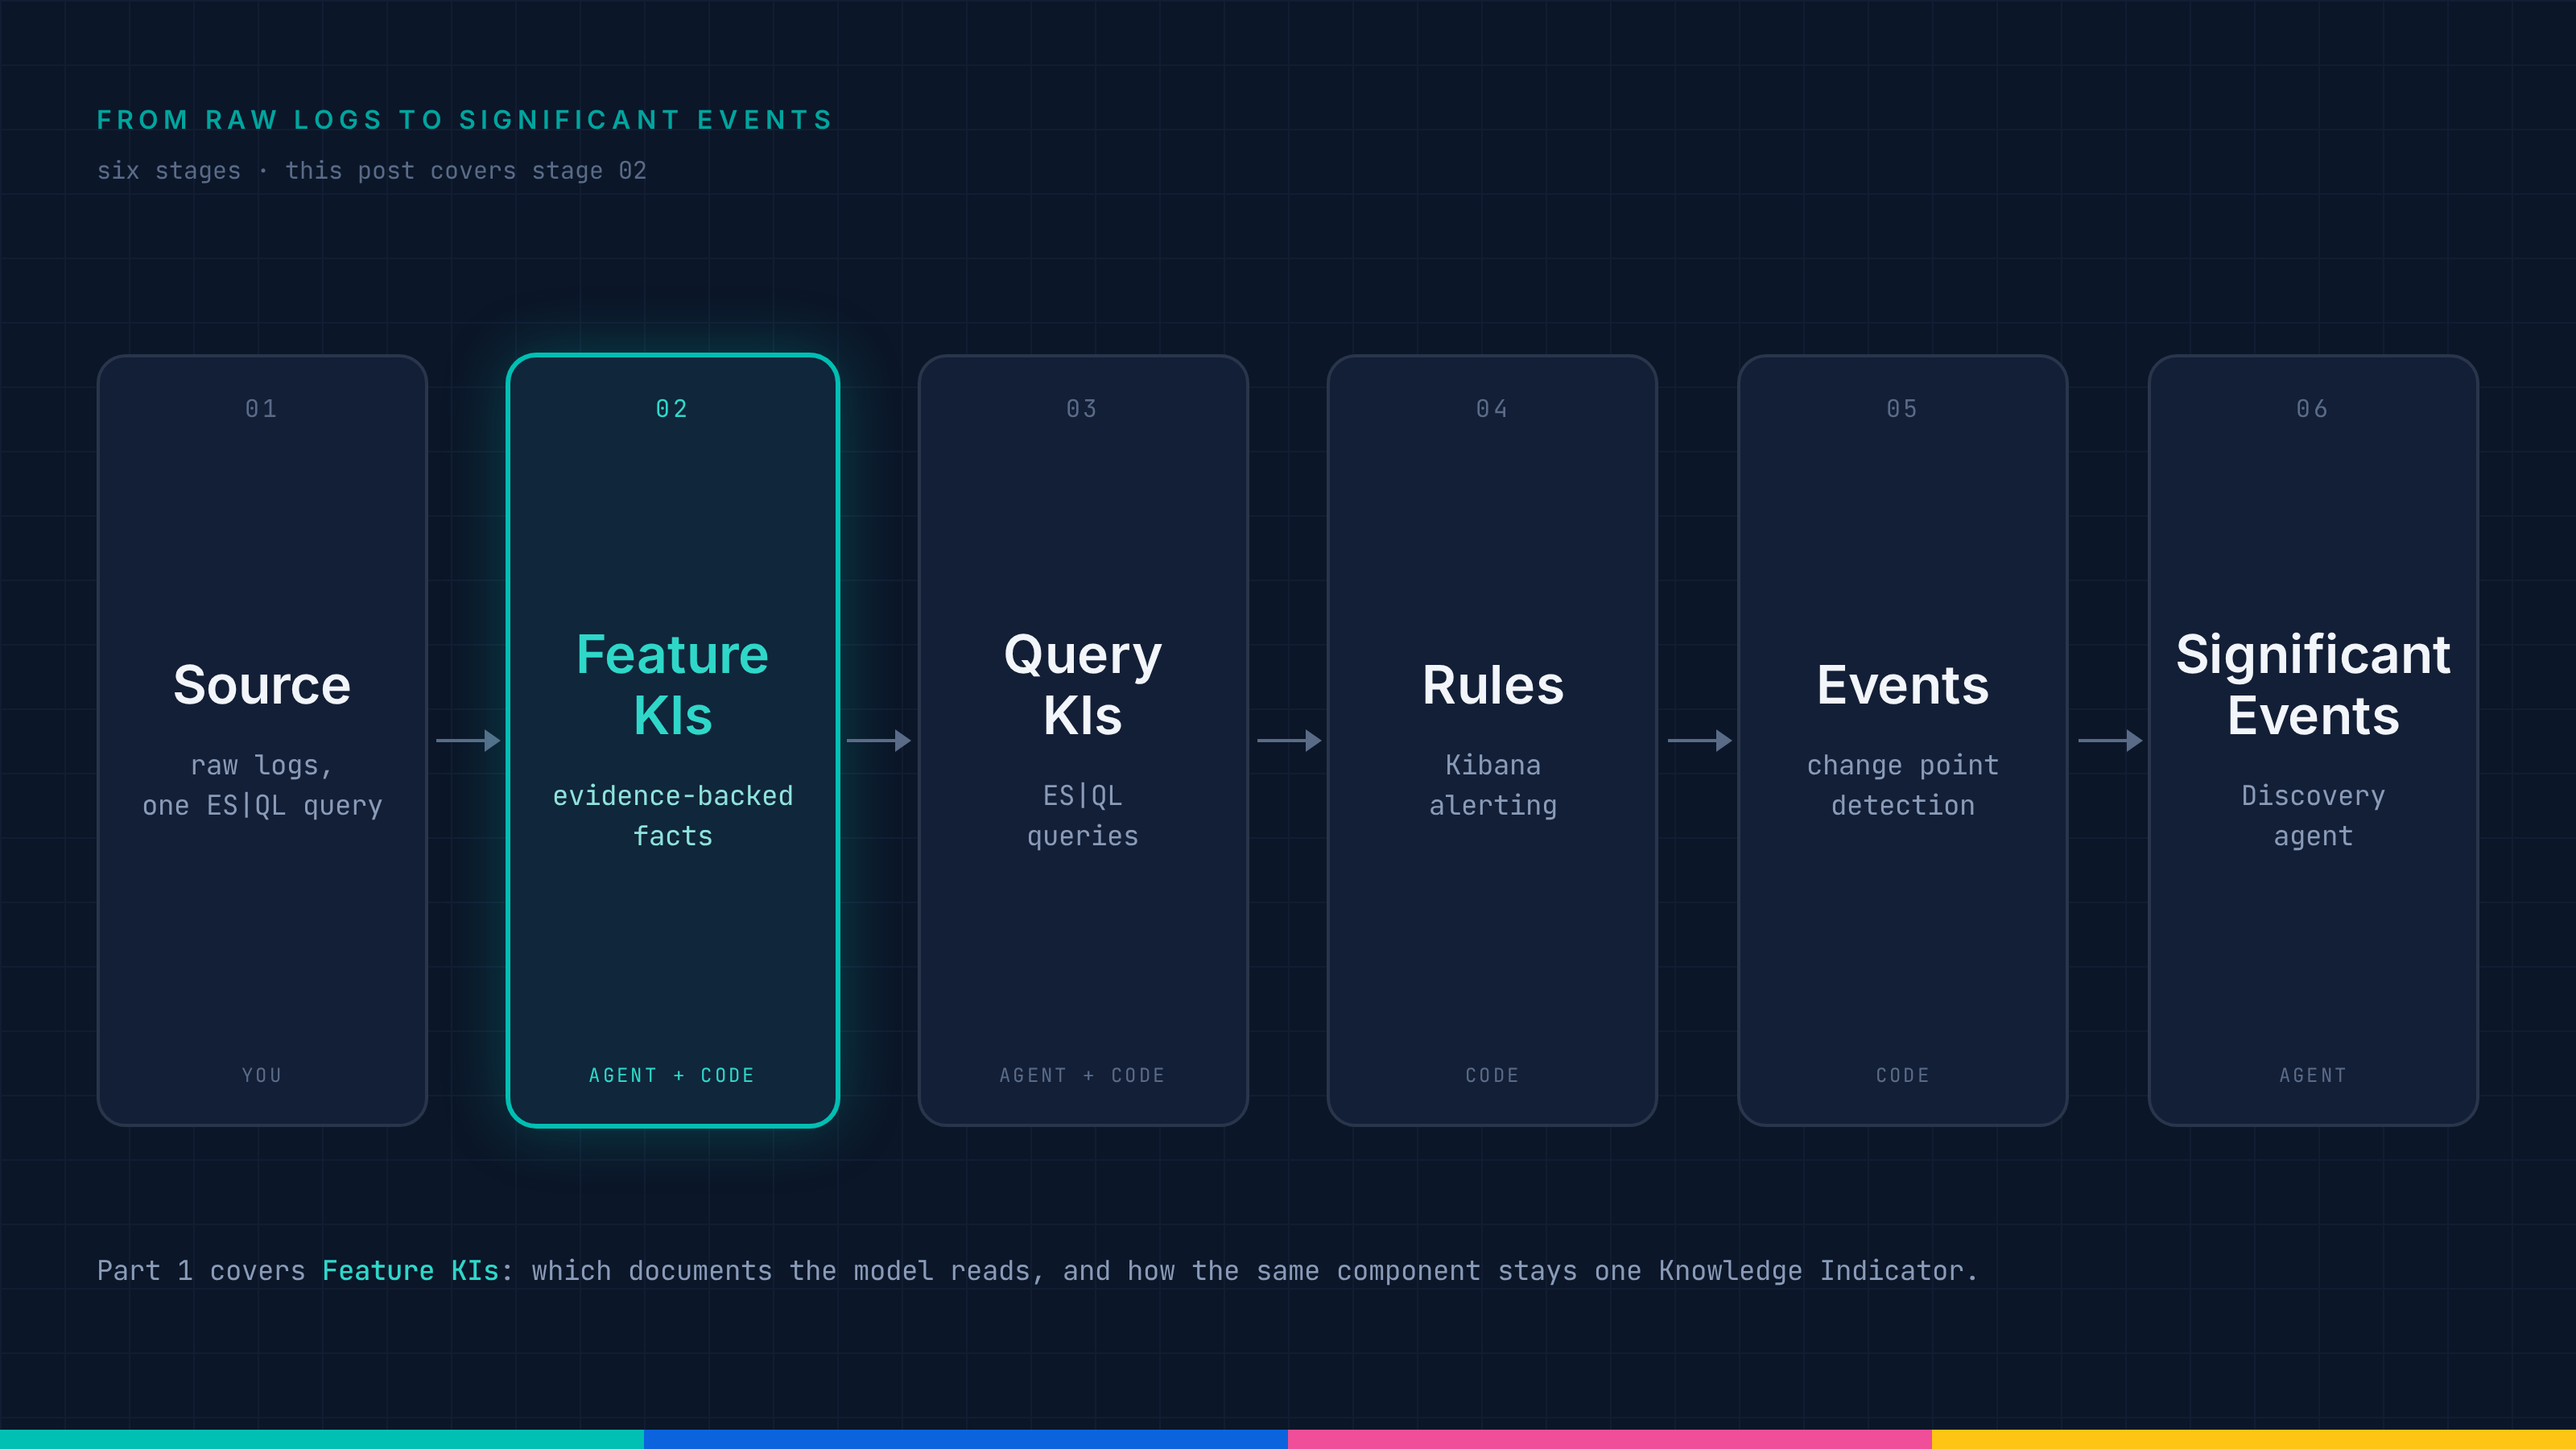
How Elastic Significant Events turns 100 log samples into detection rules
Pick the wrong 100 and you get `log.level: error`, a rule that fires on every request or finds nothing at all, and log sampling is what decides between them.
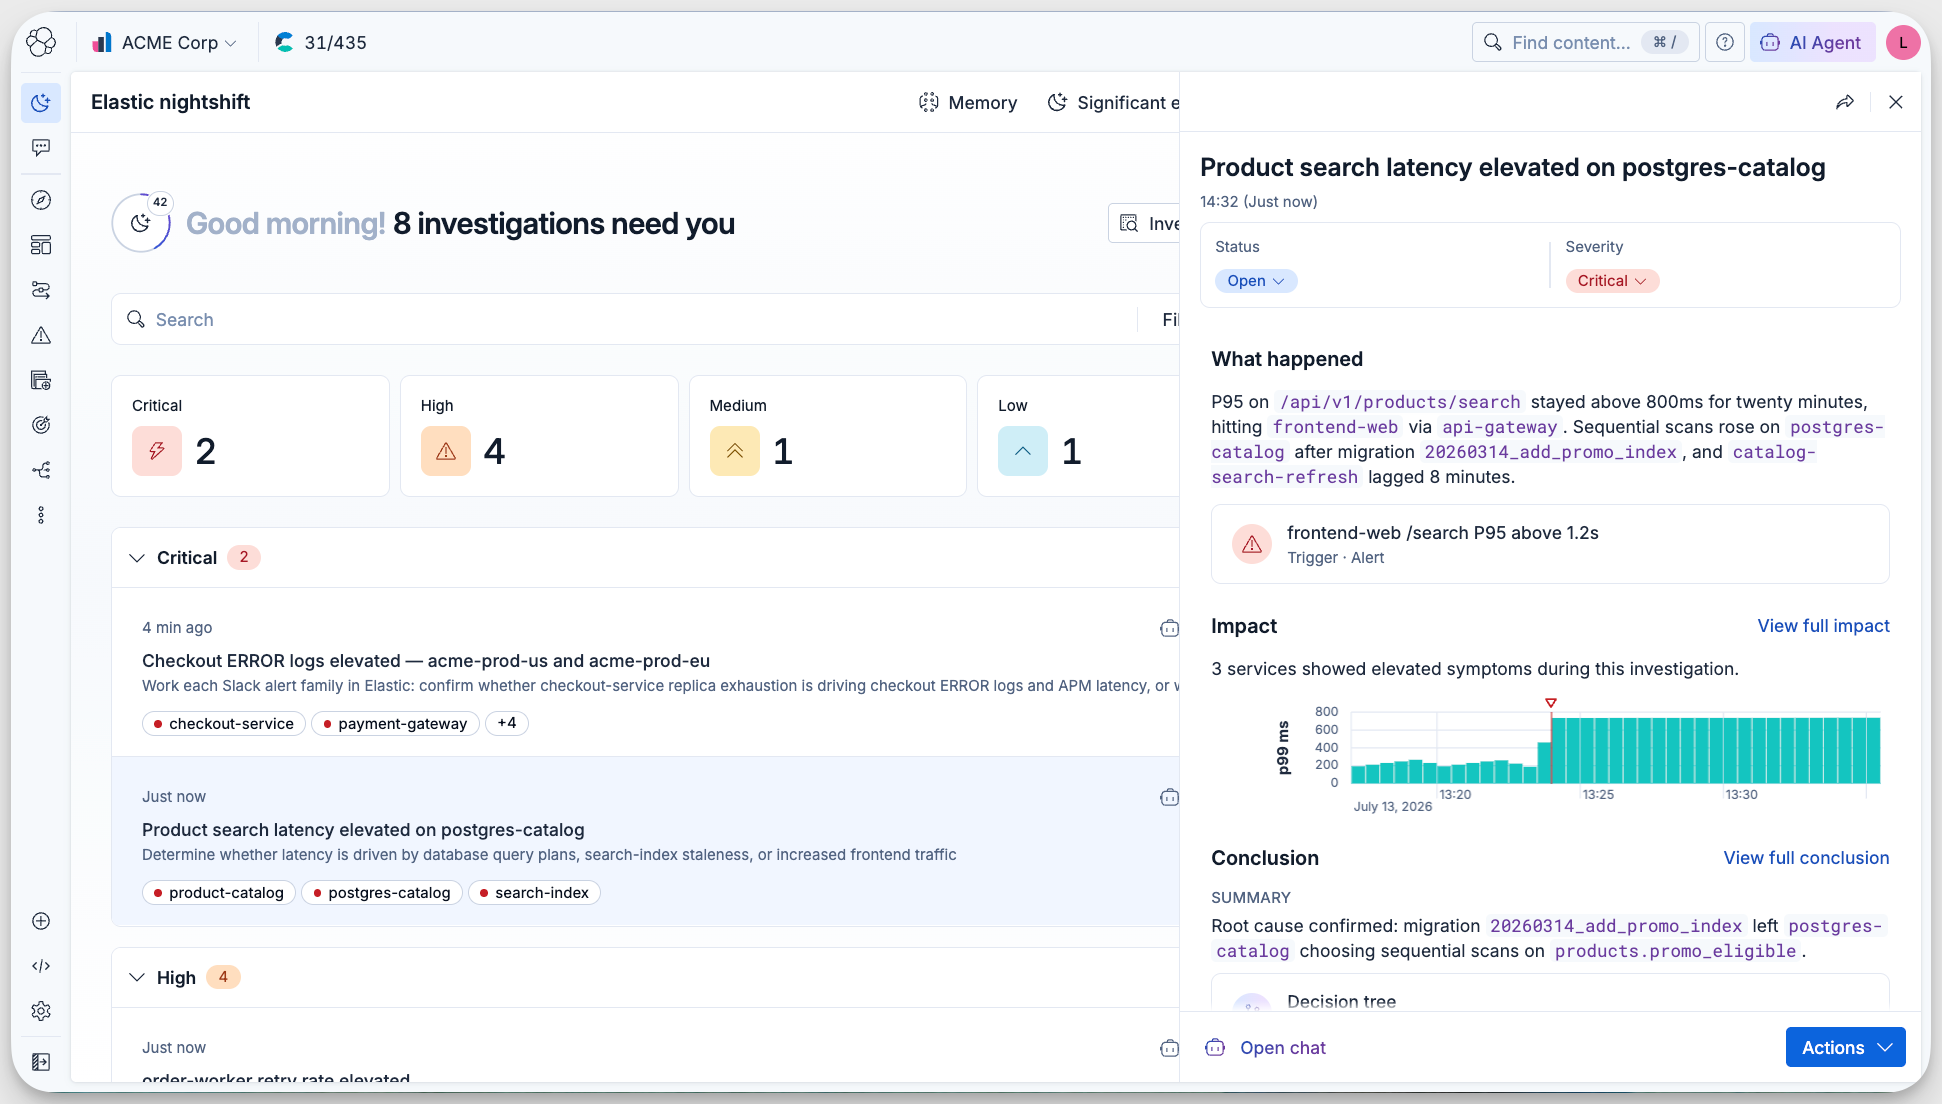
Meet Elastic nightshift AI SRE, your always-on SRE coworker
Elastic's SRE team has been running Elastic nightshift against our own production environment. It picks up incidents that never triggered an alert and shows its working for every conclusion it reaches.
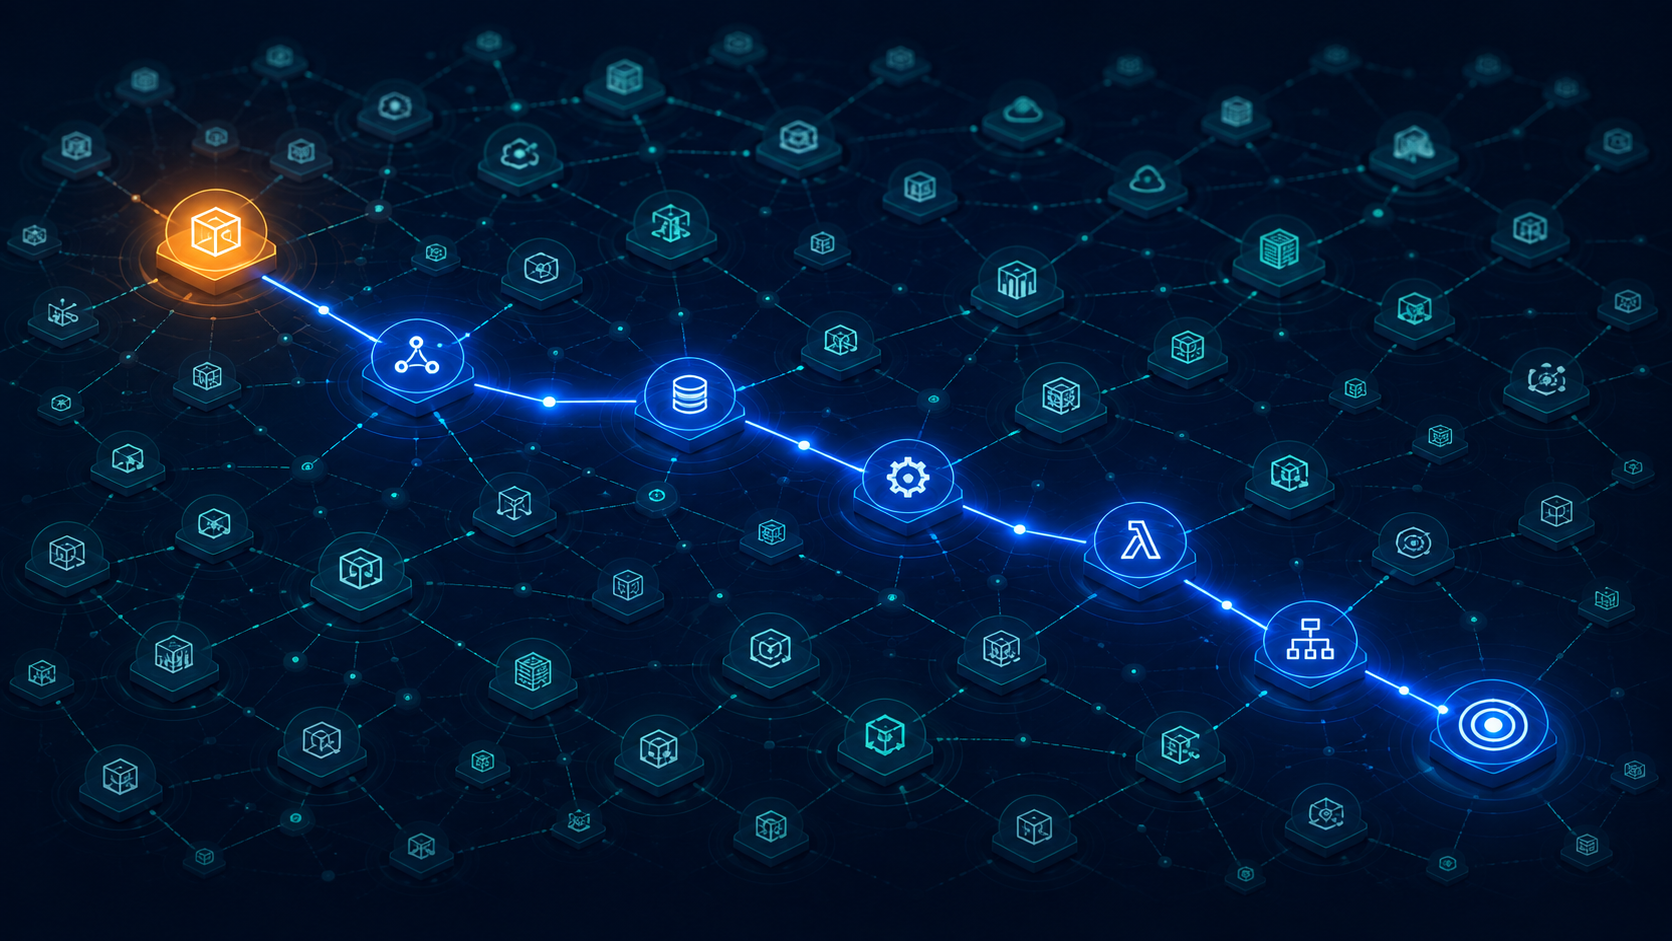
Automated root cause analysis for AWS: From a CloudWatch alert to a diagnosed incident in 36 seconds
We broke a live RDS instance with a connection leak, and the workflow came back with the Postgres refusals, the downstream 5xx and a root cause nobody had to write by hand.
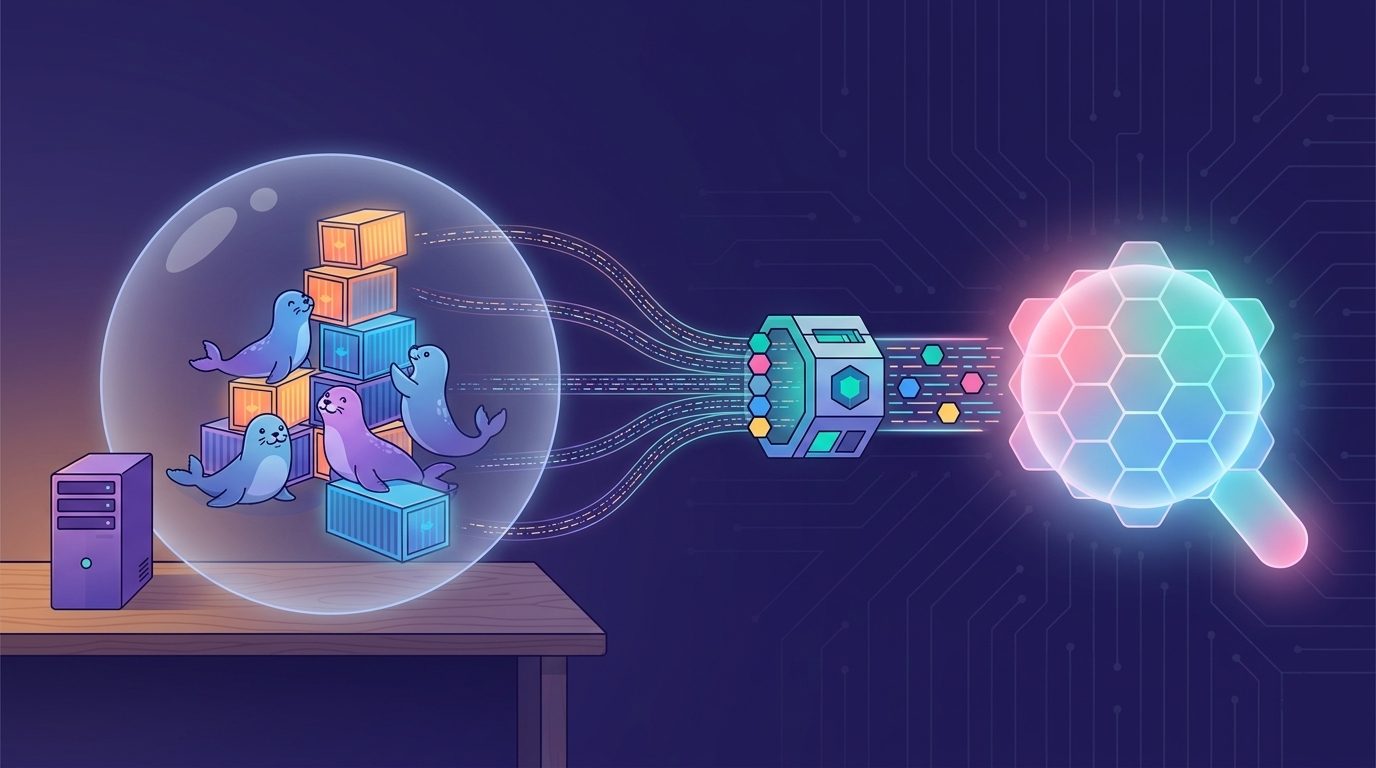
Collecting rootless Podman logs with Elastic Agent: the CRI parser, user-scoped paths, and the Podman socket
Rootless Podman containers write their logs in CRI format. This Fleet policy reads them and attaches container.* fields, with the match_source_index value that rootless paths need.
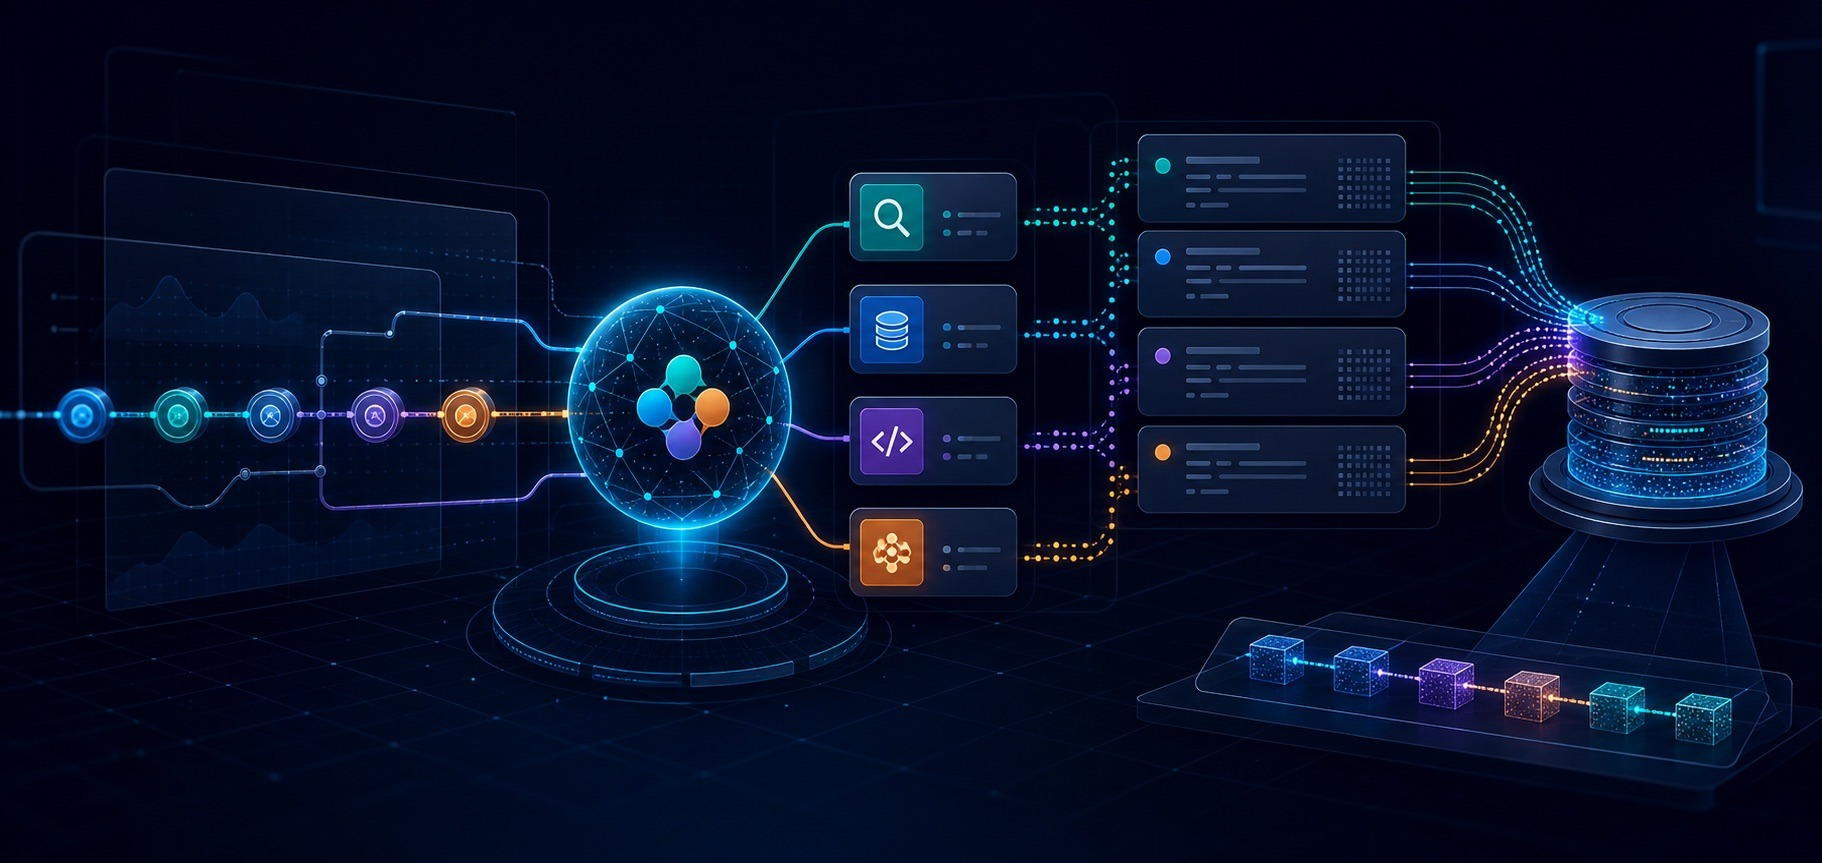
Your AI agent needs an alibi: Observability and audit trails for Agent Builder in Elastic
Elastic 9.5 traces every Agent Builder run as OpenTelemetry spans in your own cluster, so tool calls and token counts are queryable with ES|QL. One workflow step adds the approval record, in a data stream the pipeline cannot rewrite.
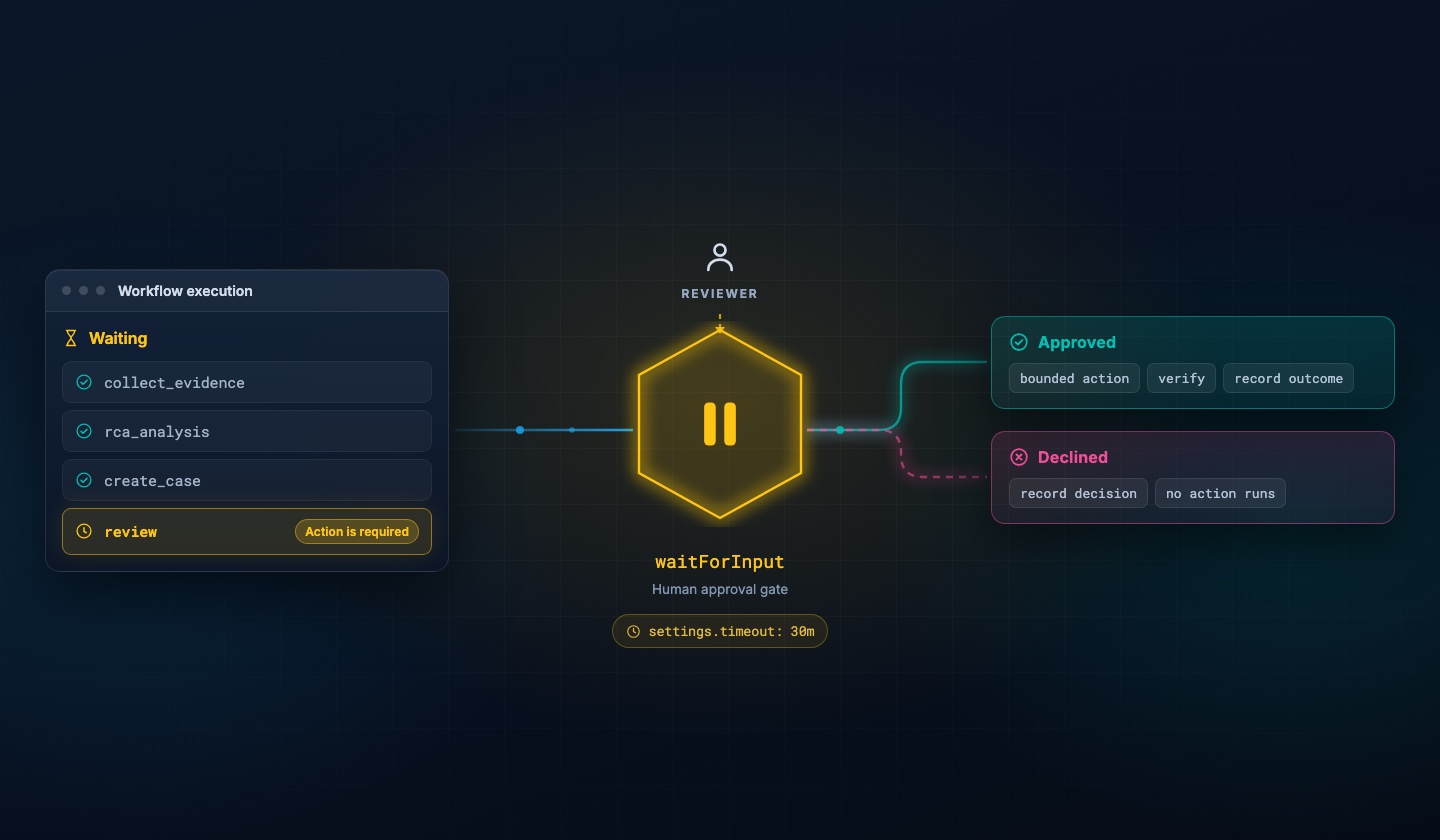
From recommendation to remediation in 4 stages: human-in-the-loop automation with Elastic Workflows
An approval gate that pauses incident response automation before the action and gives the reviewer enough evidence to decide in seconds. Whatever happens next, approved or declined, lands in one auditable record.
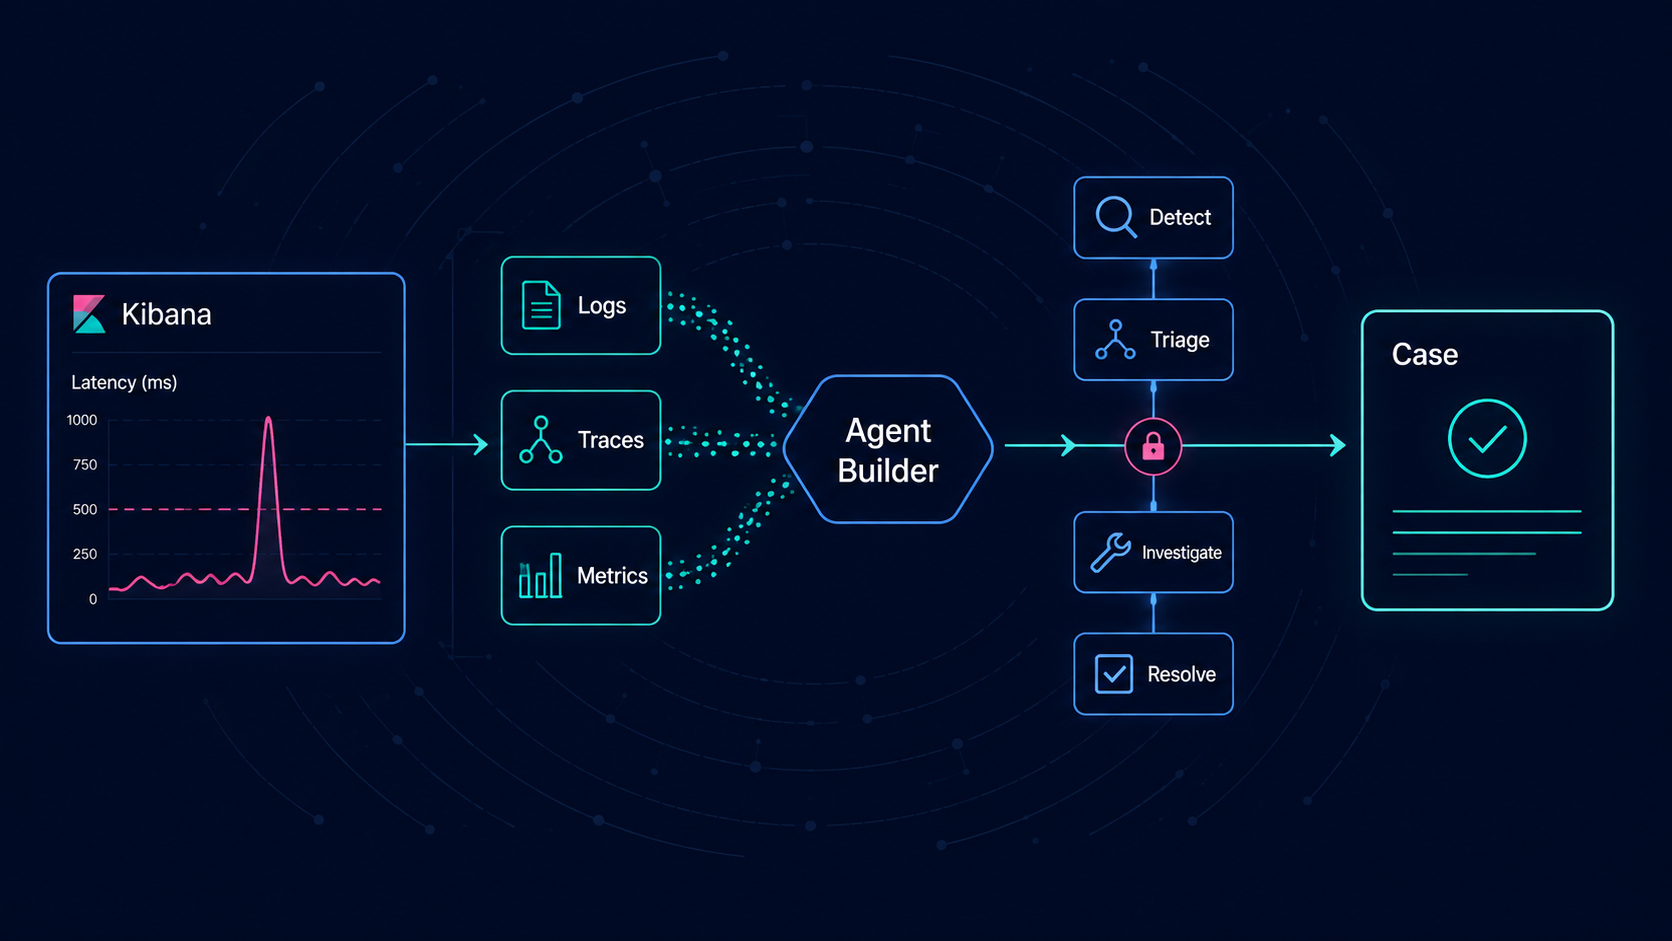
From alert to root cause in 3 minutes: automated root cause analysis with Elastic Agent Builder
Automated root cause analysis only works if the agent compares the incident window against the last healthy one. Skip that step and you get a summariser. The read-only skill, the scoped role and the Elastic Workflow are all here.

Elastic Agent now runs as an OpenTelemetry Collector: Less memory overhead, zero config changes
Elastic Agent 9.3 sends logs, metrics and traces through one OTel Collector pipeline, running Beats integrations alongside native OTel sources in a single Fleet-managed agent.