Monitoring your infrastructure with OpenTelemetry
Observability 101: Lesson 3 of 4 — In this 15 minute lab, use Elastic Observability to dive into a java issue with high-cpu usage using the data collected from the Elastic Distributions of OpenTelemetry (EDOT). Resolve this issue using the Elastic AI Assistant as well as leverage runbook to prevent recurrence.
免费试用 Elastic Search 14 天,深入了解并测试这些功能。
探索类似演示

Observability
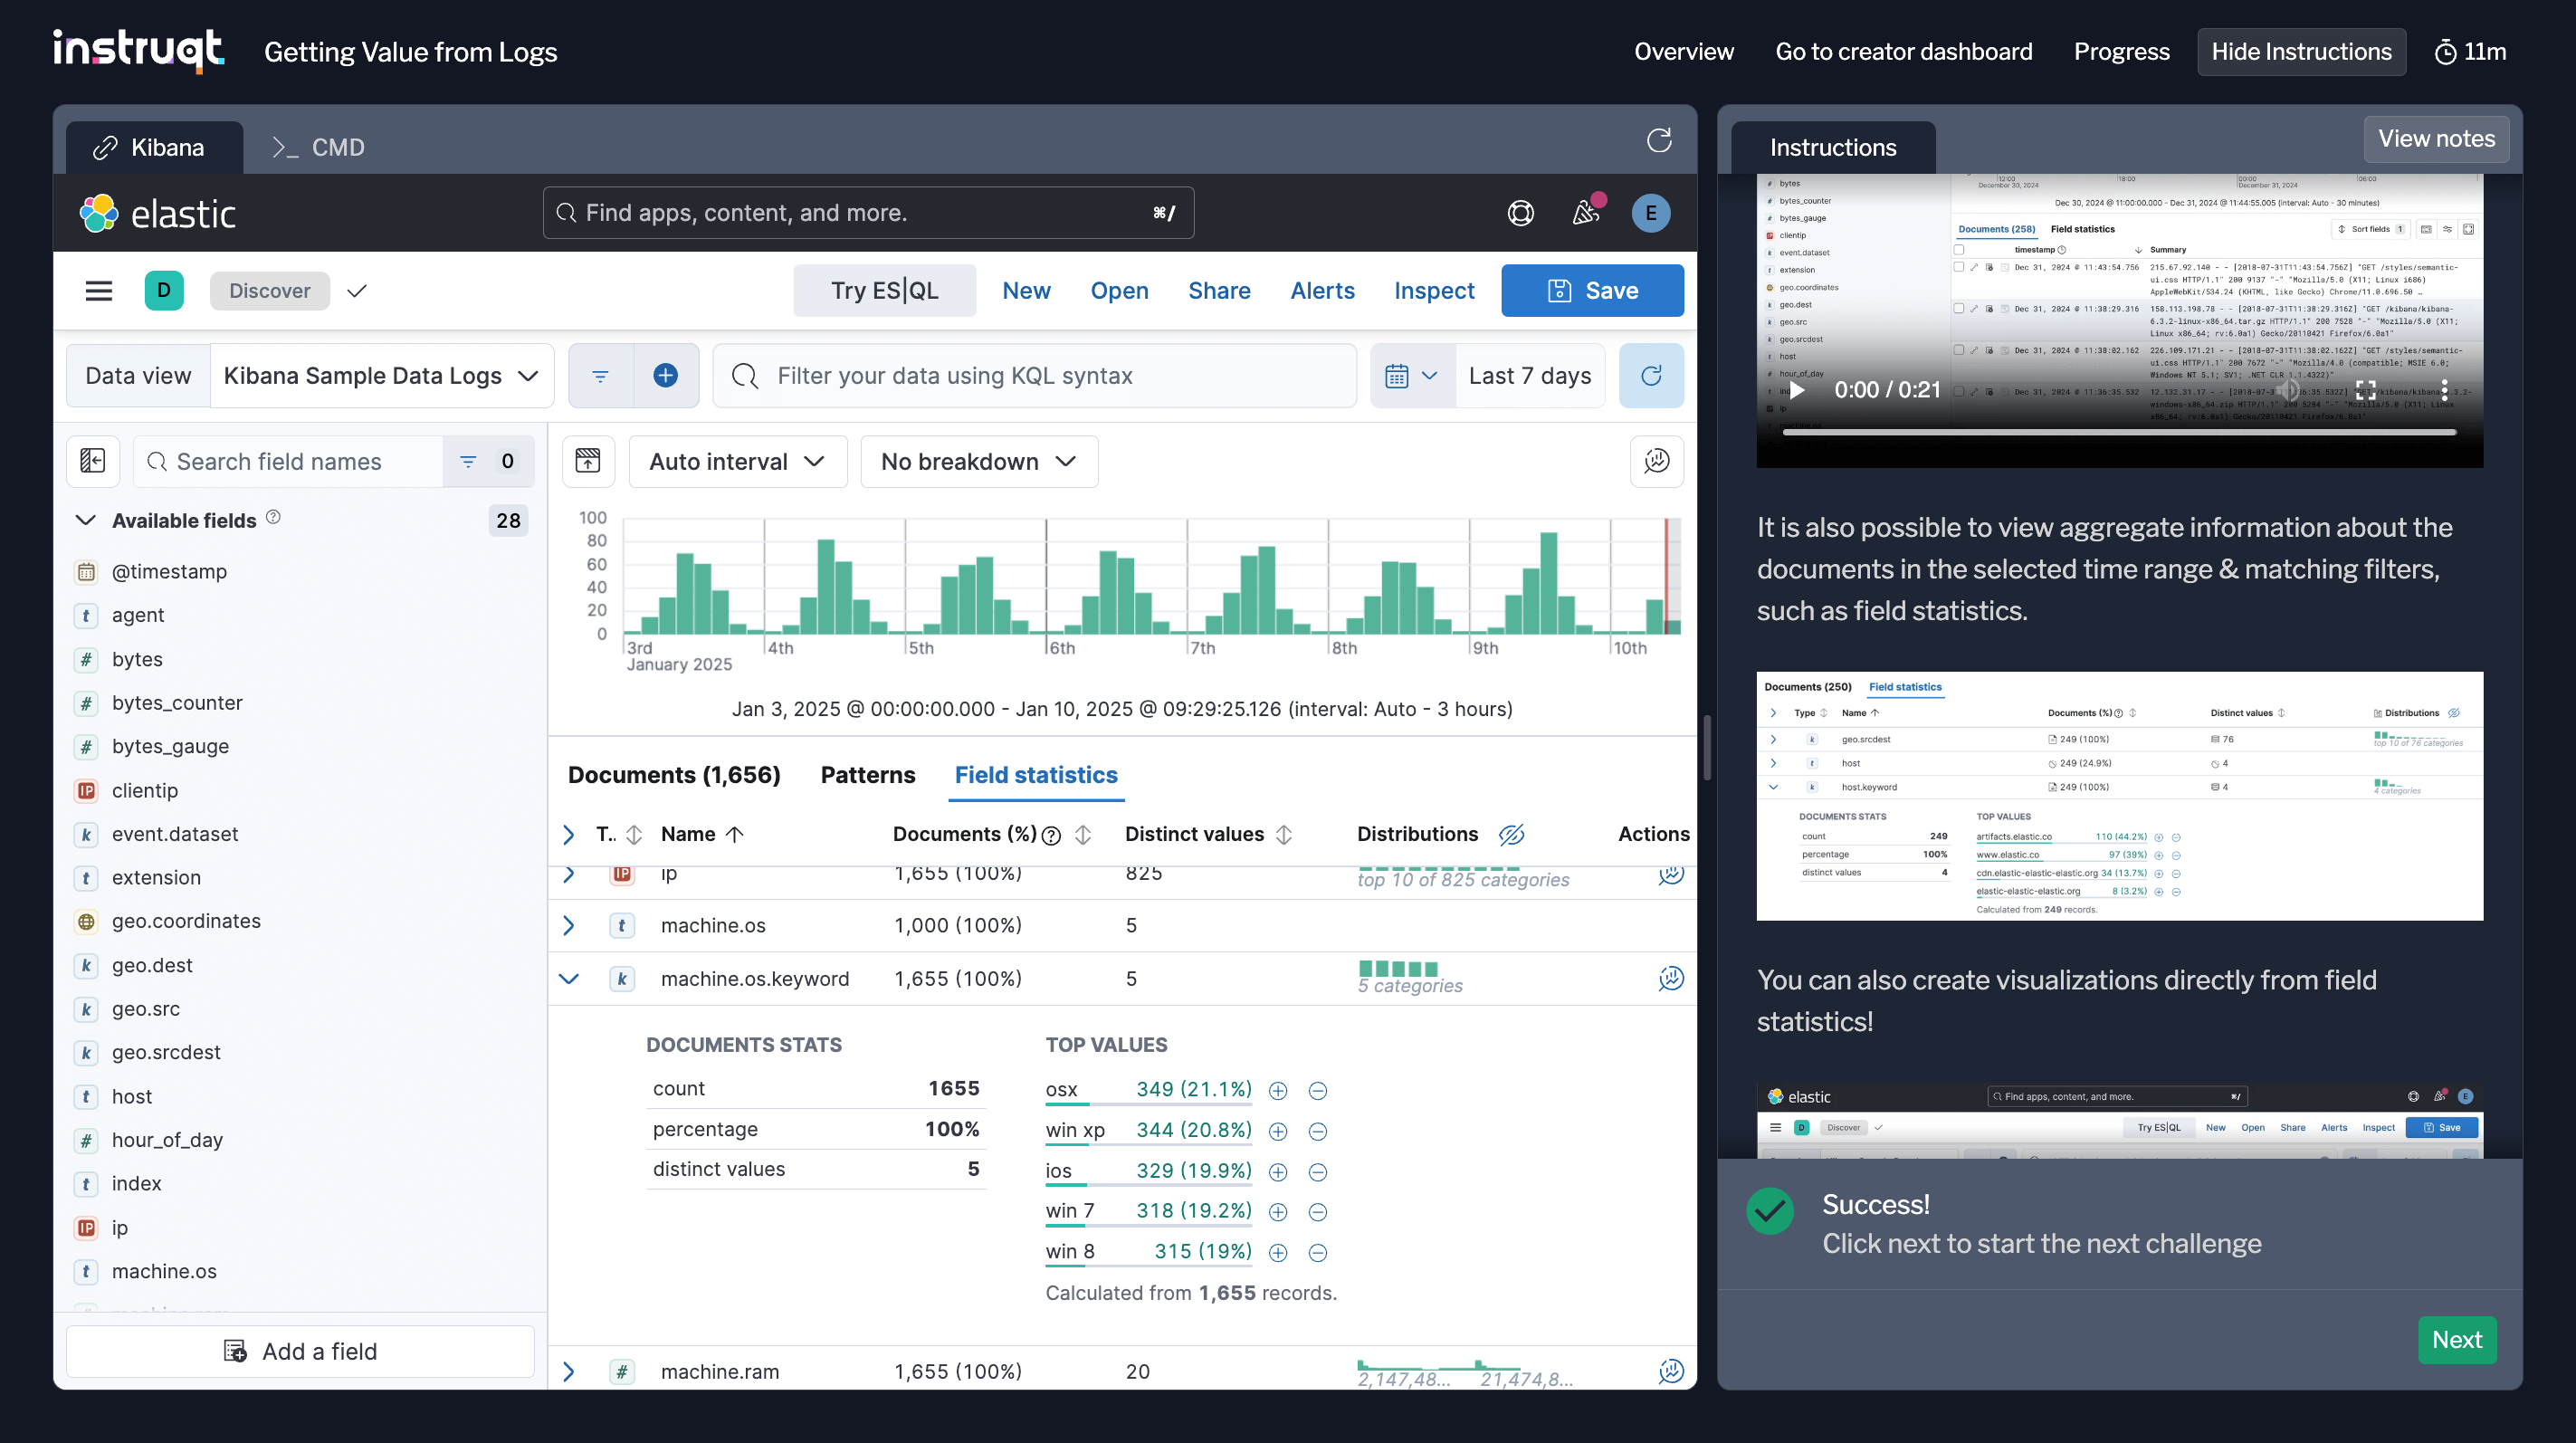
Getting value from logs
Observability 101: Lesson 1 of 4 — Learn the basics of logs and how to derive value by leveraging KQL and ES|QL, creating visualizations and anomaly detection jobs. By the end of this 15 minute Elastic Observability lab, you’ll be able to ask a question about your logs and return an answer.

Observability
使用 OpenTelemetry 摄取日志、指标和链路追踪数据
Observability 101:第 2 课(共 4 课):使用 Elastic Distribution for OpenTelemetry (EDOT) 接入日志、指标和链路追踪数据,开启 Elastic Observability 之旅。在这个 15 分钟的实操练习中,使用 OpenTelemetry (OTel) 采集器,让日志结构清晰、定义明确。
Observability
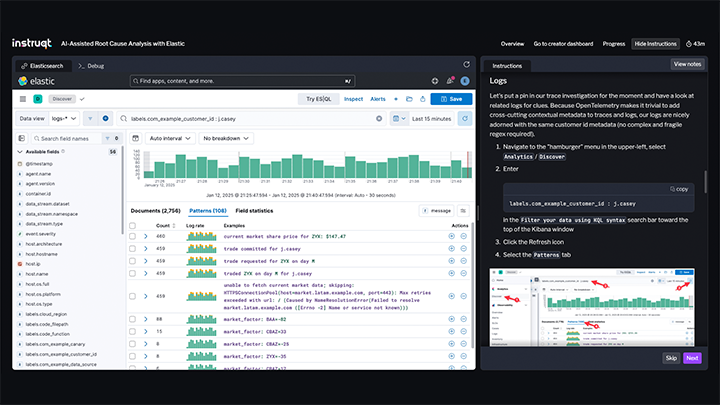
Root cause analysis with AI
Observability 101: Lesson 4 of 4 — Explore this 15 minute lab and use Elastic Observability's machine learning and AI technologies to perform Root Cause Analysis (RCA) of a customer-reported issue. Combine clues from traces and logs at scale with Elastic's AI Assistant to come to a faster resolution.