Introducing data visualization and modules in machine learning
Editor's Note (August 3, 2021): This post uses deprecated features. Please reference the map custom regions with reverse geocoding documentation for current instructions.
The release of Elasticsearch and X-Pack 6.1 introduced new features to make it easier for users to get started creating machine learning jobs. The features for data visualizer and machine learning modules are now available when selecting to create a new machine learning (ML) job.
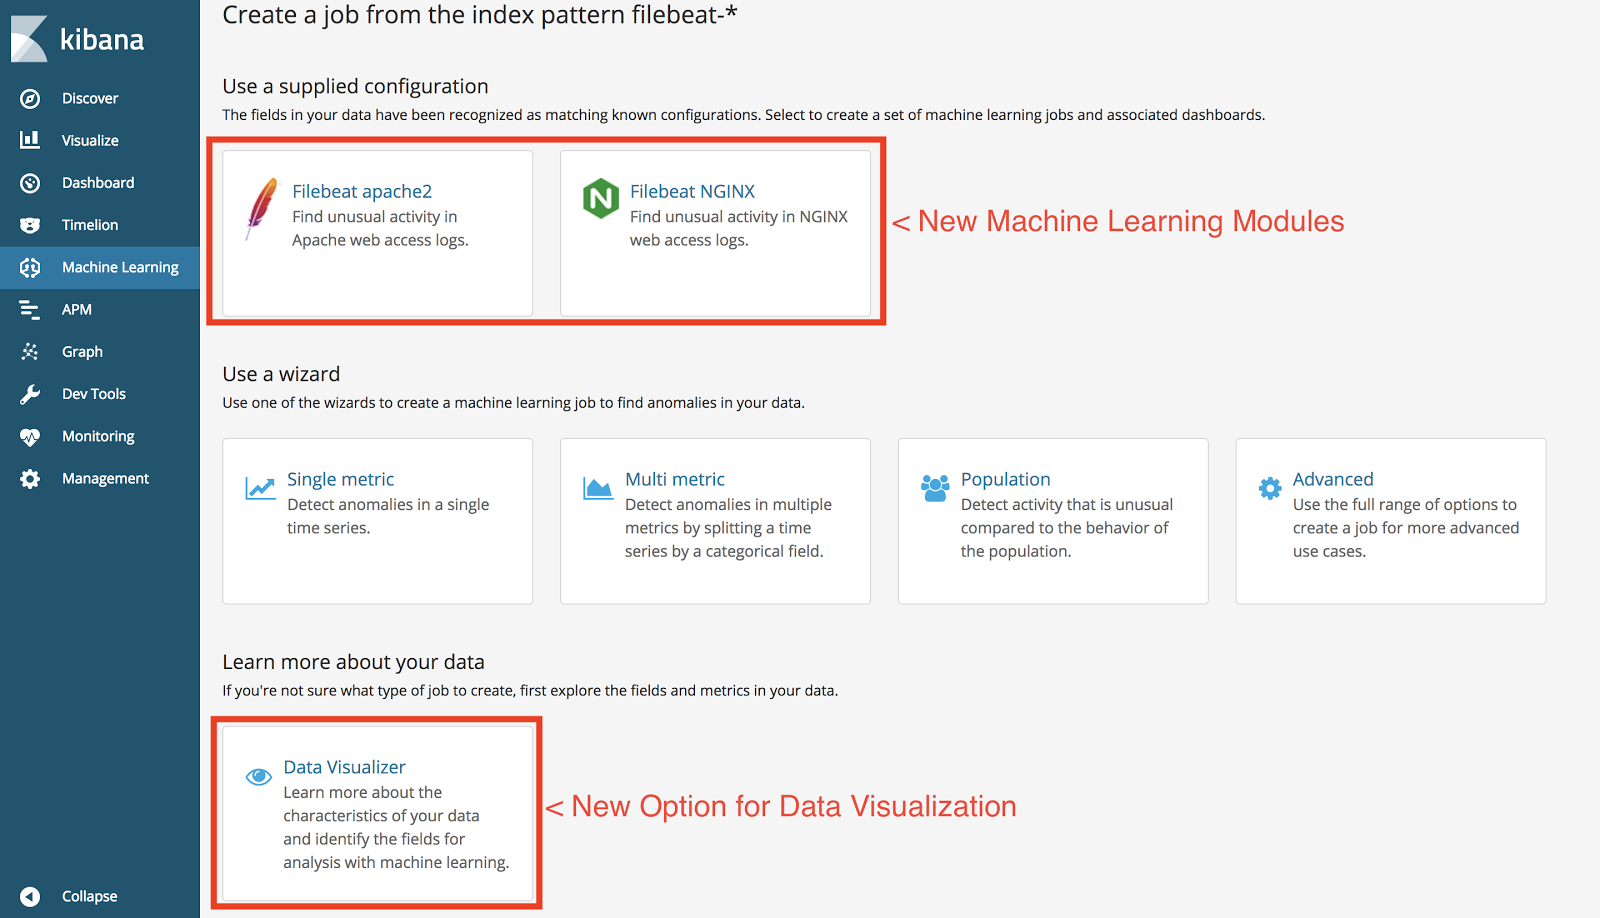
The data visualizer will allow users to view their indexes and get an understanding of the metrics and fields that are in their data. It provides a contextual view into the indexes to show which fields are getting used, how many documents contain those fields, and the number of unique values in the field.
Here is a walk through of the data visualizer from one of its creators:
The other new feature is ML modules. It provides a set of machine learning jobs, visualizations, and linked dashboards when the system identifies known field types. If indexes contain fields that are recognized by ML modules then there will be an additional button during the ML job creation step or within the data visualizer to automatically add a package for those fields that includes the ML jobs, visualizations, and linked dashboards.
Here is a walk through of the machine learning modules:
We're excited to add these features to make it easier to create more effective machine learning jobs. If you have feedback or questions on data visualizer or ML modules we invite you to join the conversation in the Discuss forums.
X-Pack machine learning capabilities come with an Elastic Platinum subscription, but you can try it out for free by downloading and installing X-Pack.