What is observability?
Observability definition
Observability pertains to how a system’s internal state can be understood by examining its external outputs, especially its data.
In the context of modern application development, observability refers to the collection and analysis of data — logs, metrics and traces — from a wide variety of sources, to provide detailed insight into the behavior of applications running in your environments. It can be applied to any system that you build and want to monitor.
Observability is crucial for today’s dynamic architectures and multi-cloud computing environments. It allows software engineers, IT, DevOps, and Site Reliability Engineering (SRE) teams to decode telemetry data. This is done with the help of visualizations — dashboards, service dependency maps, and distributed traces — as well as AIOps and machine learning approaches. With the right observability solution, you can understand how your applications, services, and infrastructure are performing to track and respond to issues.
Why is observability important — why do we need it?
Observability is important because it allows teams to evaluate, monitor, and improve the performance of distributed IT systems. It is far more effective than traditional monitoring methods. An end-to-end observability platform can help breach silos and foster collaboration. Issues can be proactively diagnosed, analyzed, and traced back to their origins.
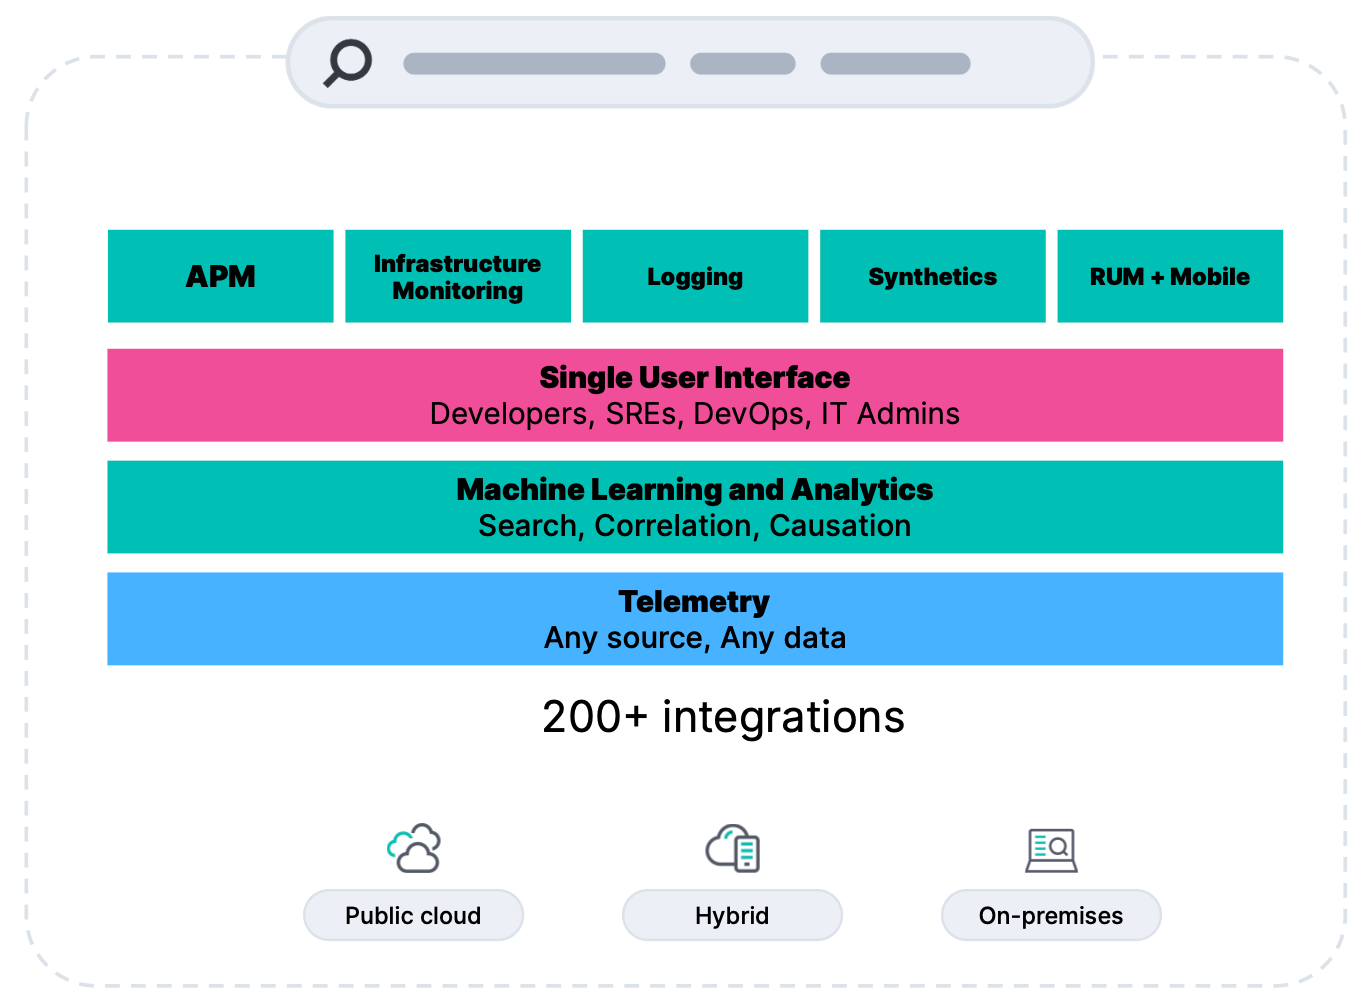
Observability gives IT organizations true visibility across the many data sources in cloud-native environments. The three pillars of observability are logs, metrics, and traces. Full-stack observability allows you to track the performance of your multi-cloud ecosystem in real-time and historically. You can synthesize data from endpoints and services generated by hardware, software, cloud infrastructure components, containers, open-source, microservices, and more.
Observability helps organizations:
- Discover and analyze the significance of performance incidents to their business
- Increase the efficiency of software development life cycles
- Accelerate problem resolution and root cause analysis
- Improve end-user experiences
- Fortify application security
Observability solutions are as essential to the IT operations of a business as they are to its bottom line. Observability leads to faster, higher-quality application delivery, which means cost savings and resource optimization for your teams. Better performing applications ultimately lead to more revenue.
Observability vs. APM vs. Monitoring
Learn more about the difference between observability, APM, and monitoring.
Monitoring
Monitoring is how teams observe and evaluate the state of their individual systems. It often uses predefined sets of metrics and logs to track errors and usage patterns. These can help answer simple questions about server utilization, response times, and throughput. Specialized monitoring tools can help reveal siloed issues that teams can anticipate. But issues are less predictable on more complex cloud-native applications where numerous dependencies are in play. Teams need a tool to help manage this level of complexity.
APM
Application Performance Monitoring (APM) — often considered a subset of observability — is a type of monitoring used to get in-depth insight into application code and dependencies. A key feature of APM is distributed tracing. This feature is used to track end-to-end transactions within applications. APM can help support and optimize application performance, identify bottlenecks, and enhance user experience.
Observability
Observability incorporates APM and traditional monitoring tools, but does not replace it. It offers a more comprehensive toolset built for today’s complex software systems that can reveal granular insights into the overall health and performance of your entire infrastructure.
Observability uses logs, traces, and metrics collected and aggregated across all the applications, microservices, servers, and databases in your environment. This helps teams identify root causes of issues by looking at data and dependencies across the entire IT ecosystem. By analyzing properties and patterns using statistical and machine learning approaches, it provides actionable insights into the unknown unknowns in a system.
How does observability work?
Observability works by continuously collecting performance data to create a complete, correlated record of every user request and transaction. The more observable your system, the more swiftly and accurately you can identify and trace a performance issue to its origins. Key concepts for observability include:
Log data
Logs offer timestamped records of application events. A large organization can produce billions of logs in a day!
Metrics
Metrics are time series data that measure application and system health and performance over time.
Distributed tracing
Distributed tracing provides an end-to-end code-level record of every user request through the entire distributed architecture.
Dependency mapping
Dependency maps show how applications, services, and infrastructure components are connected.
Anomaly detection
Anomaly detection uses baselining, statistical analysis, or machine learning to provide an early warning of abnormal behavior in a system.
An observability platform correlates huge amounts of telemetry data in real time, which provides DevOps, SRE, and IT teams with a complete contextual picture of any event or issue.
Learn how to develop a mature Observability practice for your organization.
What are the observability use cases?
Observability tools allow teams to process massive amounts of data without tedious manual efforts or inefficient systems. Observability platforms solve issues and determine root causes before they impact customer experience and revenue. Its potential use cases vary depending on the area of the organization, from development and IT operations to the C suite.
Monitor and respond to system performance
Debugging and application performance are primary use cases for observability. It can help you answer questions about the health of your services and systems overall. Observability in DevOps can monitor the average response time for a given operation and discover what’s causing certain users to experience longer load times. It can also inform you what services need tuning or how a change might have created latency or impacted application performance. It also gives you reports on the fundamentals of your user experience and how your SLOs are measuring up.
Increase business performance and improve productivity
Connecting business and operational data can greatly improve business performance.
Enable digital and cloud transformation
As companies move to application modernization and cloud infrastructure, observability gives them a birds-eye view of all the moving parts. Keeping systems up-and-running during migration is complex. Full-stack observability is necessary to ensure your systems run reliably during and after the cloud migration process.
Microservice architectures add even more complexity. Because they are independently deployable across different hosts, they help make applications more scalable and easier to maintain. But, it’s crucial to keep track of updates, errors, and failures in a microservice architecture. Observability can give you full visibility into dependencies in a dynamic system. For example:
- Food for thought
AH Tech adopted an observability platform for the Ahold Delhaize food group. It lets them track individual items through every stage of the order fulfillment chain. They are able to observe real-time data for their entire process, down to the price of a unit across 13,000 points of sale. IT teams now have insight into issues before individual stores can report them. - Incredible views
The rapid growth of the French travel site Oui.sncf led to multiple silos that impeded their user experience, threatening revenue. Observability was the solution. Once they adopted an observability platform, departments were able to connect all operational data. Ticket revenue, time to purchase, and abandoned carts were able to be analyzed by region. Dashboard capabilities made troubleshooting easier, allowing teams to respond to events in real time, reducing incident resolution from hours to minutes.
What are the benefits of observability?
Observability is beneficial in helping solve business and operational challenges for IT teams, DevOps, SREs, and organizations as a whole. Here’s what the right observability solution offers:
Performance monitoring that leads to speedy resolutions
Observability discovers conditions you might never think to look for. This allows you to identify the root causes of specific application performance issues across vastly distributed systems. Built-in machine learning can automatically correlate anomalies to downstream data and dependencies, delivering actionable results.
Complete and instant visibility
See clearly across cloud-native and hybrid environments, including Kubernetes. Metrics, logs, and traces are easily ingested from applications and infrastructure. All your data is unified and visualized in one place.
The elimination of tool silos
Observability allows you to consolidate multiple tools and collect telemetry data holistically.
A better user experience
Proactively catch issues before users do. Confirm the health of hosts, services, and APIs, and track performance and availability across all regions and devices with metrics page loads, requests, and latency. Connect operational and business key performance indicators.
What are the challenges of observability?
Observability challenges are tied to the explosion of complex architectures. Without the right observability solution, the sheer volume, speed, and variety of raw data can make extracting answers difficult and drive up costs. This is especially true with cloud platforms like AWS, Azure, and GCP, and cloud-native technologies such as Kubernetes and containers.
Organizations that don’t adopt effective observability strategies also face challenges with end-to-end distributed tracing. Dynamic architectures require real-time visibility into workloads running within containers. It is not feasible for teams to manually stitch together information from multiple dashboards.
Migrating infrastructure and adding more clouds can create hurdles. Noisy data, fractured monitoring strategies, and tool sprawl are potential roadblocks. And with siloed teams, signals and takeaways can get lost.
Developing a culture of observability across an organization can be a challenge in itself. For many in IT and development, making the business case for observability to those who may not fully understand its impact is tricky. The short-term costs and sacrifices of implementing a comprehensive observability plan — compared to the long-term savings and increased efficiency — are sometimes only obvious to engineers.
One great way to start is by explaining that observability can deliver major performance improvements and cost savings across the board.
Key features of observability tools
Key features of an observability platform include real-time insights and multi-signal data aggregation with interactive visualization. Of course, the right observability tool should be easy to use and implement. At a minimum, it should deliver visibility across hybrid and multi-cloud software systems, improve troubleshooting, offer better analytics, and increase operational efficiency.
Having a single stack to unify your logs, metrics, data, traces, and synthetics can help break down data silos. Teams can easily ingest telemetry data into an open and scalable platform. Plus, a contextual data model delivers the flexibility to collect, store, and visualize any data from any source.
The right observability tool will also allow you to search, monitor, and apply analytics to events as they happen. You can analyze logs for a specific transaction, monitor the performance metrics for the host or container that it ran in, trace the transaction, check the overall service availability, and more.
Observability with Elastic
Built on the Elastic Stack, Elastic Observability helps organizations correlate unlimited telemetry data using the power of search to turn data into results. In a single, unified experience, Elastic Observability provides visibility into cloud environments like AWS, Microsoft Azure, and Google Cloud, with integrations built for seamless data ingestion.
Elastic Observability has been shown to deliver businesses 10x performance with 75% cost savings. To find out if Elastic Observability can work for you and your organization, see it in action by launching a sandbox demo or simply start a free trial.
Observability resources
- [Blog] Three Pillars of Observability
- The Forrester Total Economic Impact of Elastic Observability
- Elastic Observability technical guide
- [Ebook] How to Build Better Applications at Scale
- [Webinar] Cloud trends and how observability enables hybrid cloud and operational efficiency
- Explore Elastic's detailed roadmap for developing a mature Observability practice in your organization