Fix repeated snapshot policy failures
Repeated snapshot failures are usually an indicator of a problem with your deployment. Continuous failures of automated snapshots can leave a deployment without recovery options in cases of data loss or outages.
AutoOps is a monitoring tool that simplifies cluster management through performance recommendations, resource utilization visibility, and real-time issue detection with resolution paths. Learn more about AutoOps.
Elasticsearch keeps track of the number of repeated failures when executing automated snapshots with snapshot lifecycle management (SLM) policies. If an automated snapshot fails too many times without a successful execution, the health API reports a warning. The number of repeated failures before reporting a warning is controlled by the slm.health.failed_snapshot_warn_threshold setting.
If an automated SLM policy execution is experiencing repeated failures, follow these steps to get more information about the problem:
In Kibana, you can view all configured SLM policies and review their status and execution history. If the UI does not provide sufficient details about the failure, use the Console to retrieve the snapshot policy information with the Elasticsearch API.
Go to Snapshot and Restore > Policies to see the list of configured policies. You can find the Snapshot and Restore management page using the navigation menu or the global search field.
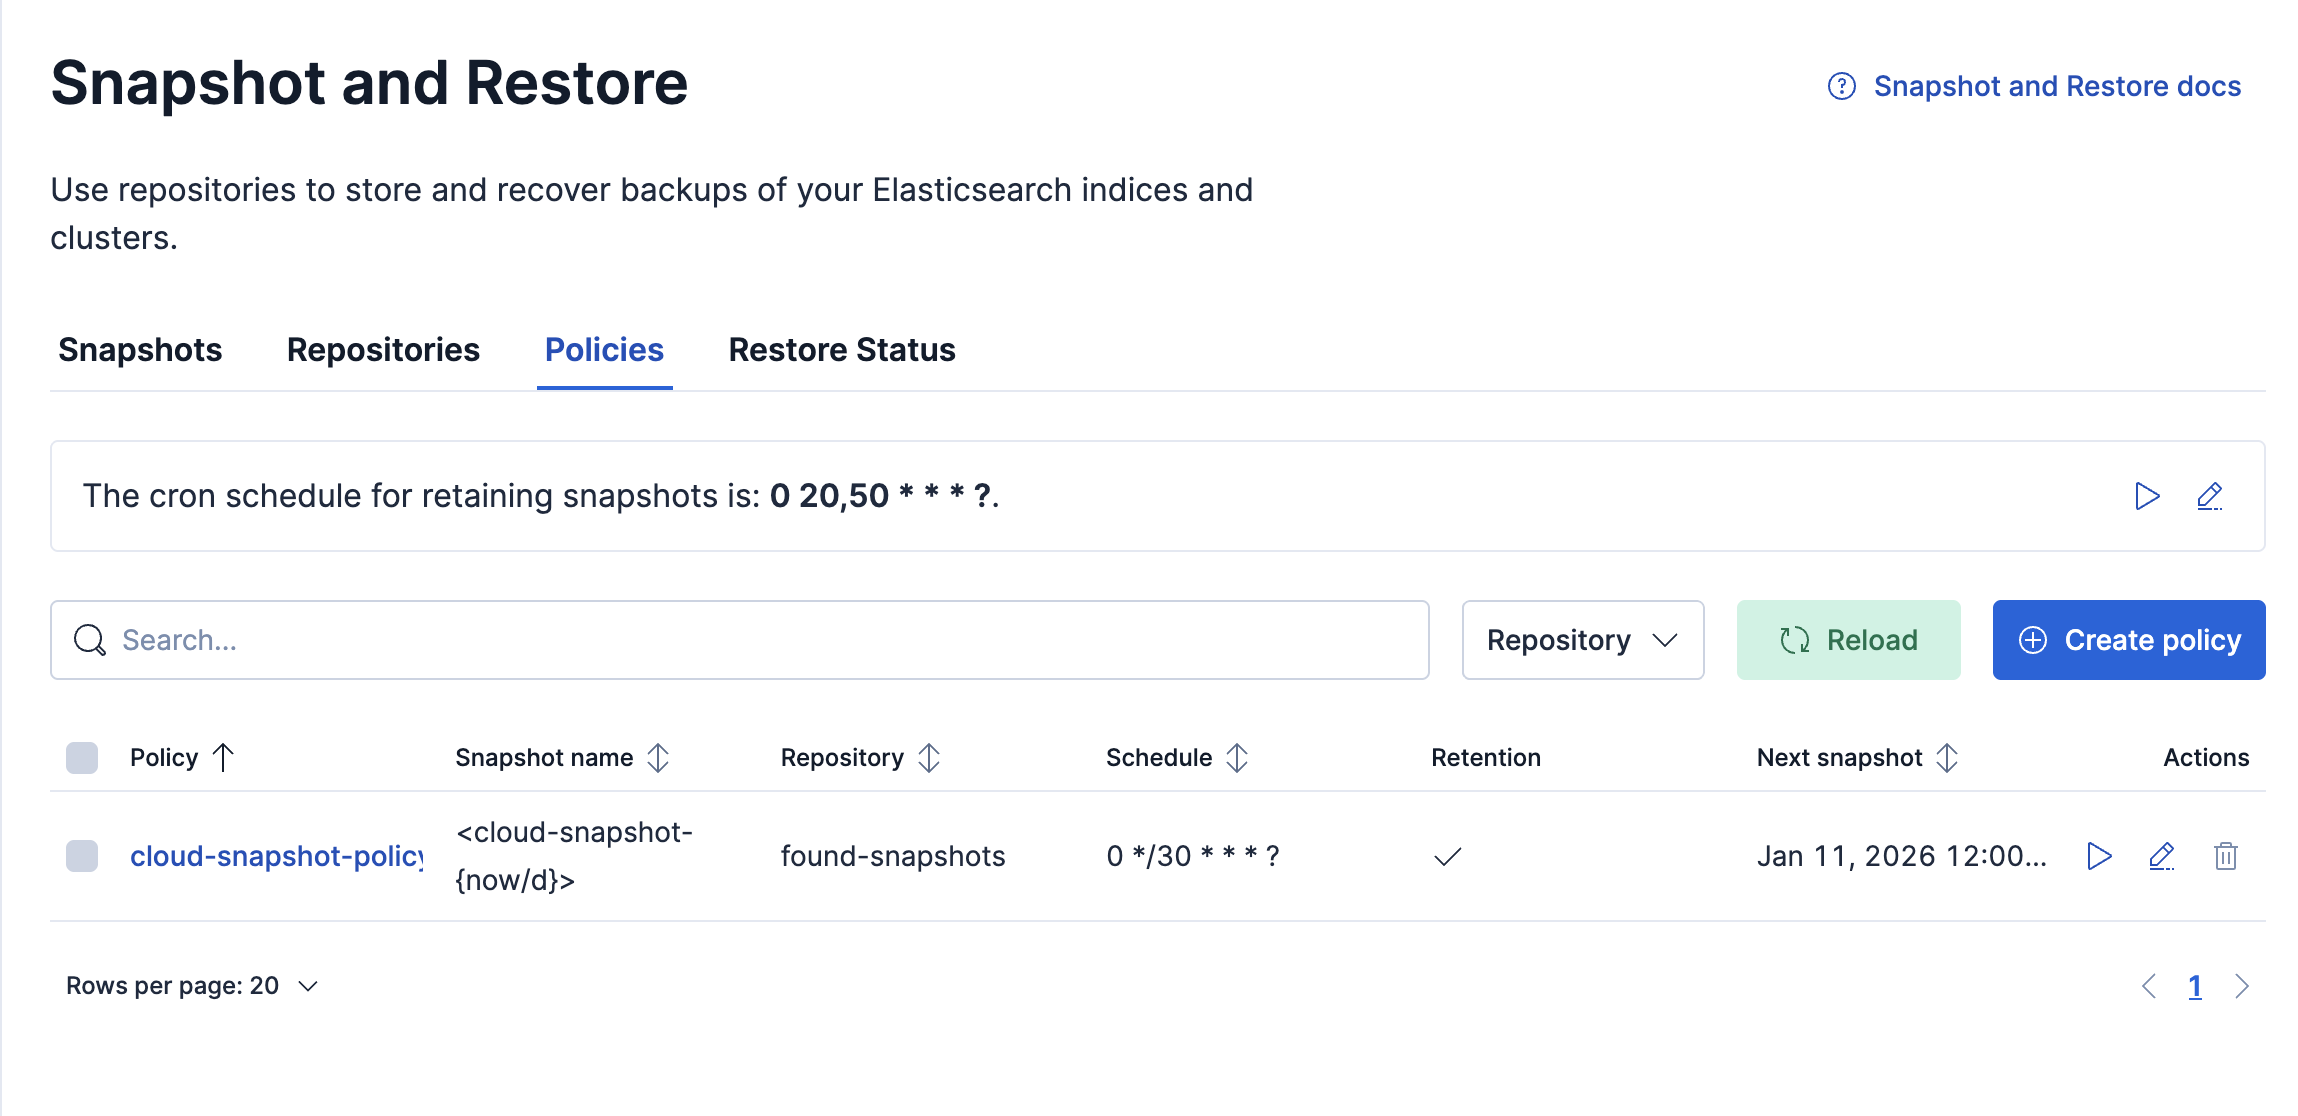
The policies table lists all configured policies. Click on any of the policies to review the details and execution history.
To get more detailed information about the failure, open Kibana Dev Tools > Console. You can find the Console using the navigation menu or the global search field.
Once the Console is open, execute the steps described in the Using the Elasticsearch API tab to retrieve the affected SLM policy information.
The following step can be run using either Kibana console or direct Elasticsearch API calls.
Retrieve the affected SLM policy:
GET _slm/policy/<affected-policy-name>
The response looks like this:
{
  "affected-policy-name": {
    "version": 1,
    "modified_date": "2099-05-06T01:30:00.000Z",
    "modified_date_millis": 4081757400000,
    "policy" : {
      "schedule": "0 30 1 * * ?",
      "name": "<daily-snap-{now/d}>",
      "repository": "my_repository",
      "config": {
        "indices": ["data-*", "important"],
        "ignore_unavailable": false,
        "include_global_state": false
      },
      "retention": {
        "expire_after": "30d",
        "min_count": 5,
        "max_count": 50
      }
    },
    "last_success" : {
      "snapshot_name" : "daily-snap-2099.05.30-tme_ivjqswgkpryvnao2lg",
      "start_time" : 4083782400000,
      "time" : 4083782400000
    },
    "last_failure" : {
      "snapshot_name" : "daily-snap-2099.06.16-ywe-kgh5rfqfrpnchvsujq",
      "time" : 4085251200000,
      "details" : """{"type":"snapshot_exception","reason":"[daily-snap-2099.06.16-ywe-kgh5rfqfrpnchvsujq] failed to create snapshot successfully, 5 out of 149 total shards failed"}"""
    },
    "stats": {
      "policy": "daily-snapshots",
      "snapshots_taken": 0,
      "snapshots_failed": 0,
      "snapshots_deleted": 0,
      "snapshot_deletion_failures": 0
    },
    "next_execution": "2099-06-17T01:30:00.000Z",
    "next_execution_millis": 4085343000000
  }
}
- The affected snapshot lifecycle policy.
- The information about the last failure for the policy.
- The time when the failure occurred in millis. Use the
human=truerequest parameter to see a formatted timestamp. - Error details containing the reason for the snapshot failure.
Snapshots can fail for a variety of reasons. If the failures are due to configuration errors, consult the documentation for the repository type that the snapshot policy is using. Refer to the guide on managing repositories in ECE if you are using an Elastic Cloud Enterprise deployment.
One common failure scenario is repository corruption. This occurs most often when multiple instances of Elasticsearch write to the same repository location. There is a separate troubleshooting guide to fix this problem.
If snapshots are failing for other reasons check the logs on the elected master node during the snapshot execution period for more information.