Unifying security monitoring with Elastic Security and Microsoft Sentinel
.jpg)

 Share on Twitter
Share on Twitter

 Share on LinkedIn
Share on LinkedIn

 Share on Facebook
Share on Facebook

 Share by Email
Share by Email

 Print this page
Print
Working across the security ecosystem
At Elastic, we have always had one mission: to bring the best search and analytics capabilities to wherever our users are. This principle is built into all three of Elastic’s solutions, including Elastic Security. The AI-driven security analytics solution is built to be open, transparent, and available to users of all kinds.
Microsoft Sentinel is a widely adopted security information and event management (SIEM) solution, including with Elastic users. As an Azure based SaaS product, it integrates seamlessly into other Microsoft products and beyond.
Elastic has complementary strengths that can bring a lot of value to security teams that use Microsoft Sentinel. Let’s dive into a few of the main ones.
Multi-cloud and hybrid monitoring
Many modern organizations have a diverse IT estate, often including a mixture of on-prem, Azure, and accounts in other cloud providers. It is important for security teams to have visibility into their entire estate. To achieve this with Microsoft Sentinel, you would need to not only build all of the customized log parsing, but also ship all of the log data to Azure and write matching rules.
Because Elastic can be run anywhere, Elastic Cloud is available in AWS, GCP, and Azure, including through the Marketplaces of all three providers. Elastic can also be run on-premises either directly on hosts or on Kubernetes using our ECK operator. Elastic comes out of the box with integrations to collect data from Windows, Linux, macOS, AWS sources such as AWS CloudTrail, and GCP sources such as GCP Audit Logs. These integrations allow for collecting, parsing, and visualizing the data, as well as Elastic Security’s powerful detection rulesets. Elastic also provides extensive endpoint protection for Windows, Linux, and macOS (as well as Windows), which can either act as the primary endpoint or a complement to a tool like Defender where required.
Once all of this data is collected from your infrastructure, you can choose to either stream it to a central cluster or use multiple clusters and harness the power of cross-cluster search to query the data where it lives and when you need it.
These capabilities provide insight into your entire estate using out of the box tools independent of where that infrastructure exists — whether on AWS, Azure, GCP, or on-premises, you can have the same visibility and protection across any infrastructure.
Third-party and custom applications monitoring
Elastic is built for versatility, it seamlessly integrates with not just Microsoft data sources but also a vast array of third-party and custom applications. Whether your environment includes cloud-native apps, legacy enterprise systems, or on-premise services, Elastic has the integrations to collect and analyse that data.
Out-of-the-box integrations exist for everything from Apache logs to Oracle, allowing security teams to gain visibility into areas that Microsoft Sentinel might not natively cover. With Elastic Security, your security operations aren’t limited to a Microsoft-centric view, you get complete coverage across all your systems and applications.
Using observability data for cybersecurity
Which IT data sources in your organization aren’t useful for security? … I can’t think of any either. Cyber threats don’t just hide in security logs; they lurk in application performance data, infrastructure metrics, and network telemetry. With Elastic’s observability tools, you can bring these observability data signals into your security analysis, creating a more holistic defence strategy while also providing valuable insights for your developers and SREs.
For example, a sudden spike in database query latency could be an indicator of a ransomware attack encrypting data. Unusual CPU load patterns might suggest cryptomining malware running on a cloud instance. By feeding observability data into Elastic Security, you can enrich Microsoft Sentinel’s alerts with deeper context, enabling faster and more accurate investigations.
Managing high-volume data sources
Modern security teams need to process massive amounts of data, often in real time. While Microsoft Sentinel is great at handling Azure-centric sources, Elastic is designed to ingest and process high-volume data regardless of and across hybrid environments.
Elastic’s architecture allows for horizontal scaling, meaning that whether you’re dealing with millions or billions of logs per day, performance won’t be a bottleneck. Additionally, Elastic provides powerful filtering and aggregation features that help security teams focus on what truly matters, reducing alert fatigue and making threat detection more efficient.
Built-in machine learning tuned for cybersecurity
Elastic’s built-in machine learning (ML) and AI capabilities are purpose-built for security use cases. Unlike generic ML platforms, Elastic’s security-focused ML jobs come prebuilt for anomaly detection in security datasets, helping teams detect threats like:
Unusual network traffic patterns
Unusual hour for user activity
These models work out of the box and against Elastic Common Schema (ECS), which means that they apply independently of the source of that data. For example, all supported firewall logs are normalised to ECS which means the ML models will work independently of the firewall used.
Elastic Security also provides access to their powerful AI Assistant for Security, which can leverage multiple large language models (LLMs) including Azure OpenAI to help guide and empower security analysts directly inside of Elastic’s SIEM. AI Assistant can:
Group related alerts into coherent attack chains
Help analysts build advanced queries quickly
Assist with the triage of alerts
Automatically create rich case summaries
Automatically search your team’s knowledge base as part of the chat
Managing costs for retention
One of the challenges of security data management is balancing retention needs with cost. Microsoft Sentinel provides powerful SIEM capabilities, but long-term data retention can become expensive without losing capability, particularly when dealing with high-ingestion workloads.
Elastic offers multiple features to optimise cost efficiency without sacrificing visibility:
Index lifecycle management (ILM): Automatically move data through different storage tiers based on age and relevance, reducing storage costs per data source.
Cold and frozen tiers using searchable snapshots: Keep historical security data in lower-cost object storage while still being able to query it on demand in the same way and with the same capability as new data.
By offloading long-term security log retention to Elastic, Microsoft Sentinel users can maintain compliance and historical analysis without breaking the budget.
What would pairing Elastic and Sentinel look like?
Let’s put ourselves in the shoes of a SOC analyst working in Microsoft Sentinel to see what the workflow might look like. Your organization has invested in Azure and Sentinel, but you still have a significant estate on-prem and an AWS estate. To provide your analysts with a single pane of glass, you have local Elastic clusters that use cross-cluster search and all alerts go to your Microsoft Sentinel instance.
You log in to Sentinel and review your open alerts. You have been seeing multiple native Sentinel alerts over the last few weeks around failed logins, mostly related to the engineering organization. Your InfoSec team never found any compromise, and the organization has been reminded about multifactor authentication (MFA) and other security best practices. Suddenly, you see two alerts that have been generated by Elastic Security. The first alert states there has been a spike in outbound traffic from an application running in AWS triggered from anomaly detection on VPC Flow Logs. The next alert flags a new dependency discovered in the APM data from the same application.
You pivot into Elastic using a link from the Microsoft Sentinel alert and see that the alerts are linked to a key in-house application that you provide as a service to your external users. Looking through the APM data for the application, you find that there was a recent release of the application and the dependency seems to have been introduced by that release. You ask Elastic AI Assistant for Security about this alert, and it reveals encrypted information in the subdomain. This looks incredibly suspicious.
Through Elastic Observability’s continuous integration/continuous deployment (CI/CD) monitoring, you can see who triggered the release, so you reach out to them. They don’t know anything about a release. It looks like their credentials have been used to inject malicious code into the application, which sends user data to this new dependency. You immediately open an incident in Microsoft Sentinel and start remediation steps. You reset the credentials of the connected account, work with the AWS team to block the network traffic, and work with the developers to roll back the software to the previous version.
In modern security, all data is security data. By combining Elastic’s breadth and advanced analytics with Microsoft Sentinel, you can span your organization's complex IT landscape and correlate data from any source while providing a single pane of glass in either Sentinel or Elastic Security.
Working together in your environment
Enough of the theory — let’s get straight into the details of how you can get Elastic Security and Microsoft Sentinel working together in your environment.
The workflow possibilities are unlimited, so for now we’ll run through a few simple examples that show information flowing in both directions, from Elastic Security to Microsoft Sentinel and vice versa. In a future post, we’ll build on this foundation with more advanced workflows.
For now, we will use Azure Logic Apps to help build our examples. There are many alternative approaches, but we chose Logic Apps as we expect organizations using Microsoft Sentinel to either be actively using Logic Apps already or have access through Azure without the need to install or manage another tool.
Standing up Elastic
There are many ways of standing up your Elastic cluster, from completely self-built on VMs or using Elastic Cloud for Kubernetes, but the easiest option is to run on Elastic Cloud. Given we are talking about Microsoft Sentinel, let’s go over the easiest way to get set up in Azure, which is using Elastic Cloud through the Azure Marketplace.
Within a few clicks, you can deploy your own Elastic cluster and be up and running. Your dedicated cluster will be created in Elastic Cloud and linked to your Azure accounts for integrated billing, authentication, and native log routing.
For more information on creating an Elastic cluster through the Azure Marketplace, check out How to deploy and manage Elastic on Microsoft Azure..
Scenario 1: Synchronizing Elastic Security cases with Microsoft Sentinel incidents
In this first scenario, we’re expecting an initial review of alerts to be completed in Elastic Security. Once the need for a case has been identified, a matching incident will be created in Microsoft Sentinel. This workflow works well if there are local analysts that are required to make sense of alerts, such as administrators of an on-premises estate or an AWS environment. For example AWS Cloudtrail alerts being triaged by the AWS admins.
While Elastic has comprehensive case management features as part of its SIEM solution, it’s not unusual for our customers to have a different system already in place. We offer a selection of native connectors for common incident management tools such as ServiceNow (ITSM, SecOps, and ITOM), Jira, and IBM Resilient, as well as SOAR and security automation platforms like Swimlane, Torq, and (our personal favorite) Tines.
There is no direct connector for Microsoft Sentinel; instead, we will use a general-purpose Webhook connector, which can send requests to any service exposing a RESTful API. This actually can have some advantages as it can be easily customized to add workflow steps depending on your team’s requirements.
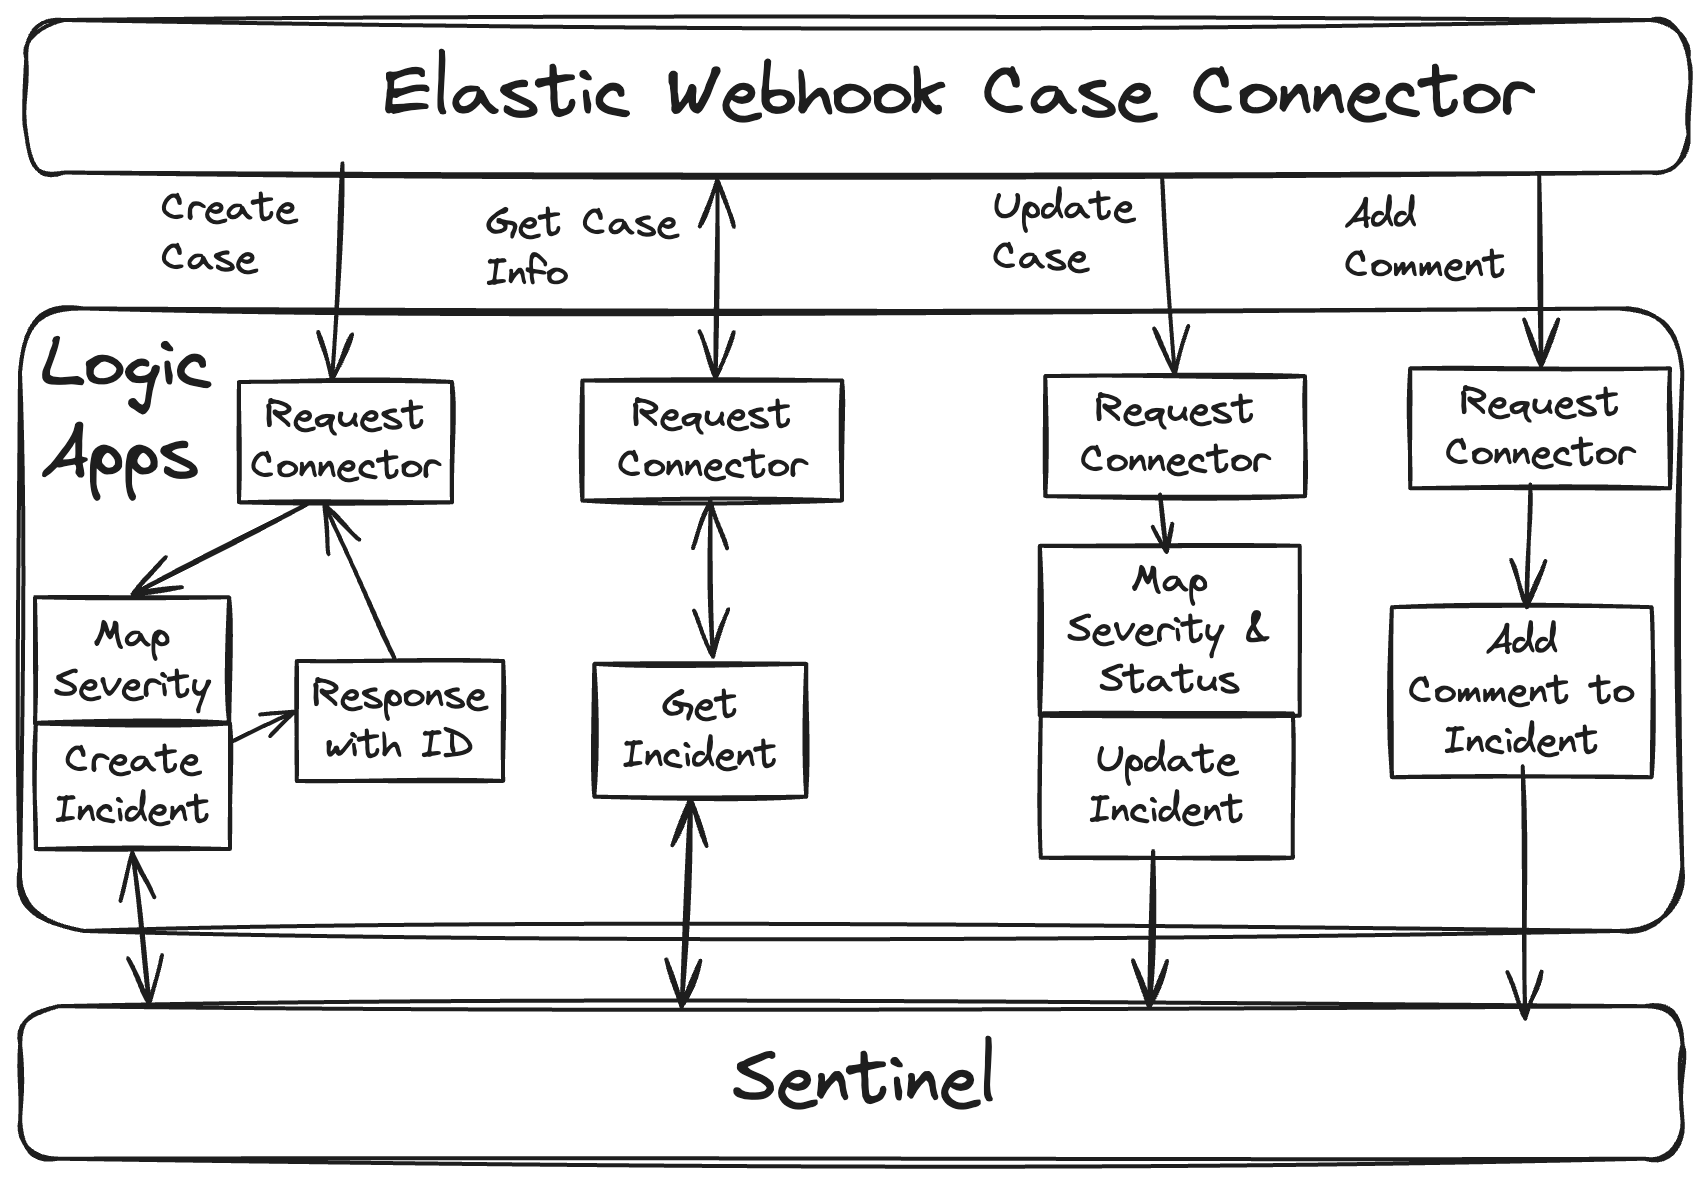
The connector configuration requires us to provide endpoints for the four actions that the connector can take. In Microsoft Sentinel, we’ll use Logic Apps to handle and take these actions:
Case creation
Receiving information
Updating the status
Adding comments
Microsoft Sentinel has its own REST API, but by using Logic Apps, we’re able to remove a lot of complexity around authentication and we can smooth out certain differences in terminology. For example, Elastic Security cases and Microsoft Sentinel incidents use different names for their severity levels and status indicators. Our Logic App will help to translate these between the systems.
A logical workflow is outlined in the diagram below:
Part 1: Create Azure Logic Apps
Although it’s not complicated to build the Logic Apps, we will provide an Azure Resource Manager (ARM) template that can speed up the process.
1. Download the template here, which includes:
An API connector for Microsoft Sentinel
An Azure Logic Apps workflow to create, update, and add comments to an incident
An Azure Logic Apps workflow that gets the details of an incident (this separates modifications and reads.)
2. Search in the Azure console for “Deploy a custom template.”
3. Click Build your own template in the editor. Upload the template file you downloaded.
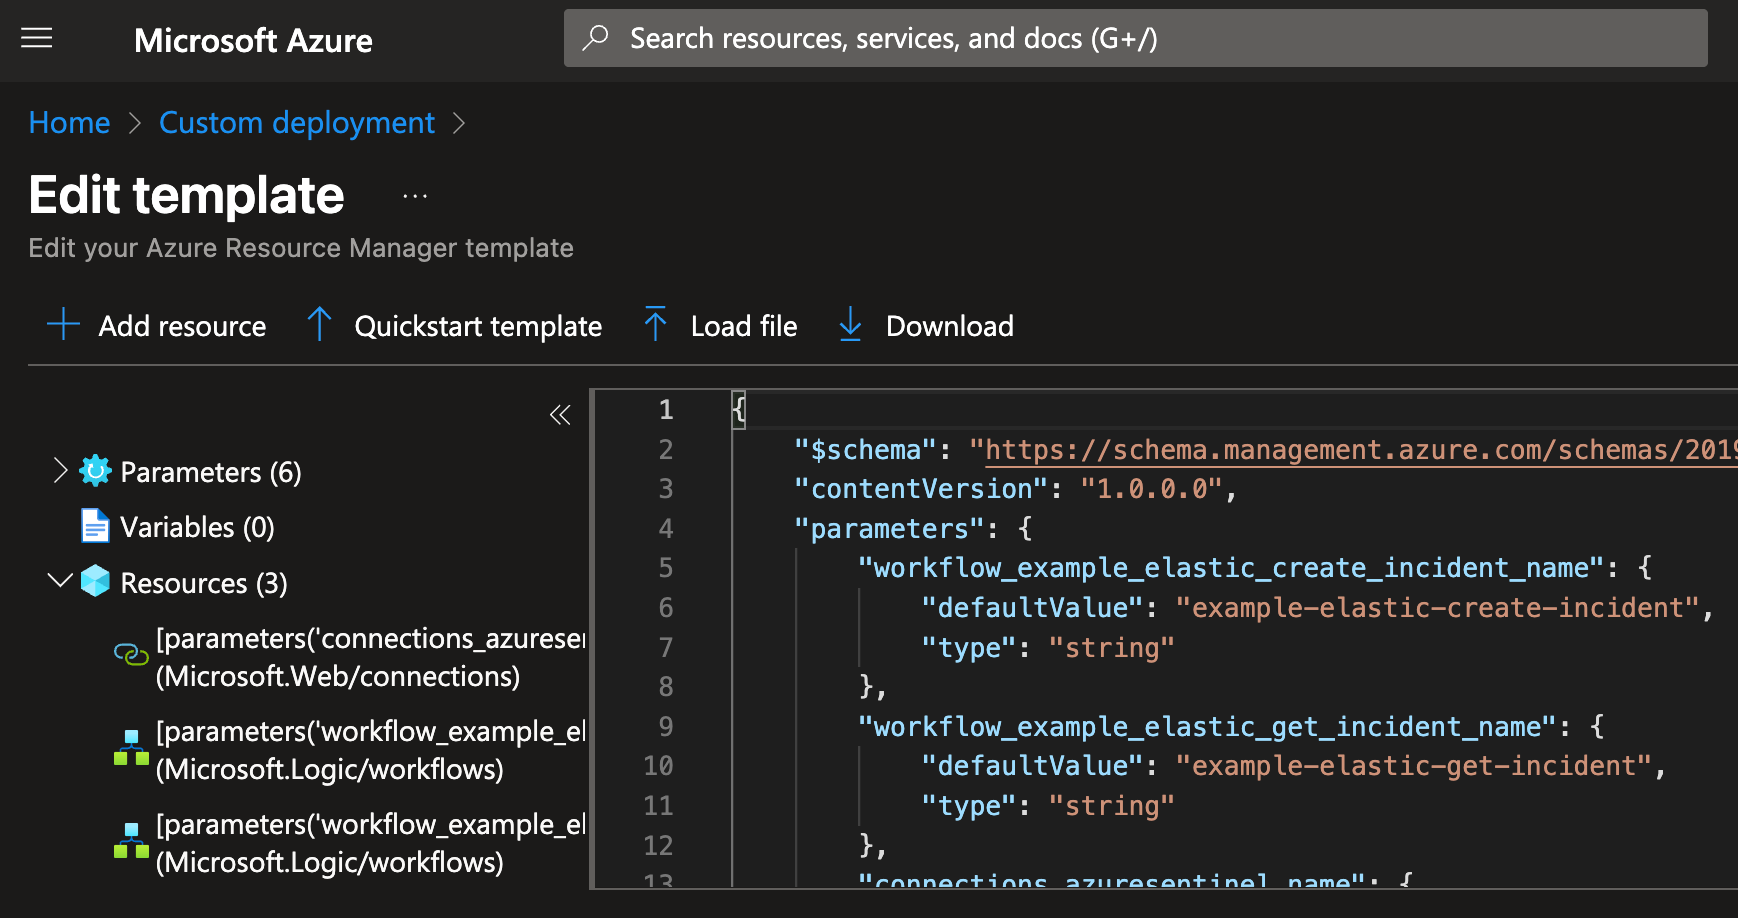
4. Click Save.
5. Fill out the details for the template:
Subscription and resource group for the Logic Apps
Names for your workflows and your API Connector to Sentinel
The name of your Sentinel Workspace
The Resource Group of your Sentinel Workspace
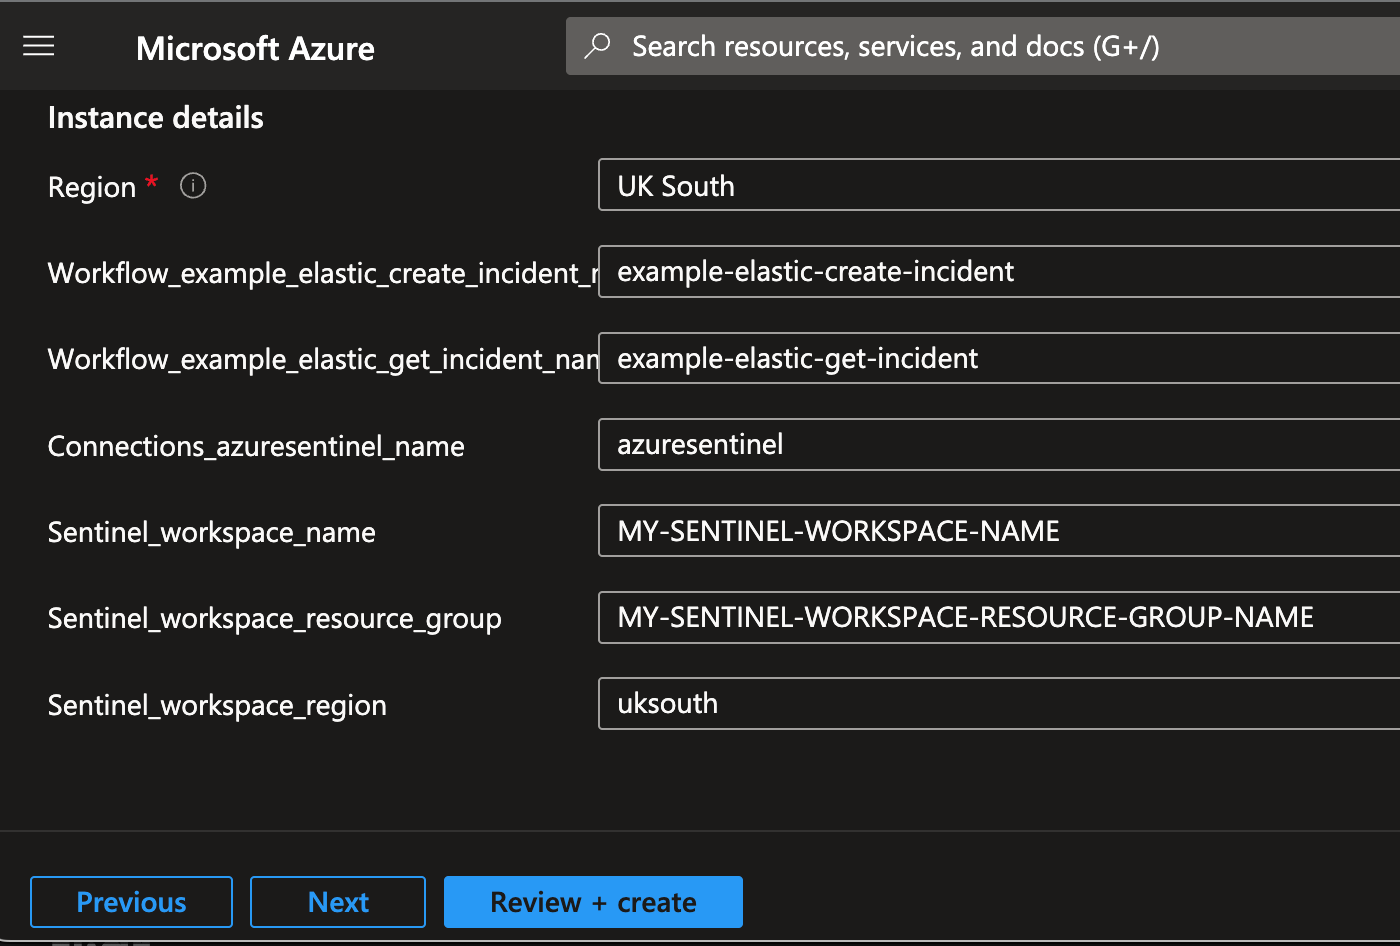
6. Click Review and create.
7. Click Create.
8. After your deployment is complete, navigate to the new API Connection by clicking Deployment details and then clicking on the created API Connection.
9. Within the API Connection, authorize Microsoft Sentinel. Navigate to General→Edit API connection and click Authorize. After you authorize, click Save.
10. Now that you have authorized the API connection, the logic apps can interact with Sentinel. Open both workflows in new tabs so they are available for the next part.
Part 2: Configure case management connector in Kibana
1. In Kibana, head to Stack Management → Connectors and click Create Connector.
2. Select Webhook - Case Management and give your connector a name, and then select Authentication = None as the authentication will be embedded in the url. Add HTTP header switch on and enter Content-Type as a key and application/json as its value.
3. On the next screen, enter the endpoint details for case creation. Copy the URL of the corresponding Logic App and paste it into the Create case URL box (e.g., example-elastic-create-incident). You will find this inside the Request action’s details page. Navigate to Development Tools → Logic Apps designer to see the workflow.
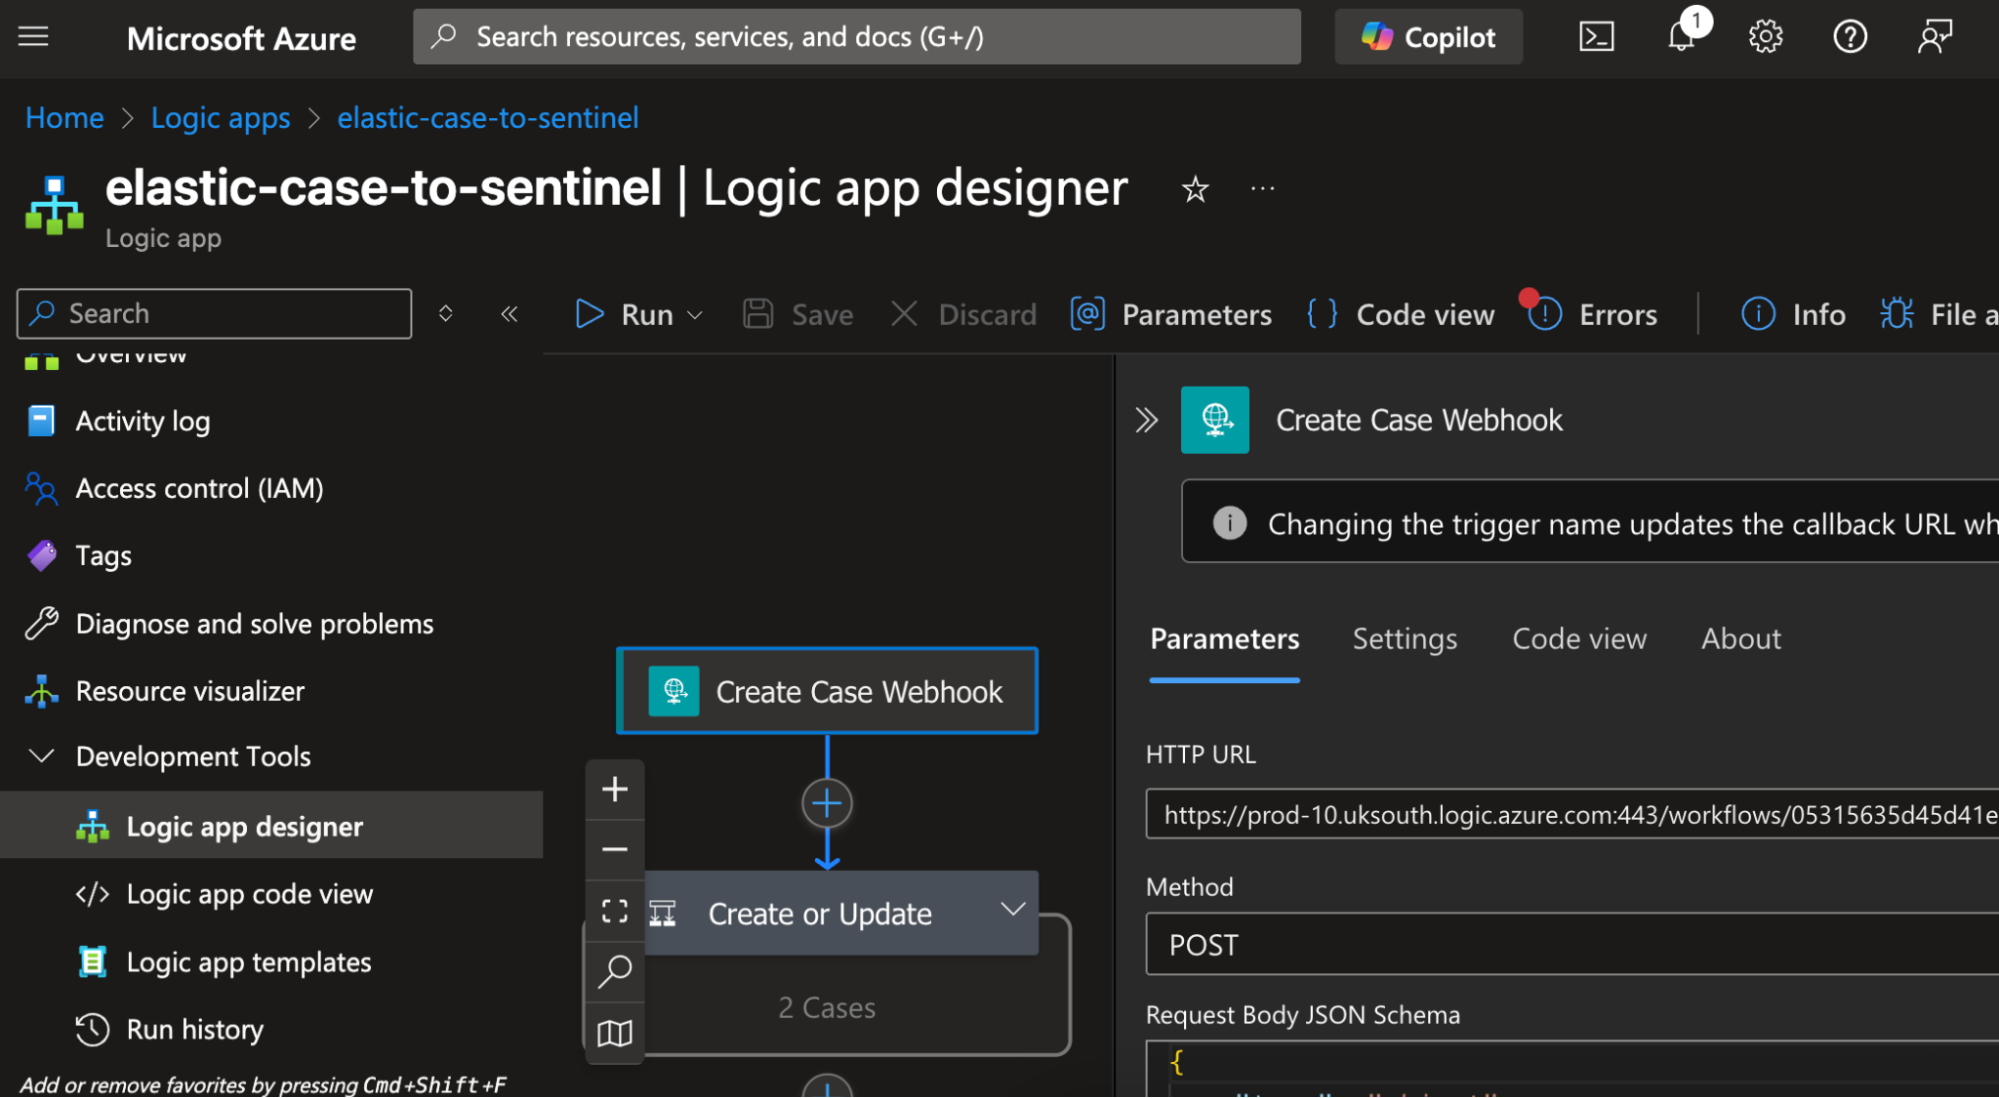
In the Create case object box, build a JSON object using the variables that Kibana makes available. The keys here must match up with the JSON schema that the Logic App’s request connector is expecting, so that the values can be correctly extracted and used where needed.
{
  "action": "create-incident",
  "case_id": {{{case.id}}},
  "case_title": {{{case.title}}},
  "case_severity": {{{case.severity}}},
  "case_status": {{{case.status}}},
  "case_description": {{{case.description}}},
  "case_tags": {{{case.tags}}},
  "elastic_url_base": "<YOUR_KIBANA_URL>/app/security/cases/"
}Finally, set the Create case response external key. This tells Kibana how to extract the Microsoft Sentinel incident ID from the response returned by your Logic app.
Create case response external key:
sentinel_incident_id4. On the next screen, configure the connector needed to get case information from Microsoft Sentinel. Here, use a new variable called external.system.id, which has been populated by the Microsoft Sentinel incident ID extracted during the previous step. Go to the Logic App created earlier that gets the incident information (e.g., example-elastic-get-incident) and retrieve the URL. Use the URL and add the external.system.id as a query parameter.Get case URL:
<WORKFLOW_URL>&sentinel_incident_id={{{external.system.id}}}Also configure the following.
Get case response external title key:
titleExternal case view URL:
https://portal.azure.com/#asset/Microsoft_Azure_Security_Insights/Incident/subscriptions/<YOUR_SUBSCRIPTION>/resourceGroups/<SENTINEL_RESOURCE_GROUP>/providers/Microsoft.OperationalInsights/workspaces/<SENTINEL_WORKSPACE_NAME>/providers/Microsoft.SecurityInsights/Incidents/{{{external.system.id}}}5. On the final screen of the connector wizard, we configure the final two endpoints for creating case updates and adding comments. Use the URL from the create case workflow and set the following parameters:
Update case method: POST
Update case object:
{
 "action": "update-incident",
 "case_id": {{{case.id}}},
 "case_title": {{{case.title}}},
 "case_severity": {{{case.severity}}},
 "case_status": {{{case.status}}},
 "case_description": {{{case.description}}},
 "case_tags": {{{case.tags}}},
 "sentinel_incident_id": {{{external.system.id}}}
}Create comment method: POST
Create comment object:
{
  "action": "add-comment-to-incident",
  "case_comment": {{{case.comment}}},
  "sentinel_incident_id": {{{external.system.id}}}
}6. Kibana provides an option to test the connector by filling in dummy values. Make sure to use this and ensure everything works before rolling out for real!
Part 3: Activate the case management connector
In Kibana, head to Security → Cases and click Settings.
Find the External incident management system section and select your new connector from the drop-down box. You can choose to edit the connector settings from here also if necessary.
Now, whenever you go to create a case in Kibana, the External Connector Fields section will be completed and your connector will be selected by default.
Try creating a case, updating its status, and adding comments! Then head over to Microsoft Sentinel to see all the same information already synchronized.
Scenario 2: Pushing Elastic alerts to Sentinel
In the second scenario, we require a workflow where triage is done directly in Microsoft Sentinel. To achieve this, we can use the Elastic Webhook Alert Connector to send alerts directly to a Logic Apps workflow in a similar fashion to the cases method described above.
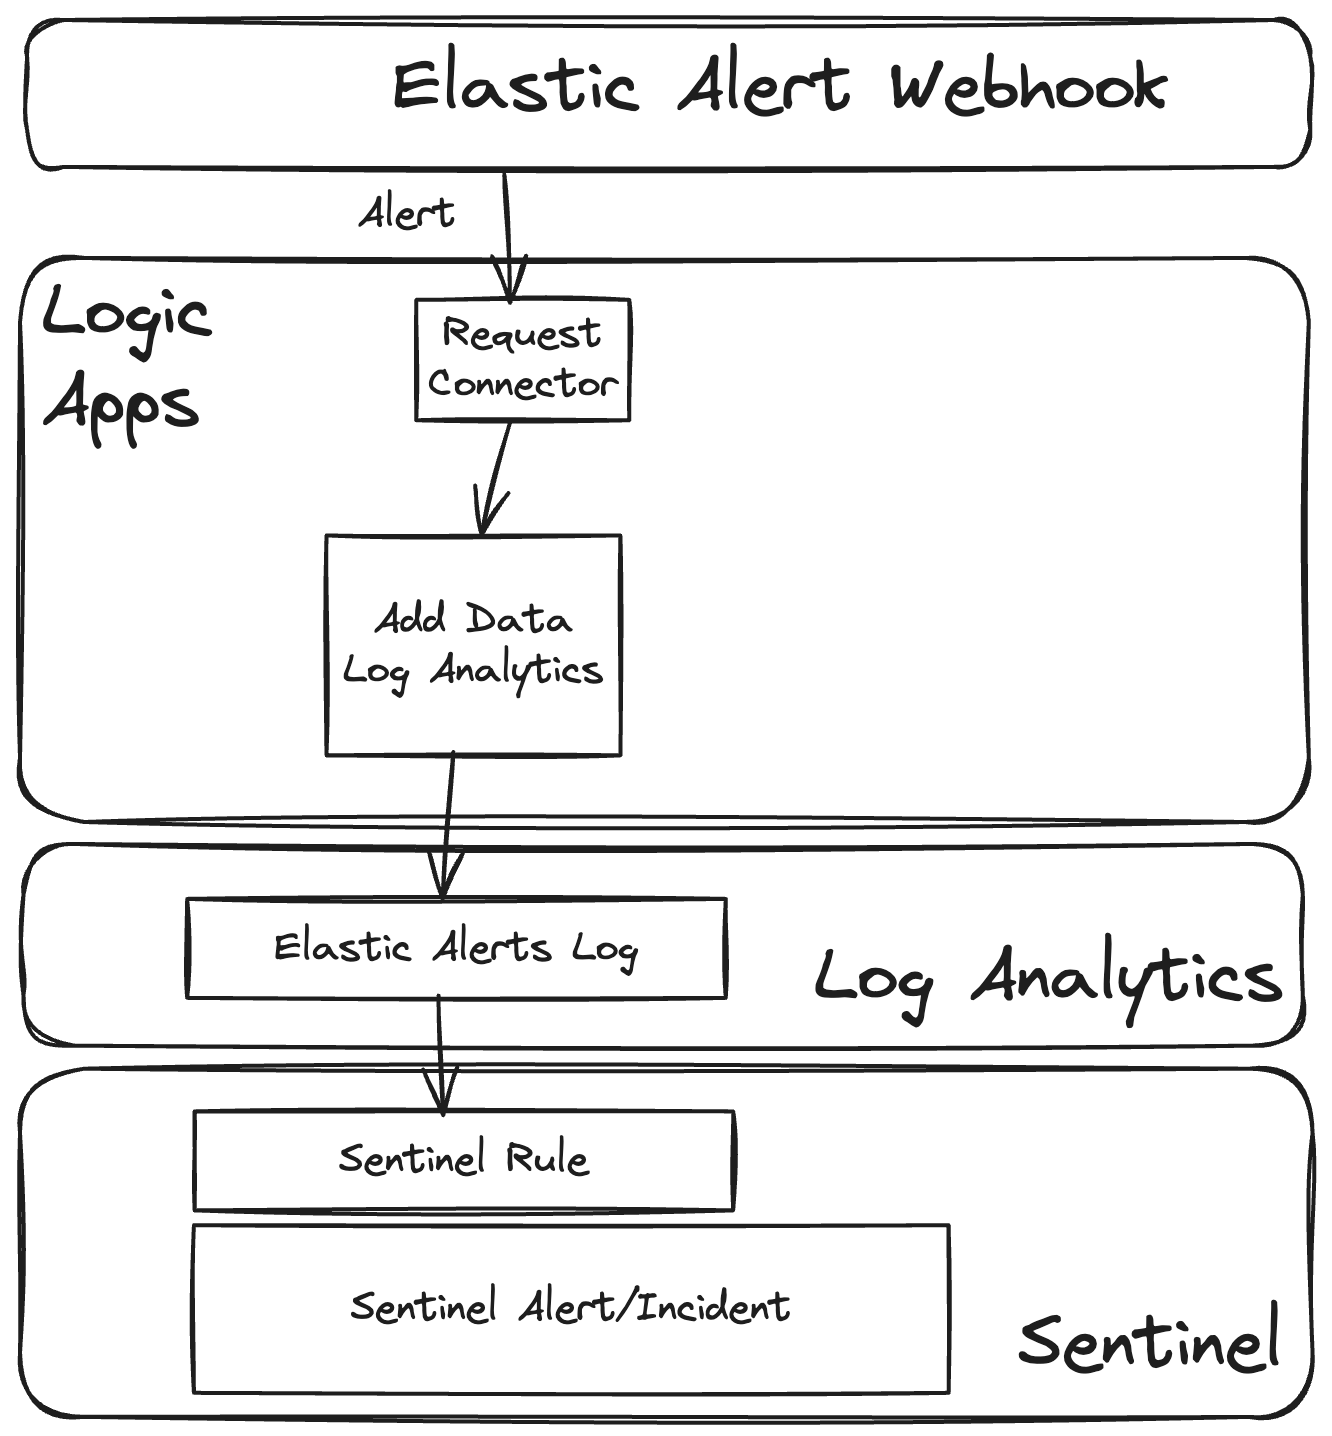
Elastic Security integrates alerts from external tools by ingesting these alerts as an additional log stream and then using a dedicated external alerts rule to surface these alerts to analysts. To achieve something similar in Microsoft Sentinel, we can use a similar strategy. We can ingest Elastic Security alerts into a Log Analytics stream and then use a Microsoft Sentinel rule to surface these alerts to analysts in Microsoft Sentinel. The logical diagram of the architecture is shown below.
Part 1: Create Azure Logic Apps
To replicate this architecture, we have provided an example ARM template that creates a Logic App and related Log Analytics collector to connect the two.
To deploy the template:
-
Download our example workflow template here.
-
In Azure, search for “Deploy a custom template.”
-
Select Build your own template in the editor.
-
Select Load file.
-
Choose the downloaded template.
-
Click Save.
-
Choose your resource group and name.
-
Choose your name for the workflow, the :ph Analytics Collector, and the details of your Log Analytics workspace.
-
To find your workspace ID and key, navigate to the workspace and select “Agents” and choose instructions.
-
After review and create, navigate to Logic Apps to check the created workflow
Part 2: Configure the Elastic Alert Connector
Now that we have the Logic App workflow, we need to configure Elastic to send alerts to Logic Apps. To do that we can follow the documentation.
-
In Kibana, navigate to Stack Management.
-
In Connectors, create a new Webhook connector.
-
In Logic Apps, open your workflow, open the “Logic Apps Designer” view, click the request trigger, and copy the “HTTP URL”
-
Fill out the Webhook connector configuration:
-
Name: Logic Apps
-
Method: POST
-
URL: <logic apps HTTP URL>
-
Authentication: none (this is embedded in the url)
-
Add HTTP Header: Content-Type = application/json
-
-
Click Save and Test.
-
In the Test box, use a basic test body such as: {"alert":{"id": "Test"}}
-
You should see “Test was successful.”
-
You can also see the test event in the Logic App by clicking on Overview and scrolling down to the Runs History table.
You now have a working route between Elastic and your chosen Log Analytics workspace.
Part 3: Create an Elastic SIEM detection rule to test the connector
1. In Kibana, navigate to Security → Rules → Detection Rules (SIEM).
2. Click Create new rule.
3. In the first section, “Define Rule,” use the following configuration:
-
Select Custom Query.
-
Optional: You may leave the index patterns settings as default, but if you want to limit the rule to certain indices or data views, change that here.
-
In the Custom Query box, enter the KQL query string “message:malware.” This will fire the alert when any log is found that contains the word “malware” in its message field.
-
Click Next.
4. In the second section, “About rule,” complete the following:
-
Enter a name (e.g., Sentinel Test Rule).
-
Enter a description (e.g., My Elastic detection rule to test Sentinel integration).
-
Click Next.
5. In the third section, “Schedule rule,” you can leave everything as default.
-
Optional: If you’d like the rule to fire more frequently to make testing quicker, reduce the Runs every value from 5 minutes to 1 minute, for example.
-
Click Next.
6. In the final section, “Rule actions,” link the rule to the connector we defined in the previous section.
-
Select the connector type “Webhook.”
-
From the Webhook connector dropdown, select your connector. (Note: If you only have one of these, skip this step as it will already be selected for you.)
-
For Action frequency, select For each alert and Per rule run.
-
Optional: You have the option to filter the alerts that are sent to the webhook by using a query string, or a timeframe, but we can leave these options disabled for now.
-
For the Body, package up the information available from the alert into a JSON object that will be sent to the webhook. This is entirely flexible and you can include as much or as little context as you want. We have provided an example body which you can copy/paste for simplicity.
-
Click Add action.
-
Click Create & enable rule.
Part 4: Create a Microsoft Sentinel analytics rule to pick up the alert
The final piece of the puzzle is to define a query rule in Microsoft Sentinel that takes some action when Elastic alerts appear as logs in the Log Analytics stream.
1. In Microsoft Sentinel, navigate to Configuration → Analytics.
2. Click Create and then NRT Query Rule.
3. In the General section, complete the following:
-
Enter a name (e.g., Sentinel Test Rule).
-
Enter a description (e.g., My Sentinel analytics rule to pick up Elastic alerts).
-
Optional: You can also choose to set a Severity here and map the rule to tactics, techniques, and sub-techniques from MITRE ATT&CK.
-
Click Next.
4. In the Set rule logic section, complete the following:
-
In the Rule query box, enter a KQL string (but remember, this time we mean Kusto Query Language and not Kibana!). The simplest option if you don’t want any filtering or transformation is to enter only the table name (e.g., ElasticAlerts_CL).
Optional: In the Alert enhancement section, you have the possibility to enrich the generated Microsoft Sentinel alerts in a number of ways. If the alert data from Elastic Security contains identifiers that relate to entities recognized by Microsoft Sentinel, the Entity mapping option allows these links to be made. Parameters from the Elastic Security alert can be added as key-value pairs in the Custom details option or formatted as the name or description of the alert in the Alert details option.
-
For Event Grouping, select Trigger an alert for each event.
-
Click Next.
5. In the Incident settings section, complete the following:
-
Leave the “Create incidents from alerts triggered by this analytics rule” toggle enabled.
-
Optional: There are more advanced alert grouping options available here to help you define the incidents to be created in finer detail.
-
Click Next.
6. Skip the Automated response section and click Next.
7. Review all entered details and if all looks good, click Save to add the new rule to Sentinel. This is enabled automatically.
And we’re done! So, from this point onward, any time our detection rule fires in Elastic Security and creates an alert, we will see corresponding alerts and incidents in Sentinel.
If you would like to test the integration, simply send a log in to Elastic Security to trigger the rule. One way to do this is by using Kibana’s Console (inside Management menu → Dev Tools).
Enter the following into the Shell panel and hit the play button to send the request:
POST logs-delete-me/_doc
{
  "timestamp": "2025-03-03T10:11:11Z",
  "message": "malware has been installed. panic!"
}Scenario 3: Ingesting Microsoft Sentinel logs into Elastic Security
Even if your main goal is to provide additional information into your Microsoft Sentinel instance, it is also worth thinking about replicating logs relating to alerts, incidents, and events from Microsoft Sentinel into Elastic Security. If your use case for Elastic involves threat hunting through diverse data or carrying out historic analysis, it is incredibly valuable to have the context from Microsoft Sentinel as part of your investigation in Elastic.
ElasticSecurity provides an out-of-the-box integration for Sentinel that collects and parses alerts and incidents from Microsoft Sentinel REST API and events from the Azure Event Hub.
For more information, see the documentation.
What did we learn today, class?
By combining the power of Elastic Security with Microsoft Sentinel, organizations can achieve a more comprehensive and cost-effective security posture. Elastic’s broad data collection, powerful analytics, and built-in machine learning complement Microsoft Sentinel’s strengths, providing a unified view across complex IT environments. This integration enables security teams to detect, investigate, and respond to threats more efficiently, ensuring that no attack goes unnoticed.
Ready to experience the combined power of Elastic Security and Microsoft Sentinel? Visit elastic.co/security to learn more about Elastic Security and how it integrates with Microsoft Sentinel. You can also sign up for a free trial of Elastic Cloud on Azure through the Azure Marketplace and see firsthand how this powerful combination can enhance your organization's security. Don't leave your security to chance — empower your team with the best tools available.
The release and timing of any features or functionality described in this post remain at Elastic's sole discretion. Any features or functionality not currently available may not be delivered on time or at all.
Share
- Share on Twitter
Share on Twitter
- Share on LinkedIn
Share on LinkedIn
- Share on Facebook
Share on Facebook
- Share by Email
Share by Email
- Print this page
Print