Elastic Observability: Built for open technologies like Kubernetes, OpenTelemetry, Prometheus, Istio, and more

 Share on Twitter
Share on Twitter

 Share on LinkedIn
Share on LinkedIn

 Share on Facebook
Share on Facebook

 Share by Email
Share by Email

 Print this page
Print
As an operations engineer (SRE, IT Operations, DevOps), managing technology and data sprawl is an ongoing challenge. Cloud Native Computing Foundation (CNCF) projects are helping minimize sprawl and standardize technology and data, from Kubernetes, OpenTelemetry, Prometheus, Istio, and more.
Kubernetes and OpenTelemetry are becoming the de facto standard for deploying and monitoring a cloud native application. Regardless of what cloud you use, Kubernetes provides the ability to deploy anywhere and OpenTelemetry gives you the opportunity to use any observability tool of choice, without having to re-instrument.
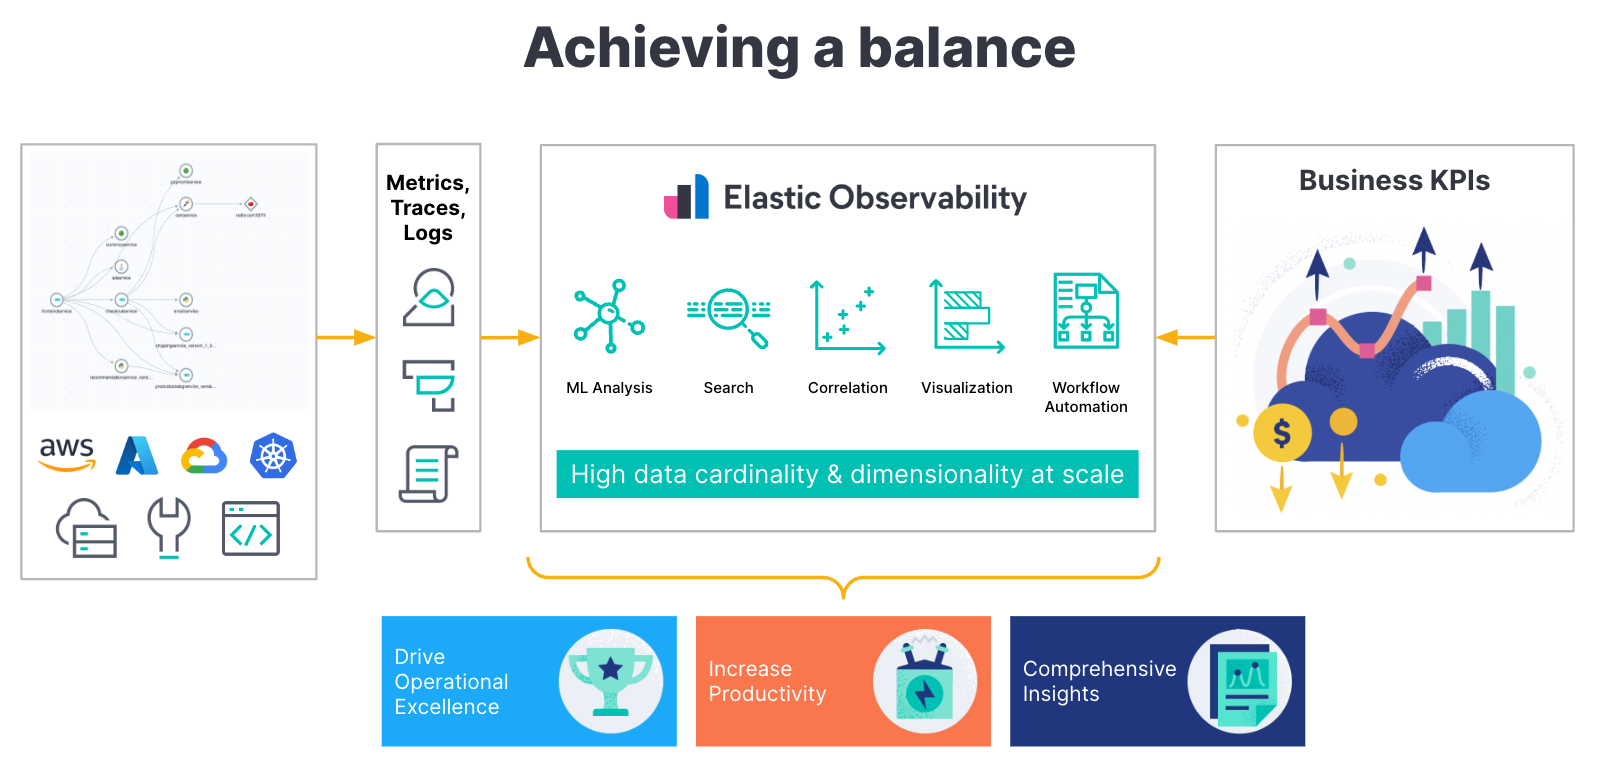
As a single platform, Elastic helps SREs unify and correlate limitless telemetry data, including metrics, logs, and traces, into a single datastore, Elasticsearch. By then applying the power of Elastic’s advanced machine learning (ML) and analytics, you can break down silos and turn data into insights. As a full-stack observability solution, everything from infrastructure monitoring to log monitoring and application performance monitoring (APM) can be found in a single, unified experience.
With its open source roots, Elastic supports the most recent and popular open source projects, from Kubernetes, OpenTelemetry, Istio, Prometheus, and more. This support helps eliminate churn and unnecessary tooling to integrate a new capability. It allows developers to use a consistent set of integrations, libraries, and schemas to build, deploy, and observe an application.
Additionally, managing these applications with CNCF projects gives SREs an enormous amount of control to concentrate on operations, efficiencies, and scale. It allows them to focus on business performance rather than tooling, as well as constant interrupt-driven operations.
With Elastic Observability, you can:
- Monitor your Kubernetes cluster regardless of cloud (on-premises or cloud service provider) or service (GKE/AKS/EKS)
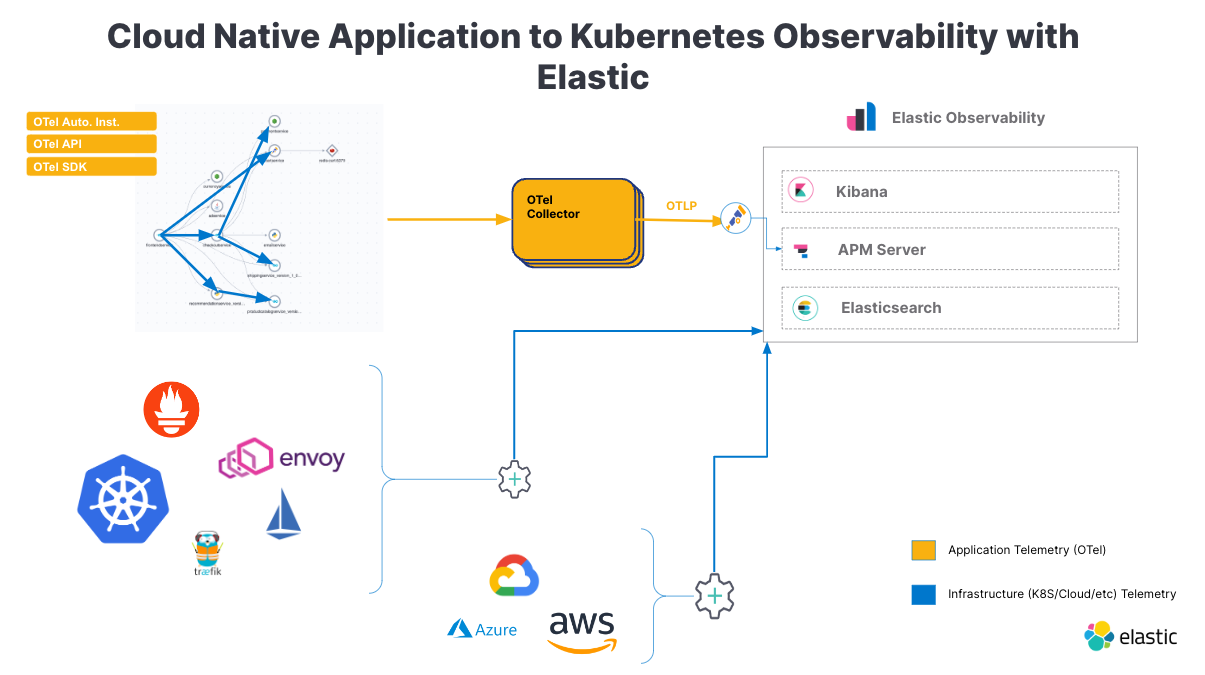
- Ingest and analyze your application telemetry (metrics, traces, and logs) consistently with Native OpenTelemetry support and observe the related K8s cluster with security
- Observe existing Kubernetes deployments by ingesting Prometheus metrics into Elastic or even Fluentd logs
- Monitor your application interactions through Elastic’s support for Envoy, Traefik, and Istio
In this blog, we’ll provide a summary of the support we highlighted in the above list and image.
Kubernetes observability with Elastic
The day-to-day operations of understanding the status and health of your Kubernetes clusters and applications running on them, through the logs, metrics, and traces they generate, will likely be your biggest challenge. But as an operations engineer, you will need all of that important data to help prevent, predict, and remediate issues. And you certainly don’t want that volume of metrics, logs, and traces spread across multiple tools when you need to visualize and analyze Kubernetes telemetry data for troubleshooting and support.
Elastic Observability helps manage the sprawl of Kubernetes metrics and logs by providing extensive and centralized observability capabilities beyond just the logging that we are known for. Elastic Observability provides you with granular insights and context into the behavior of your Kubernetes clusters along with the applications running on them by unifying all of your metrics, log, and trace data through OpenTelemetry and APM agents.
Here are a few resources providing an overview of what Elastic’s support is like for Kubernetes:
- The basics of observing Kubernetes
- Managing Kubernetes cluster with Elastic Observability
- How to monitor Kubernetes Clusters with Elastic
- Modern Observability and security on Kubernetes with Elastic and OpenTelemetry
Regardless of the cluster location (EKS, GKE, AKS, self-managed) or application, Kubernetes monitoring is made simple with Elastic Observability. All of the node, pod, container, application, and infrastructure (AWS, GCP, Azure) metrics, infrastructure, and application logs, along with application traces are available in Elastic Observability.
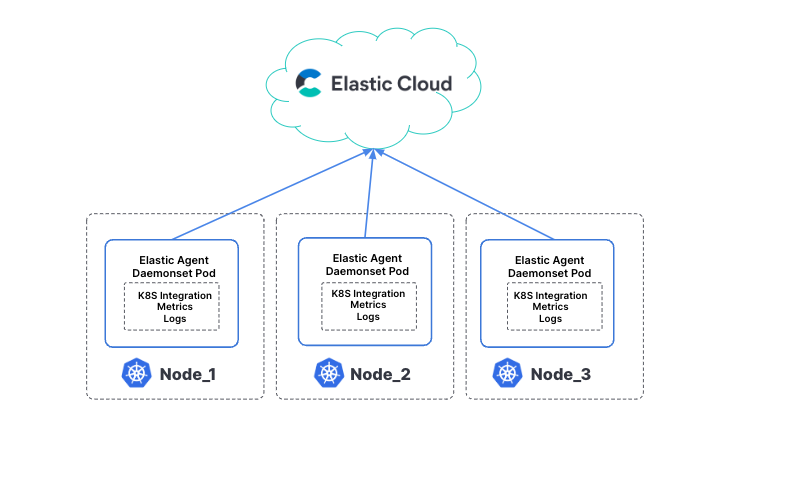
- Elastic Cloud can aggregate and ingest metrics and log data through the Elastic Agent (easily deployed on your cluster as a DaemonSet) to retrieve logs and metrics from the host (system metrics, container stats) along with logs from all services running on top of Kubernetes.
- Elastic Observability can bring a unified telemetry experience (logs, metrics, traces) across all your Kubernetes cluster components (pods, nodes, services, namespaces, and more).
Additionally, you can visualize Kubernetes cluster metrics and logs with out-of-the-box (OOTB) dashboards, create your own dashboards, analyze logs, and even utilize Elastic’s machine learning against all this telemetry data. Let’s take a sneak peek at Elastic’s helpful dashboards.
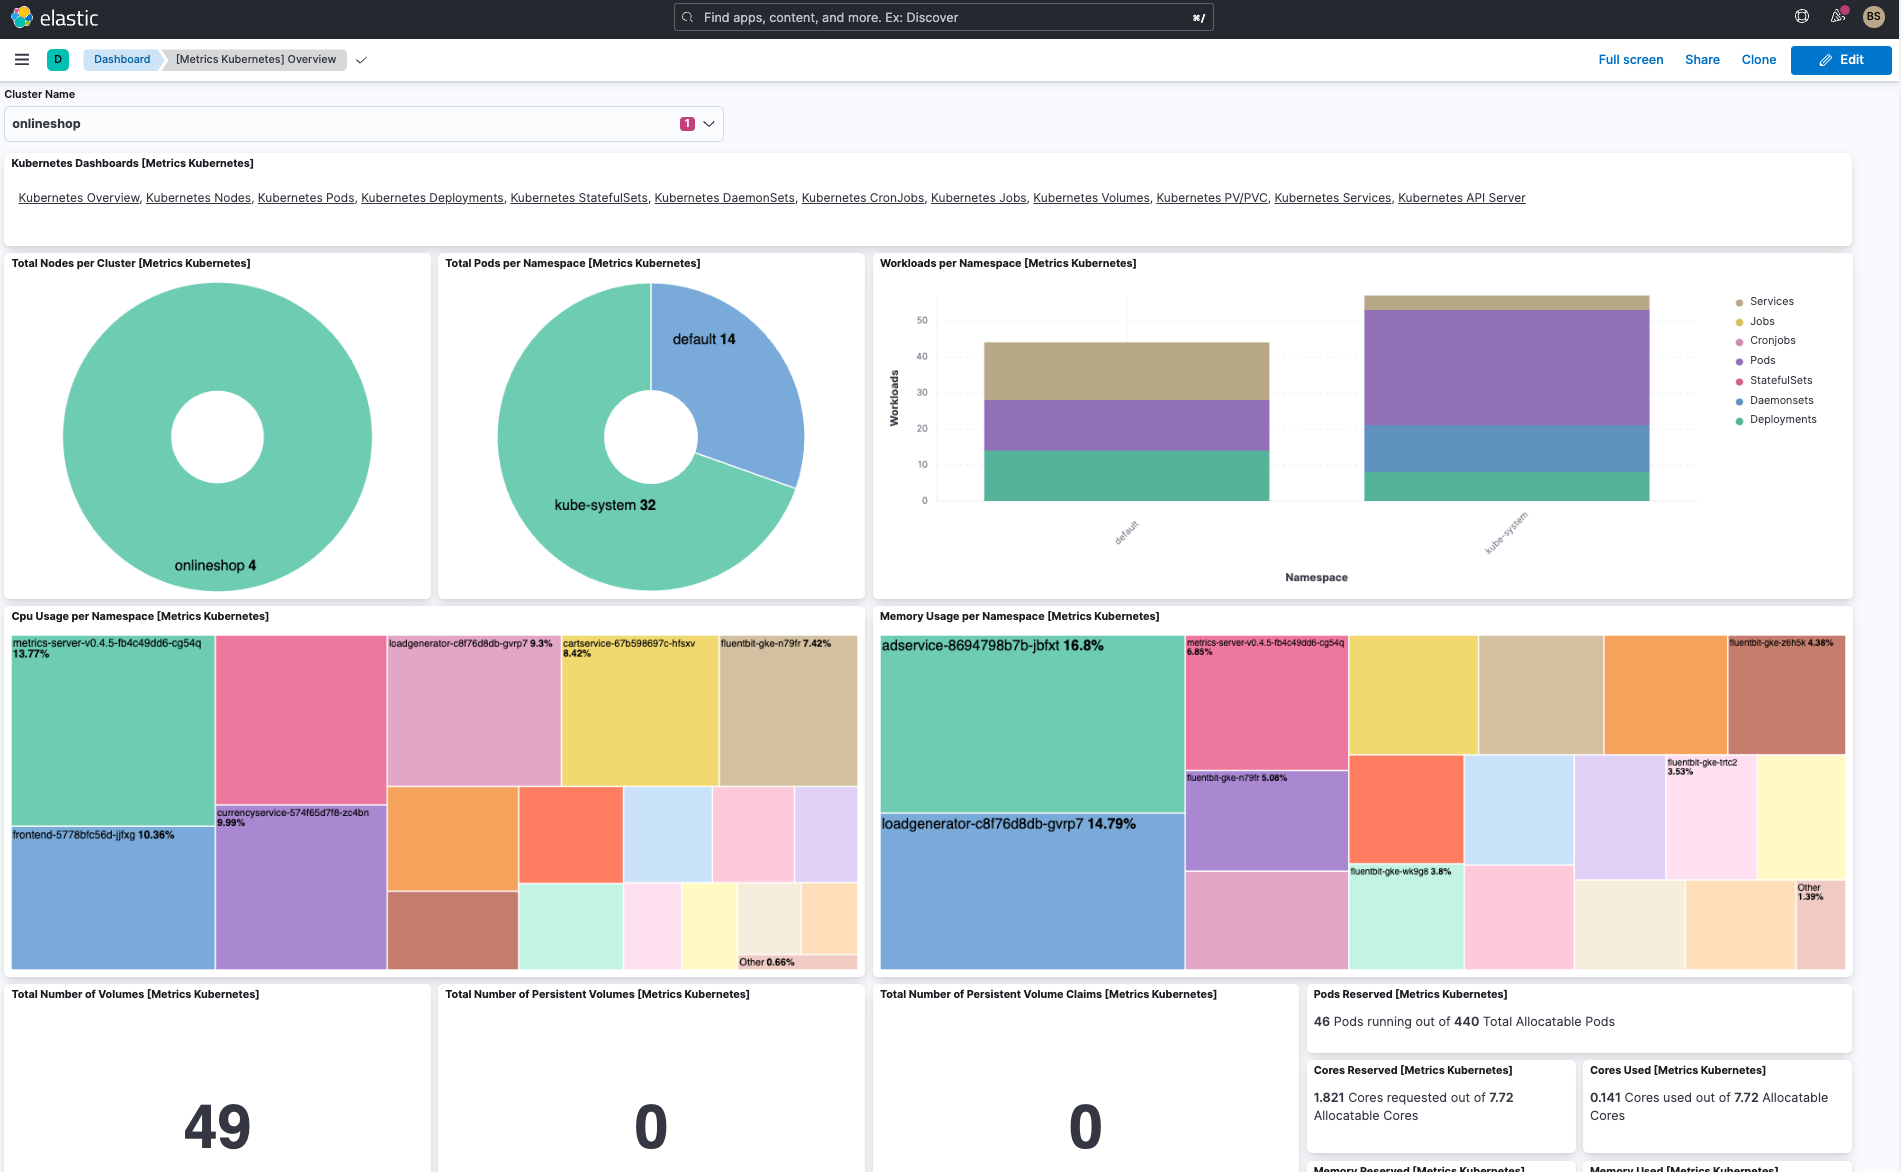
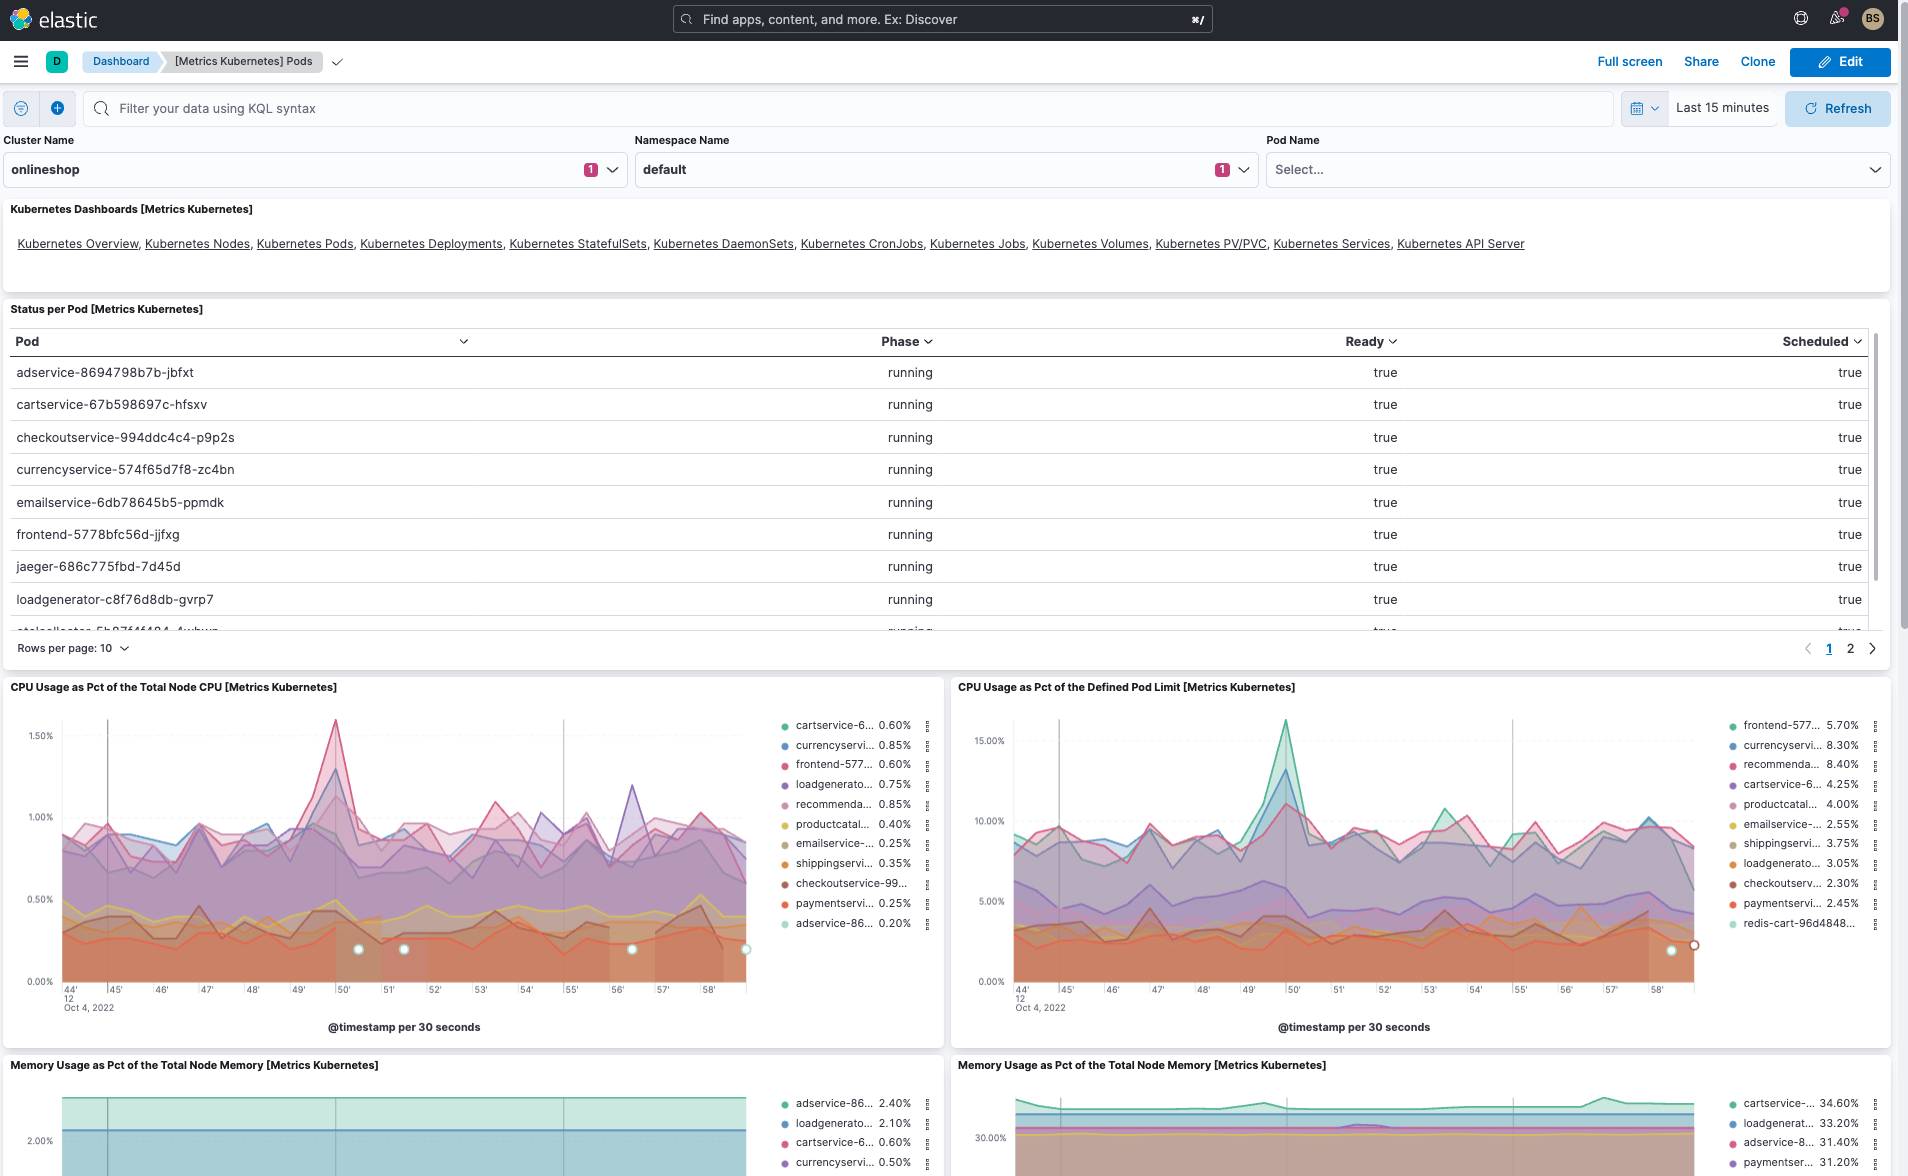
In addition to the cluster overview dashboard and pod dashboard, Elastic has several useful OOTB dashboards:
- Kubernetes overview dashboard (see above)
- Kubernetes pod dashboard (see above)
- Kubernetes nodes dashboard
- Kubernetes deployments dashboard
- Kubernetes DaemonSets dashboard
- Kubernetes StatefulSets dashboards
- Kubernetes CronJob & Jobs dashboards
- Kubernetes services dashboards
- More being added regularly
Working with logs on Elastic Observability utilizes Elastic’s Discovery capabilities:
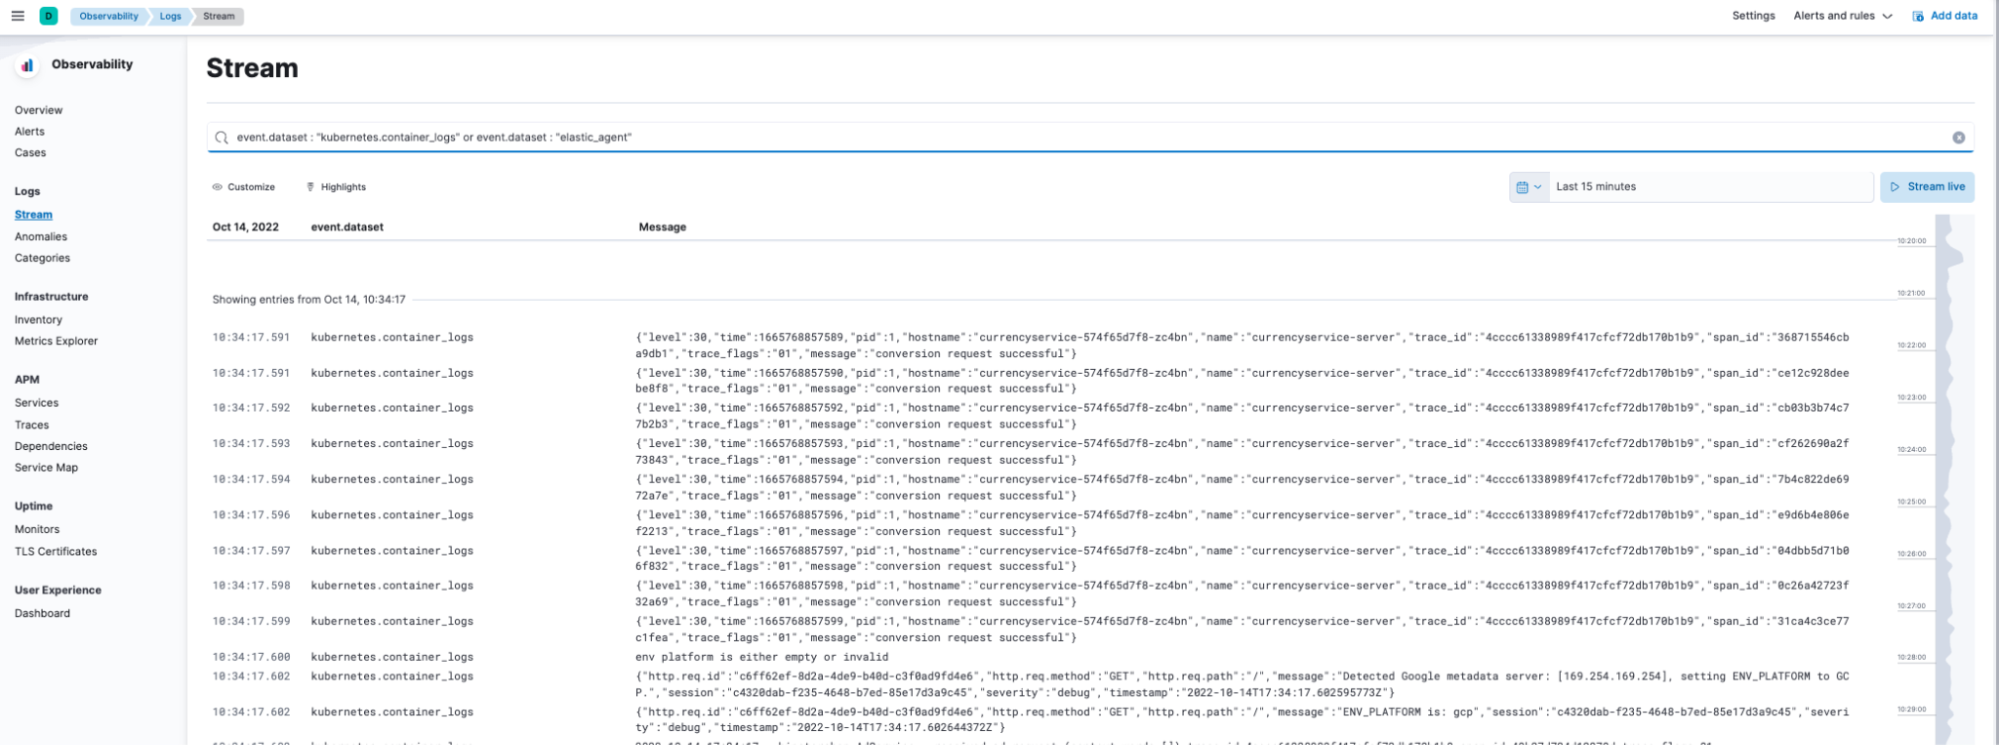
As you can see from the screens above, not only can I get Kubernetes cluster metrics, but also all the Kubernetes logs simply by using the Elastic Agent in my Kubernetes cluster.
OpenTelemetry support on Elastic
Once you’ve migrated your app to the cloud, how do you manage and monitor production, scale, and availability of the service? OpenTelemetry is quickly becoming the de facto standard for instrumentation and collection of application telemetry data for Kubernetes applications. Here are two blogs and a video that provide a great overview of Elastic’s OpenTelemetry support with Kubernetes:
- Setting up OpenTelemetry and ingesting application metrics, logs, and traces
- Manage your Opentelemetry application and kubernetes cluster, and end to end step through
- What can you do with your application telemetry on Elastic APM
OpenTelemetry (OTel) is an open source project providing a collection of tools, APIs, and SDKs that can be used to generate, collect, and export telemetry data (metrics, logs, and traces) to understand software performance and behavior. OpenTelemetry recently became a CNCF incubating project and has a significant amount of growing community and vendor support.
While OTel provides a standard way to instrument applications with a standard telemetry format, it doesn’t provide any backend or analytics components. Hence using OTel libraries in applications, infrastructure, and user experience monitoring provides flexibility in choosing the appropriate observability tool of choice. There is no longer any vendor lock-in for application performance monitoring (APM).
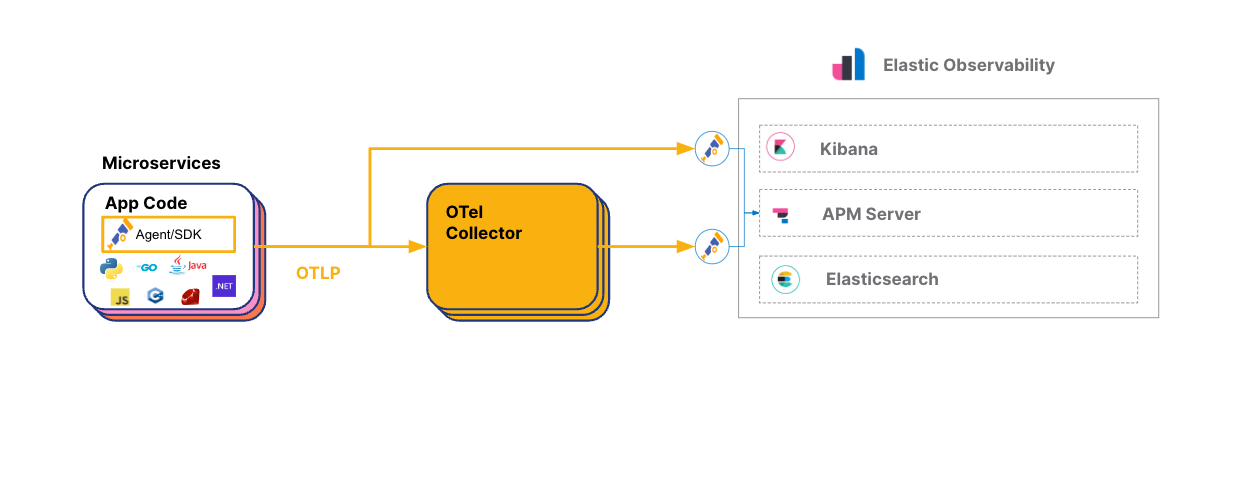
Elastic Observability natively supports OpenTelemetry and its OpenTelemetry protocol (OTLP) to ingest traces, metrics, and logs. All of Elastic Observability’s APM capabilities are available with OTel data. Hence the following capabilities (and more) are available for OTel data:
- Service maps
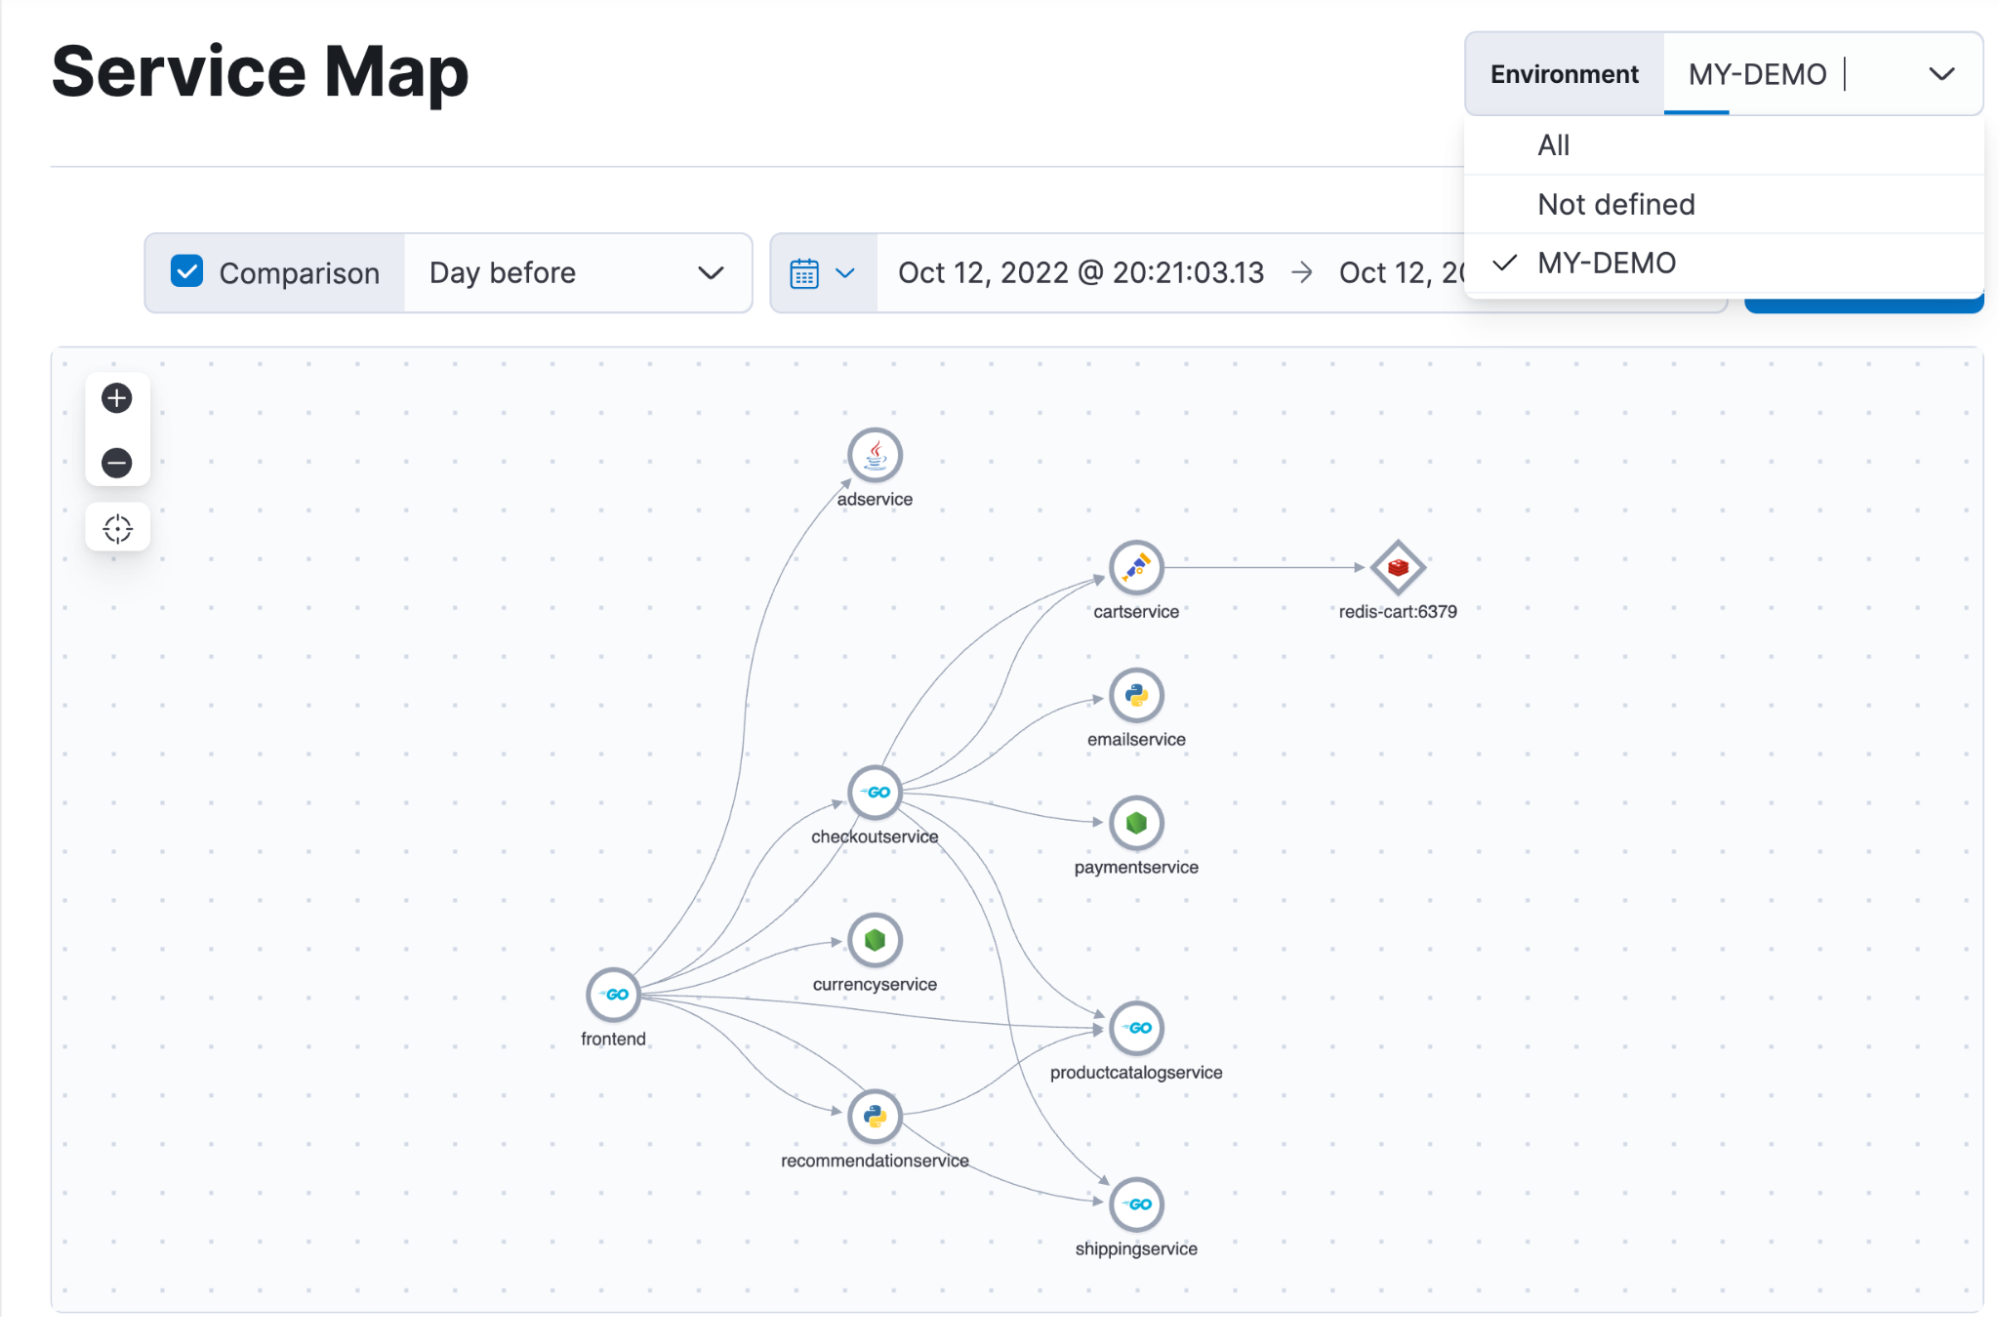
- Service details (latency, throughput, failed transactions)
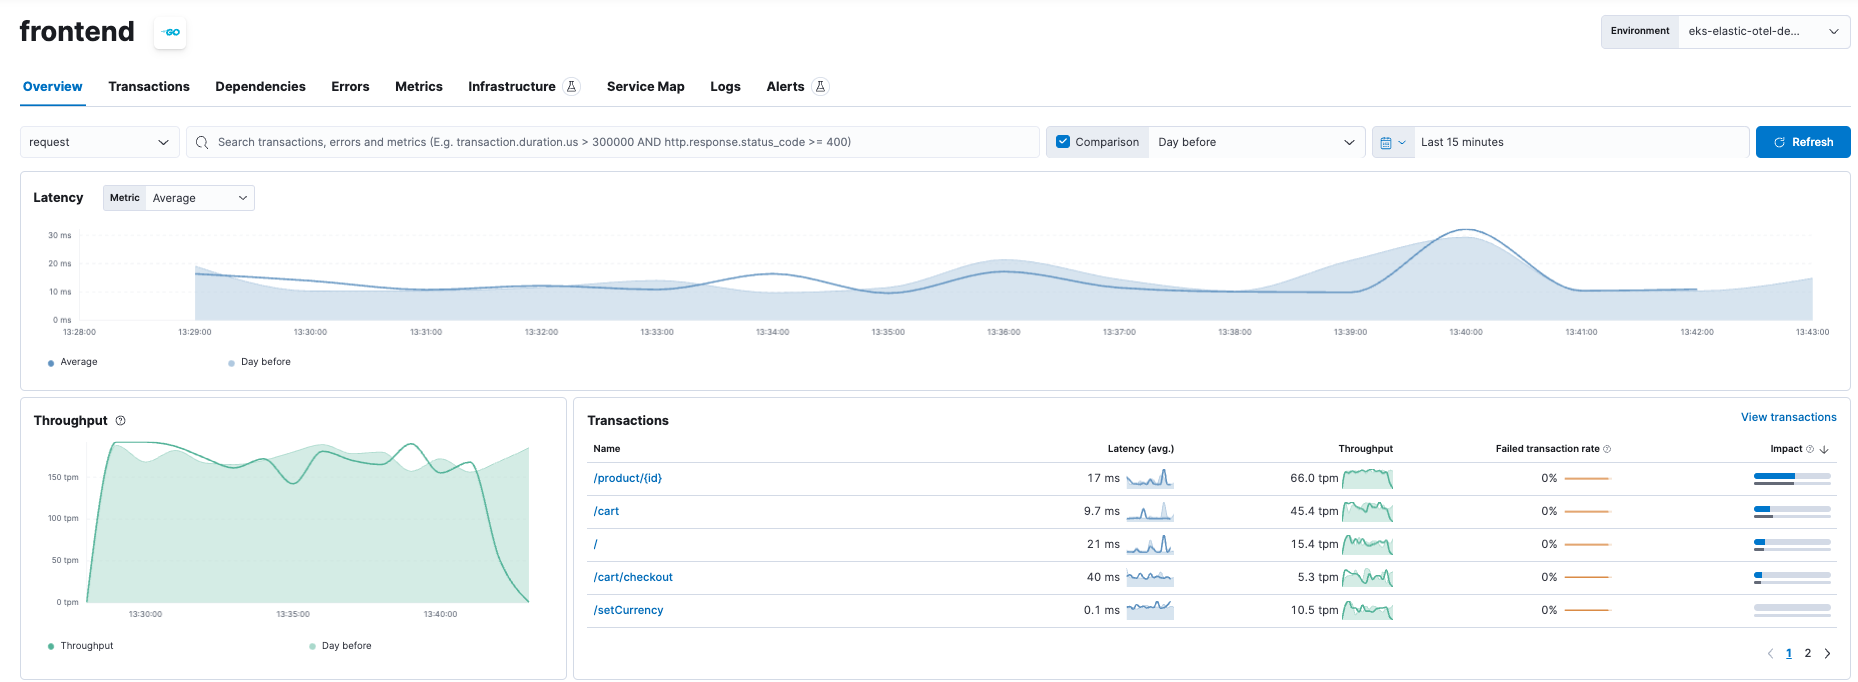
- Dependencies between services
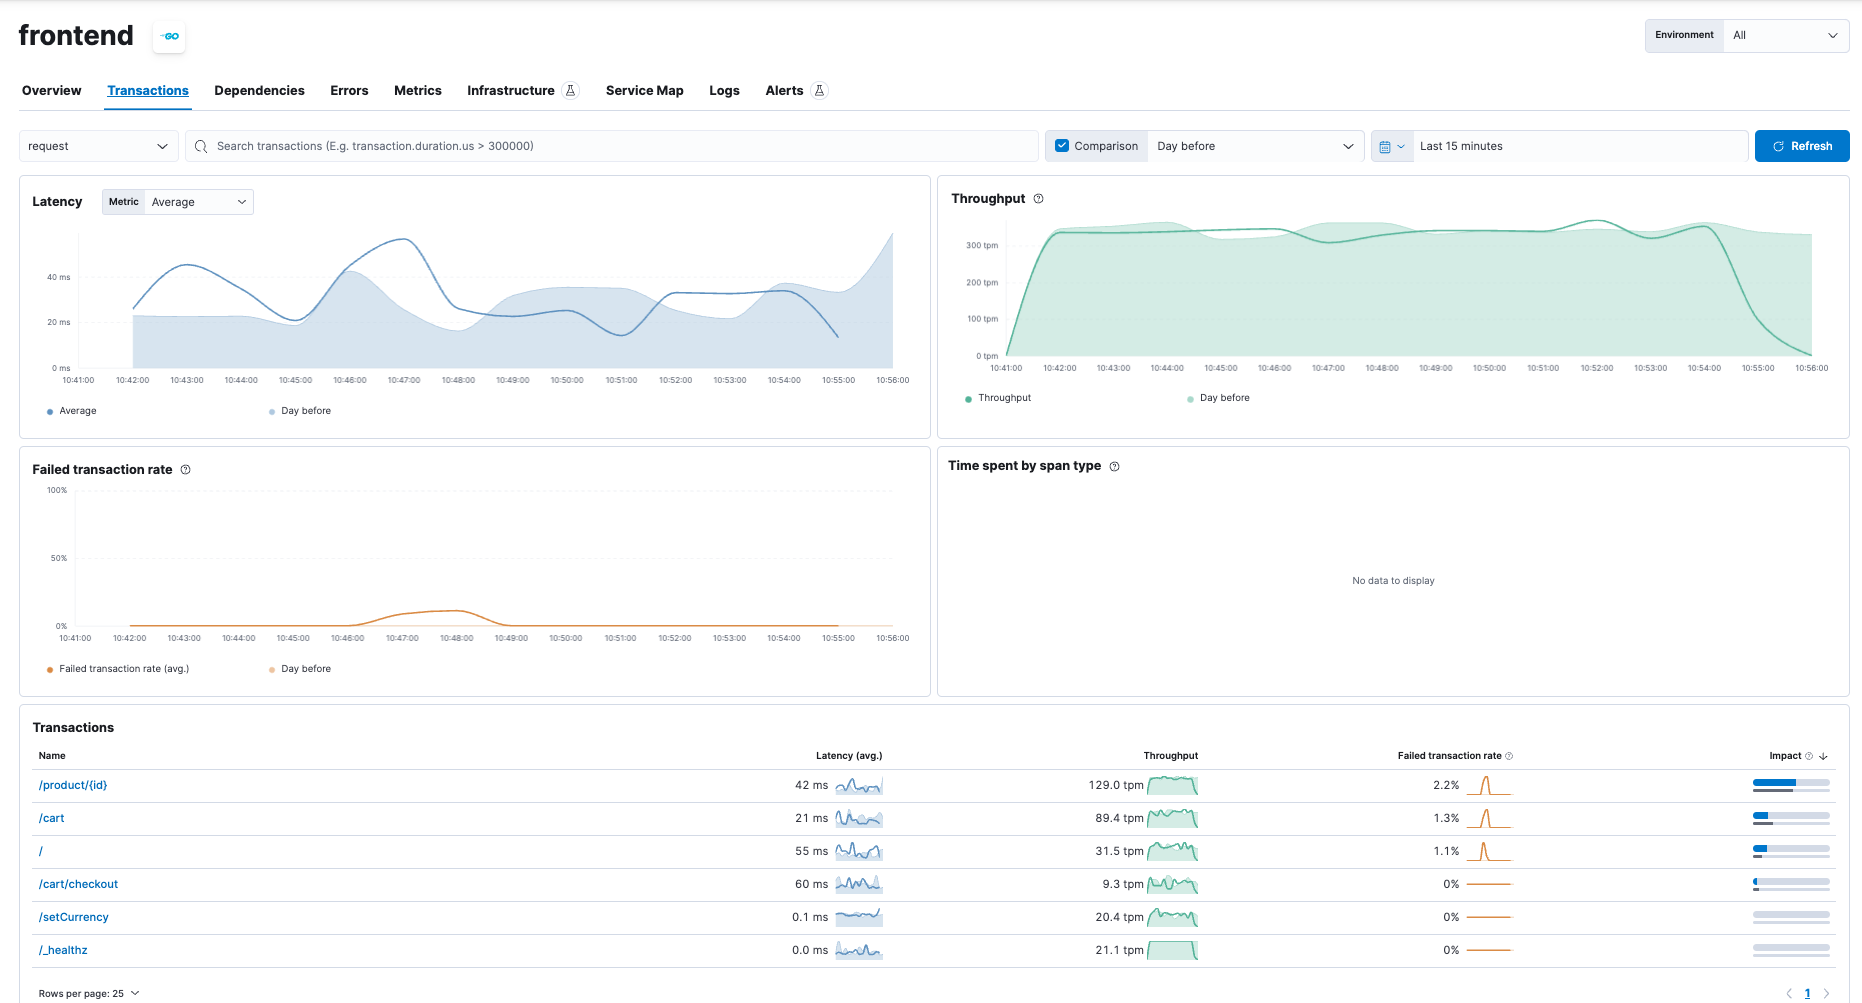
- Transactions (traces)
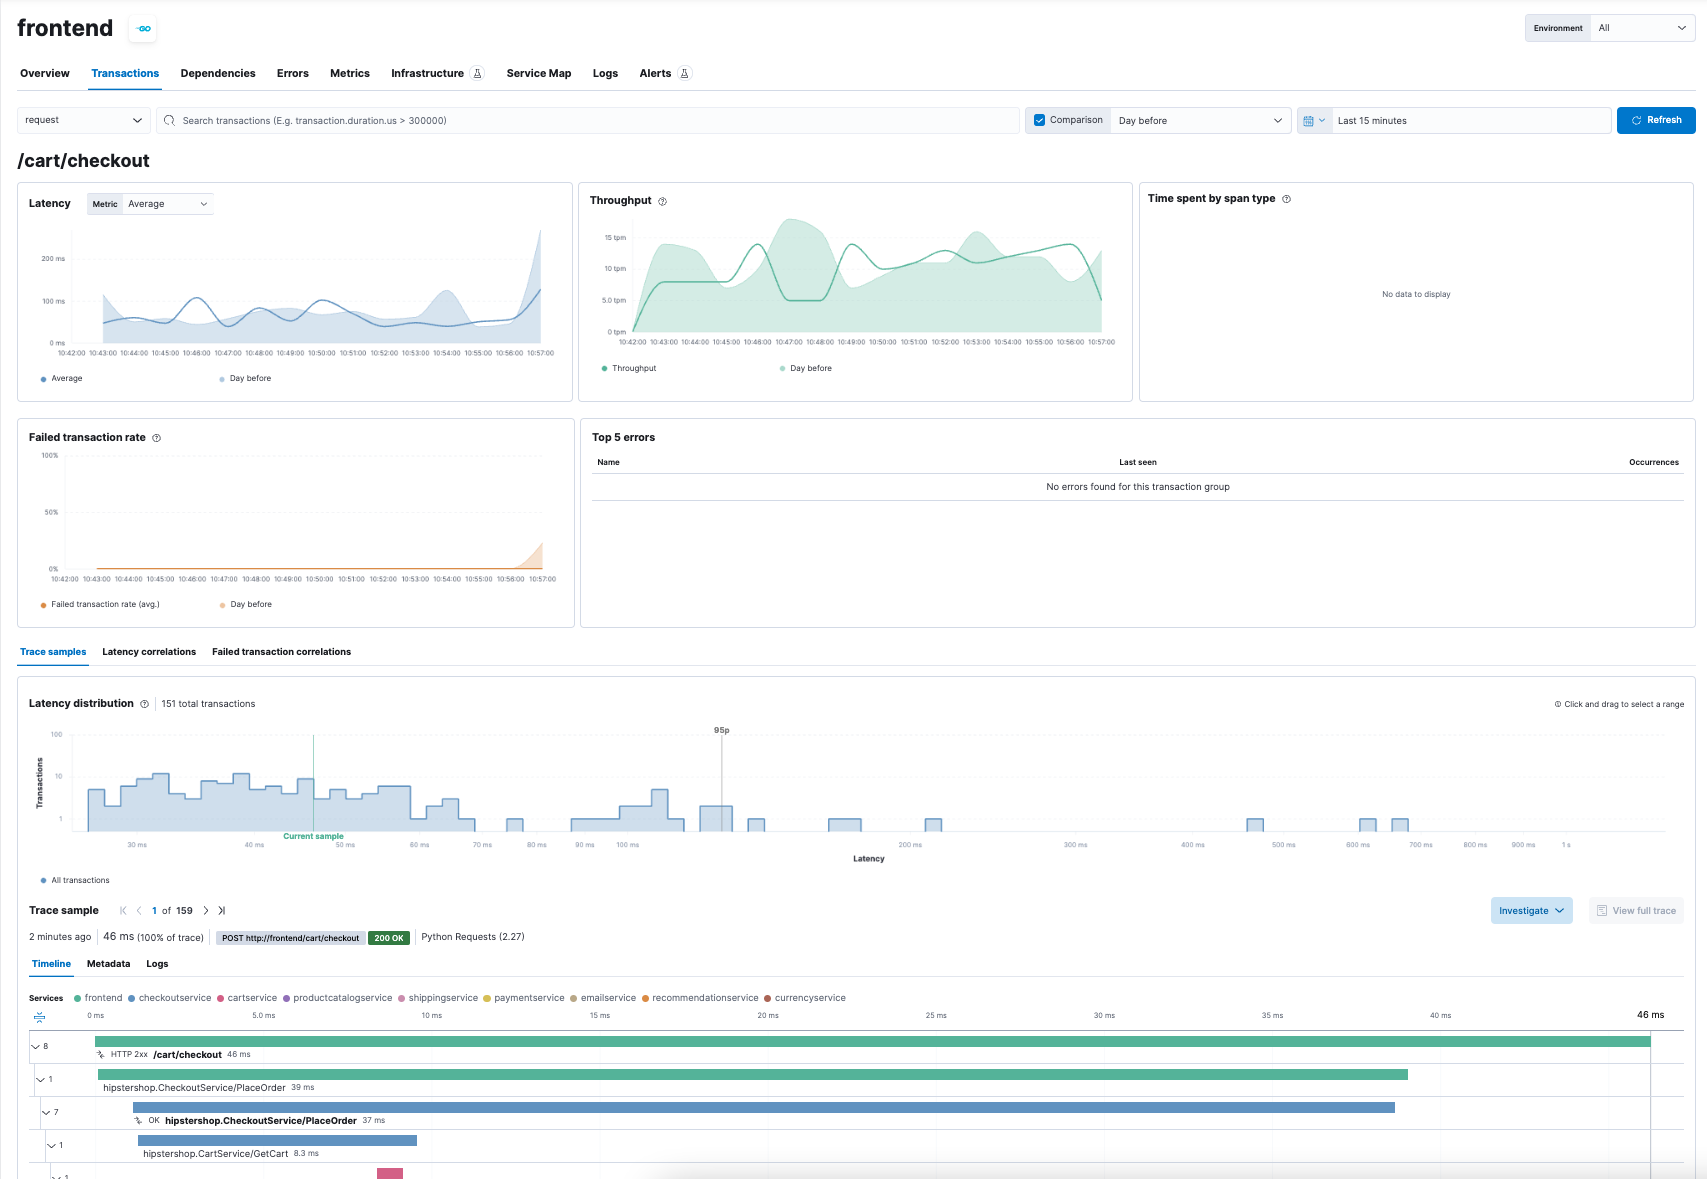
- Machine learning correlations (specifically for latency)
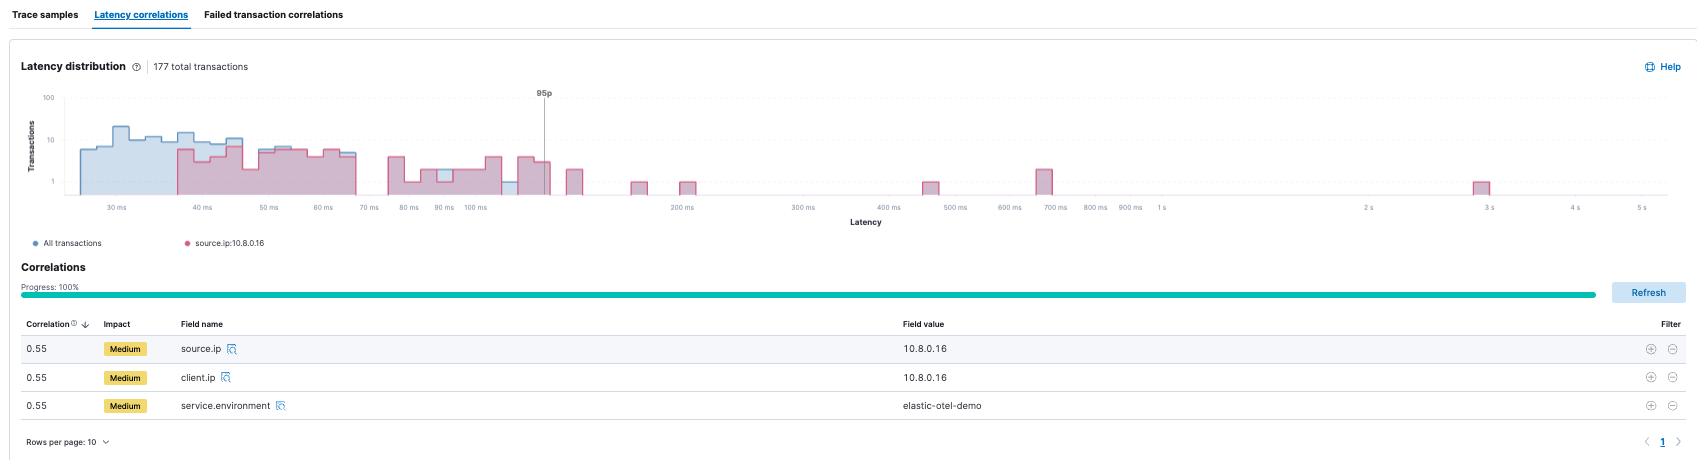
In addition to Elastic’s APM and unified view of the telemetry data, you will now be able to use Elastic’s powerful machine learning capabilities to reduce the analysis and alerting to help reduce MTTR.
Elastic’s support for other CNCF projects
In addition to Kubernetes and OpenTelemetry, Elastic also provides:
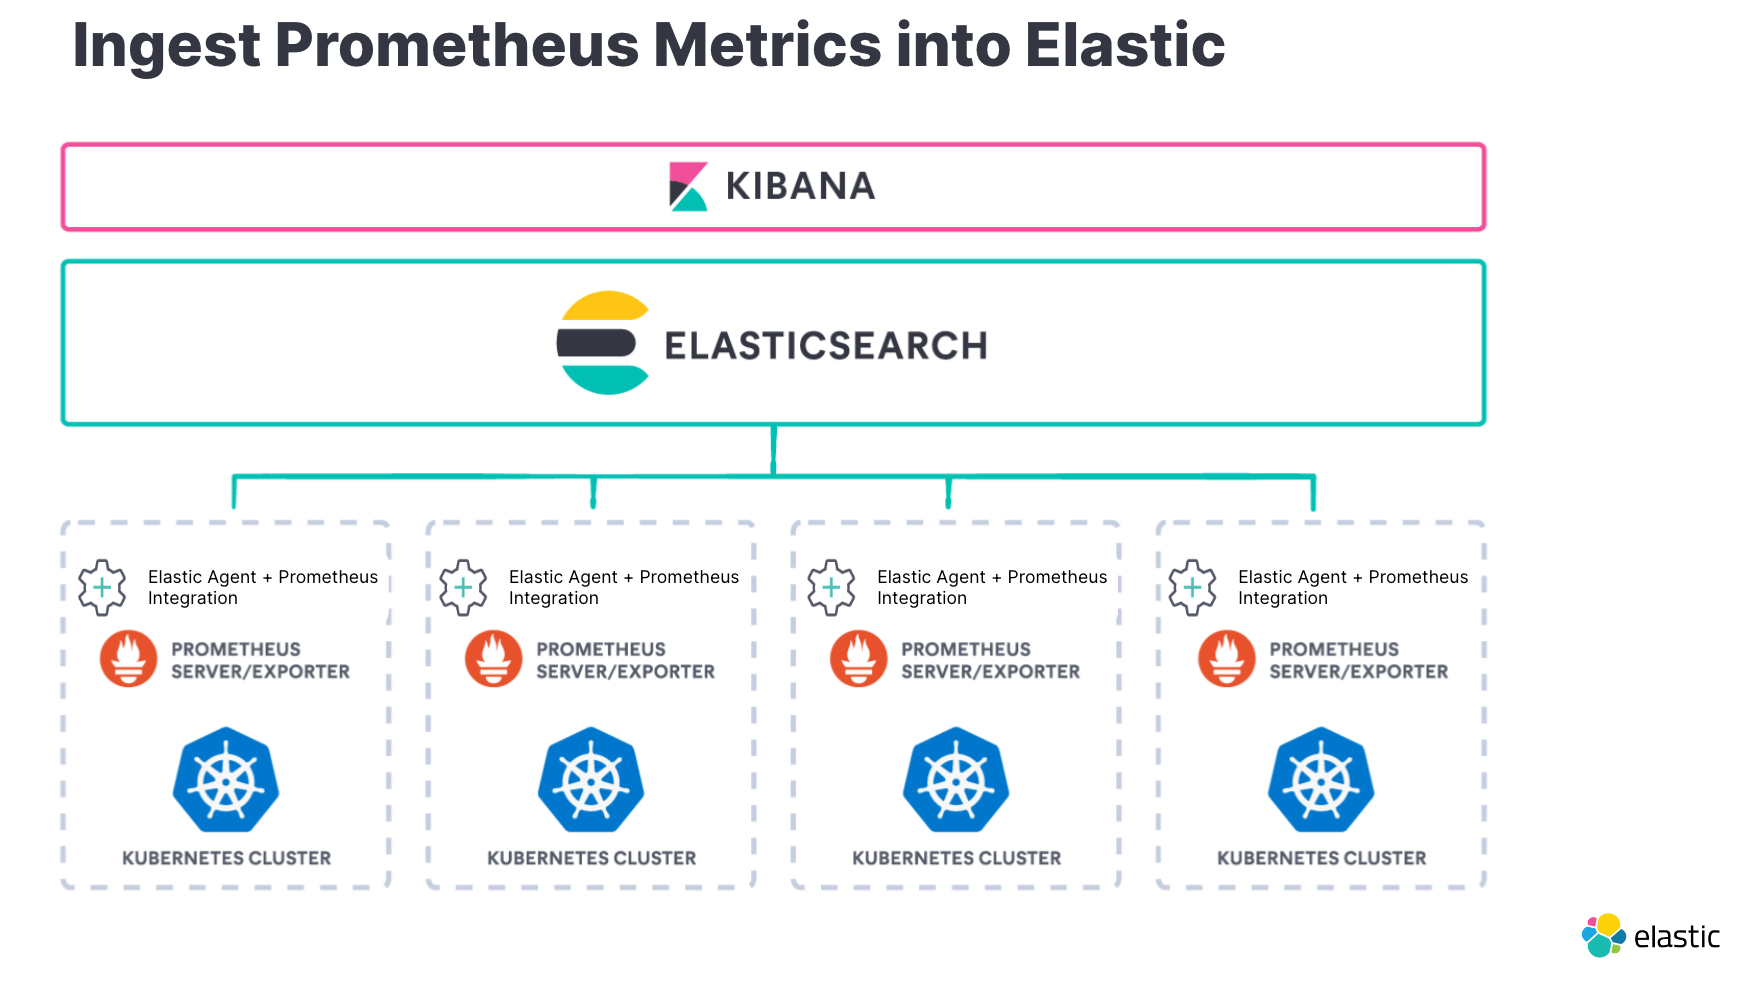
- Ingesting Prometheus metrics into Elastic or even Fluentd logs for existing deployments already configured with Prometheus and Fluentd
- Monitoring your application interactions through Elastic’s support for Envoy, Traefik, and Istio
The Elastic Stack can securely ingest operational data from multiple sources with ease.
Ingesting Fluentd logs is fairly simple with two options available:
- Use logstash plugin
- Use fluentd plugin
For Prometheus, view your metrics across geographically dispersed Prometheus instances, unify your Prometheus metrics with your logs and APM data in Elasticsearch, and correlate them all in Kibana. Read more about the benefits of running Prometheus with Elastic at scale.
When monitoring your interactions between services and the components managing them, such as Istio, Traefik, or Envoy, Elastic provides integrations to help ingest and analyze the data. Here are the links to instructions on how to ingest logs and metrics from:
Elastic Observability truly supports CNCF projects natively
I hope you’ve gotten an appreciation for how Elastic Observability can help you manage Kubernetes clusters along with other CNCF projects you will use to manage and observe your applications and clusters.
A quick recap of information covered above:
- Monitor your Kubernetes cluster regardless of what cloud (on-prem or cloud service provider) or service (GKE/AKS/EKS).
- Ingest and analyze your application telemetry (metrics, traces, and logs) consistently with Native OpenTelementry support and observe the related K8s cluster with security.
- Observe existing Kubernetes deployments by ingesting Prometheus metrics into Elastic or even Fluentd logs.
- Monitor your application interactions through Elastic’s support for Envoy, Traefik, and Istio.
Share
- Share on Twitter
Share on Twitter
- Share on LinkedIn
Share on LinkedIn
- Share on Facebook
Share on Facebook
- Share by Email
Share by Email
- Print this page
Print