APM correlations in Elastic Observability: Automatically identifying probable causes of slow or failed transactions


 Share on Twitter
Share on Twitter

 Share on LinkedIn
Share on LinkedIn

 Share on Facebook
Share on Facebook

 Share by Email
Share by Email

 Print this page
Print
As a DevOps engineer or SRE, you are often faced with investigating complex problems — mysterious application performance issues that happen intermittently or to only certain portions of your application traffic — that impact your end users and potentially your company’s financial targets. Sifting through hundreds or even thousands of transactions and spans can be a lot of tedious, manual, and time consuming investigative work. Cloud-native or distributed microservices deployments introduce further complexities, increasing time to root cause determination.
Wouldn’t it be awesome if you could quickly identify a common pattern that can help explain such a seemingly complex problem, thus demystifying it and paving the way for quicker root cause analysis and remediation?
The APM correlations magic in Elastic Observability
The Elastic APM correlation capability automatically surfaces attributes of the APM data set that are correlated with high-latency or erroneous transactions and have the most significant impact on overall service performance.
Your investigative workflow for APM issues typically starts in the Transactions tab of the APM view. Whether you are interested in transactions with high latency or in transactions that failed, you start by visualizing the outliers in the latency distribution chart of that particular transaction group. High latency transactions appear on the right side of the chart and the latency and failed transaction labels show the extent of impact. In addition, the 95th percentile annotation on the chart further helps visually separate the true outliers.
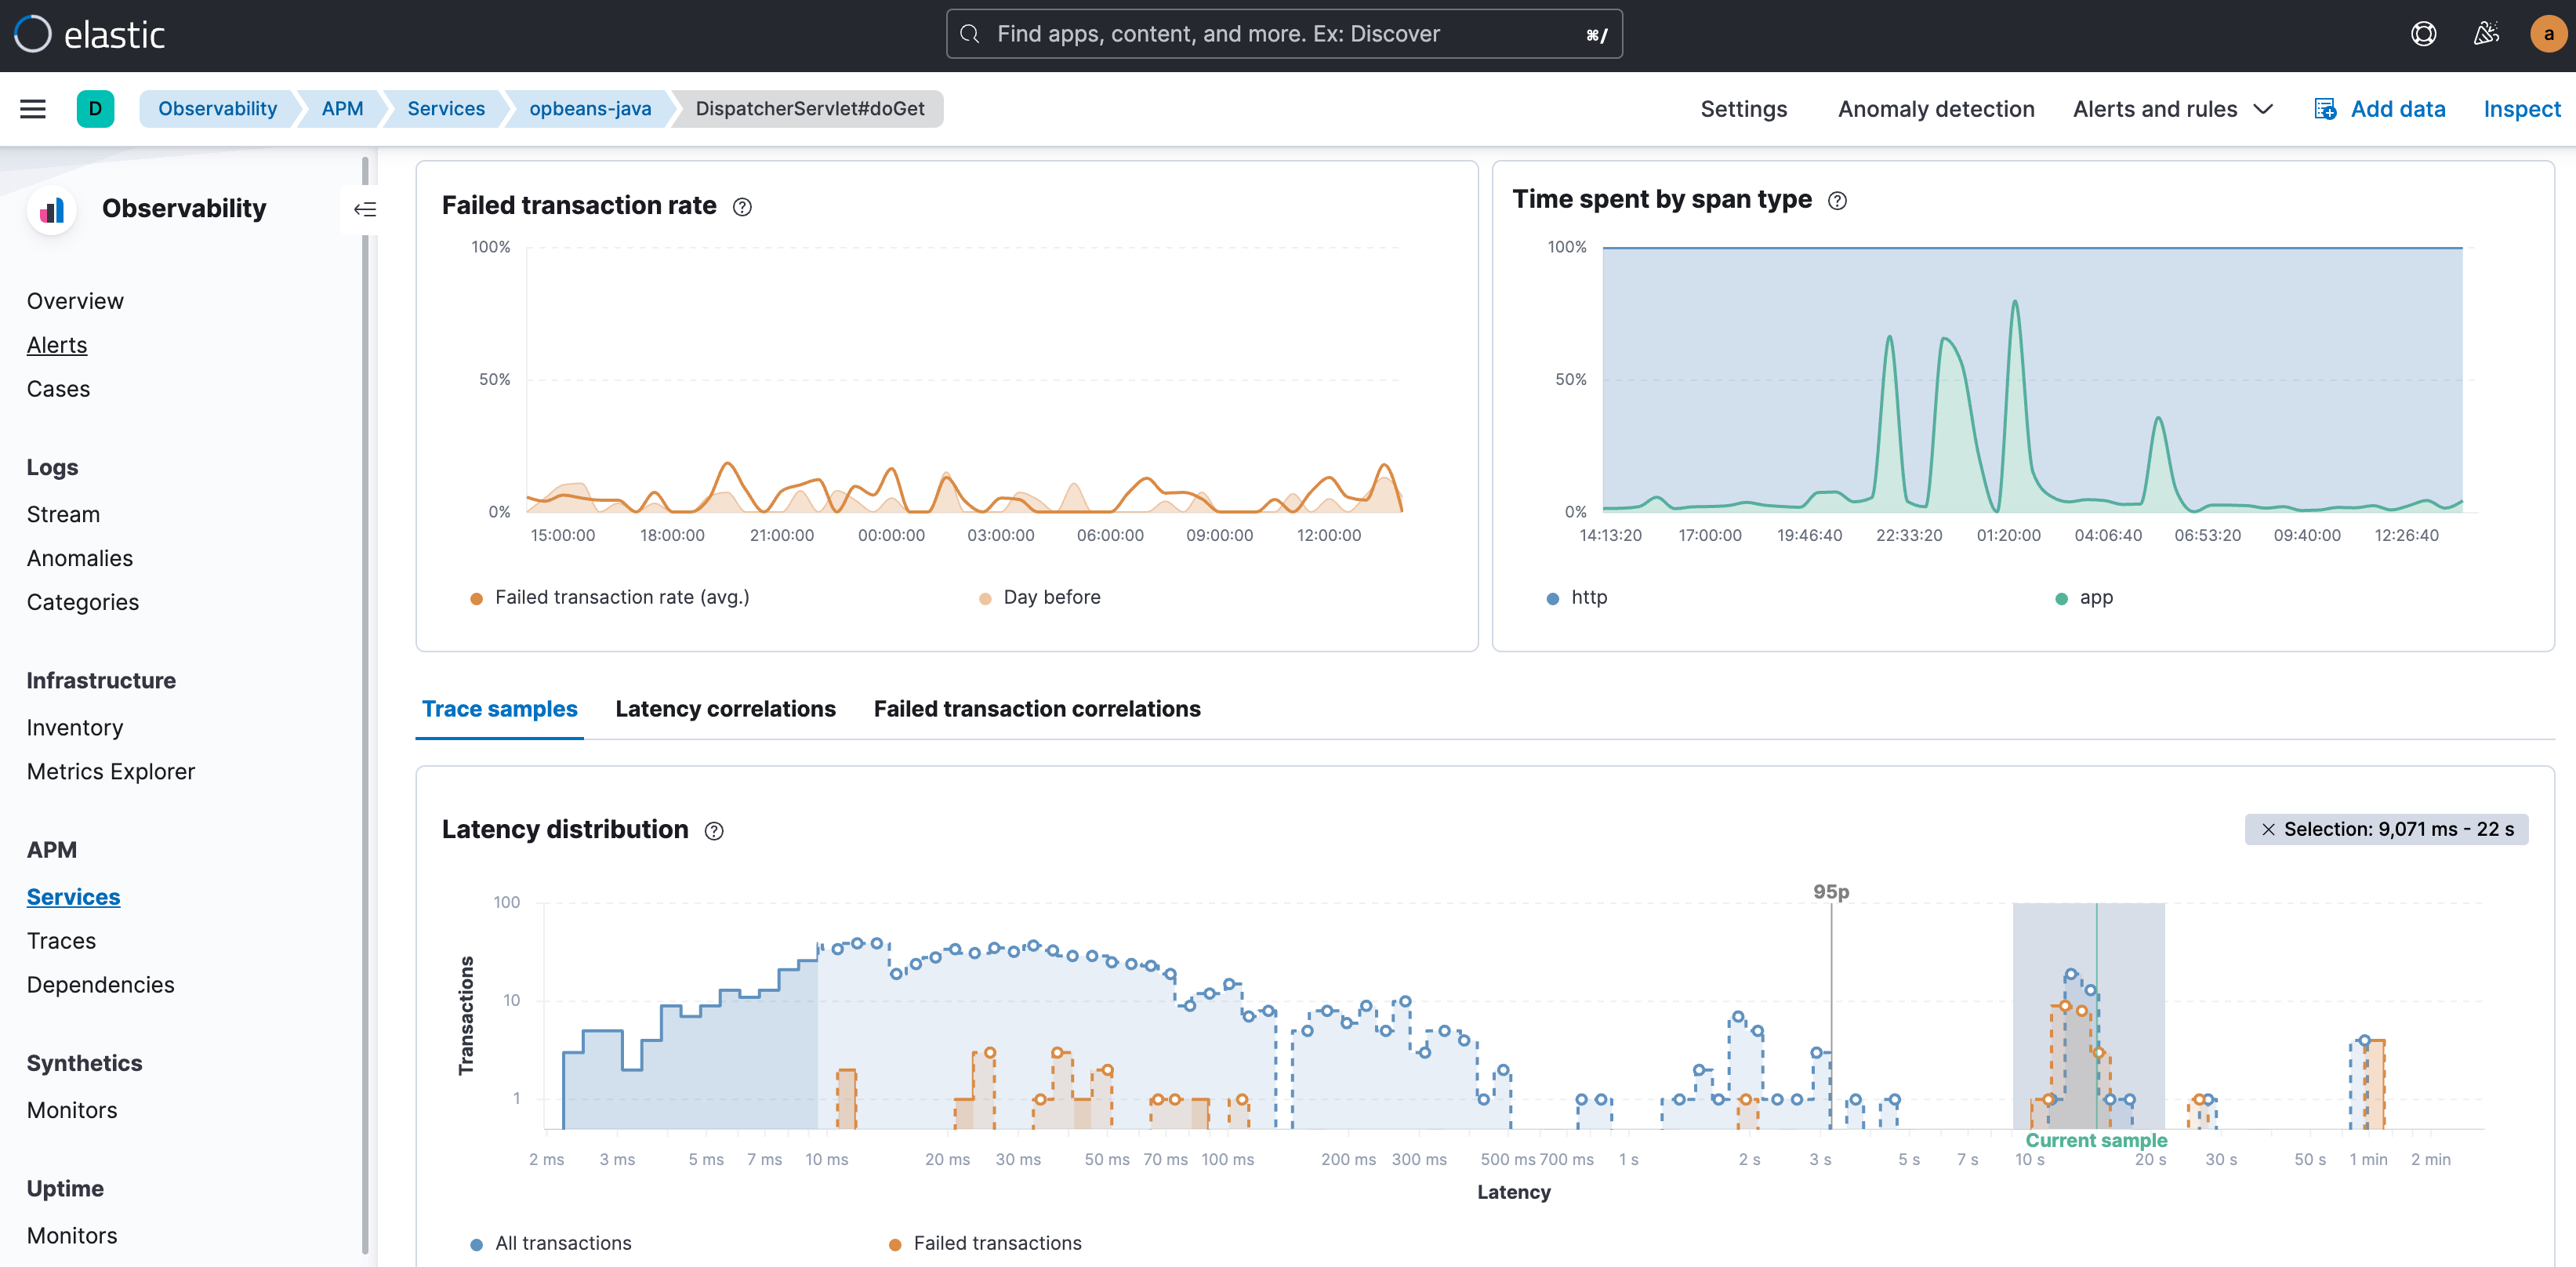
Your next step would be to look for attributes and factors in the data that correlate most with those outliers and narrow down your investigation to the affected sub-groups in the overall dataset. In other words, look for attributes that are disproportionately represented in slow or erroneous transactions. These attributes include labels, tags, trace attributes, and metadata, such as service versions; geo locations; device types; infrastructure identifiers; cloud-specific labels such as availability zone, OS, and client type for front-end services; and a host of other attributes. The intent is to be able to explain the anomalous transactions in terms of those attributes. So for example, the ability to say “almost all high latency transactions are occurring in Kubernetes pod x,” or “transactions with the label shoppingCartVolumeHigh and service version a.b are failing.”
Imagine if you had to go through all those attributes manually (which could be in the hundreds) to determine which specific attributes could help explain the performance outliers!
Elastic Observability automatically compares the attributes with high latencies and errors to the full transaction set and identifies tags and metadata that are “uncommonly common” in the suboptimal transactions. In other words, identify elements that are significantly more common in suboptimal transactions than in the full transaction set. It then not only offers up the correlations but also presents the highest correlating attributes first. The correlation value (ranging from 0 to 1.00, where 1.00 indicates a perfect correlation) helps provide a quick indication of the extent of the match. Click on any attribute to see transactions that carry that attribute, color-coded and presented within the distribution chart, to further visualize the overlap.
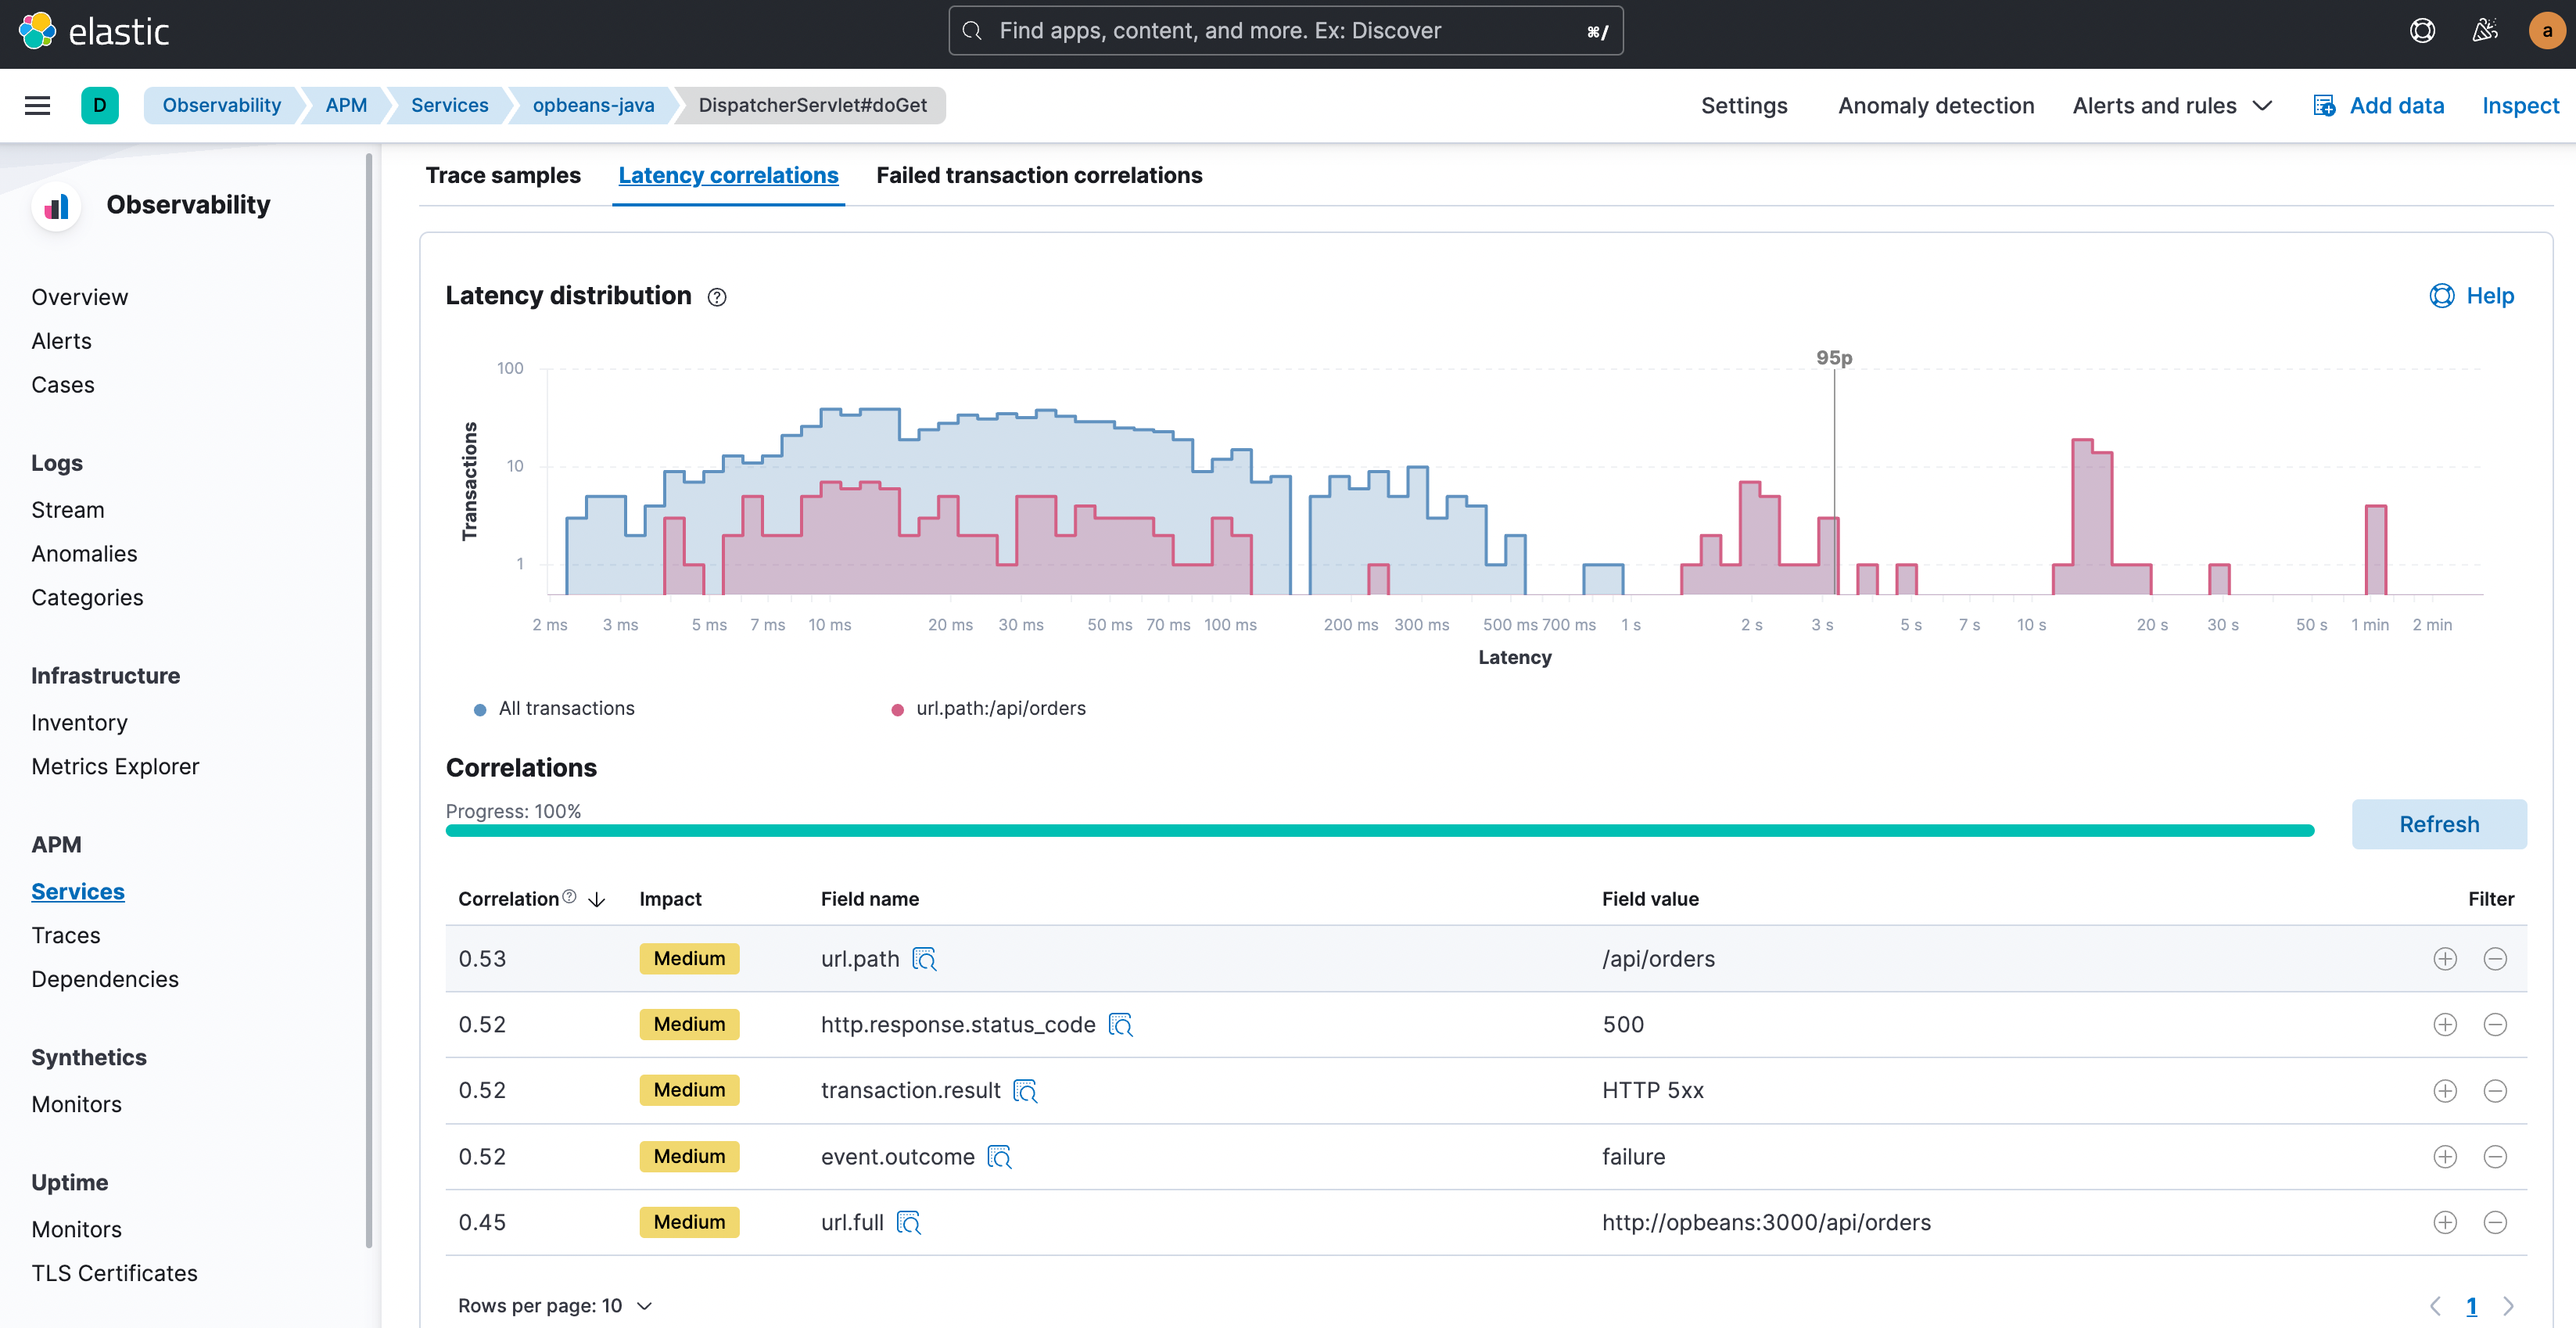
With those correlating factors identified, you can now narrow down your focus to just those transactions. Click the filter “+” or “-” buttons to select only transactions with this attribute value or to exclude such transactions and study the transactions of interest in further detail. A typical next step for latency might be to look at trace samples for just those high latency transactions that also carry the identified correlating attributes, and get to that ‘Aha!’ moment where you see the culprit: a slow function call in the traces.
Once that root cause is confirmed, you can start the remediation and recovery process through mechanisms such as rollbacks, software patching, or upgrades.
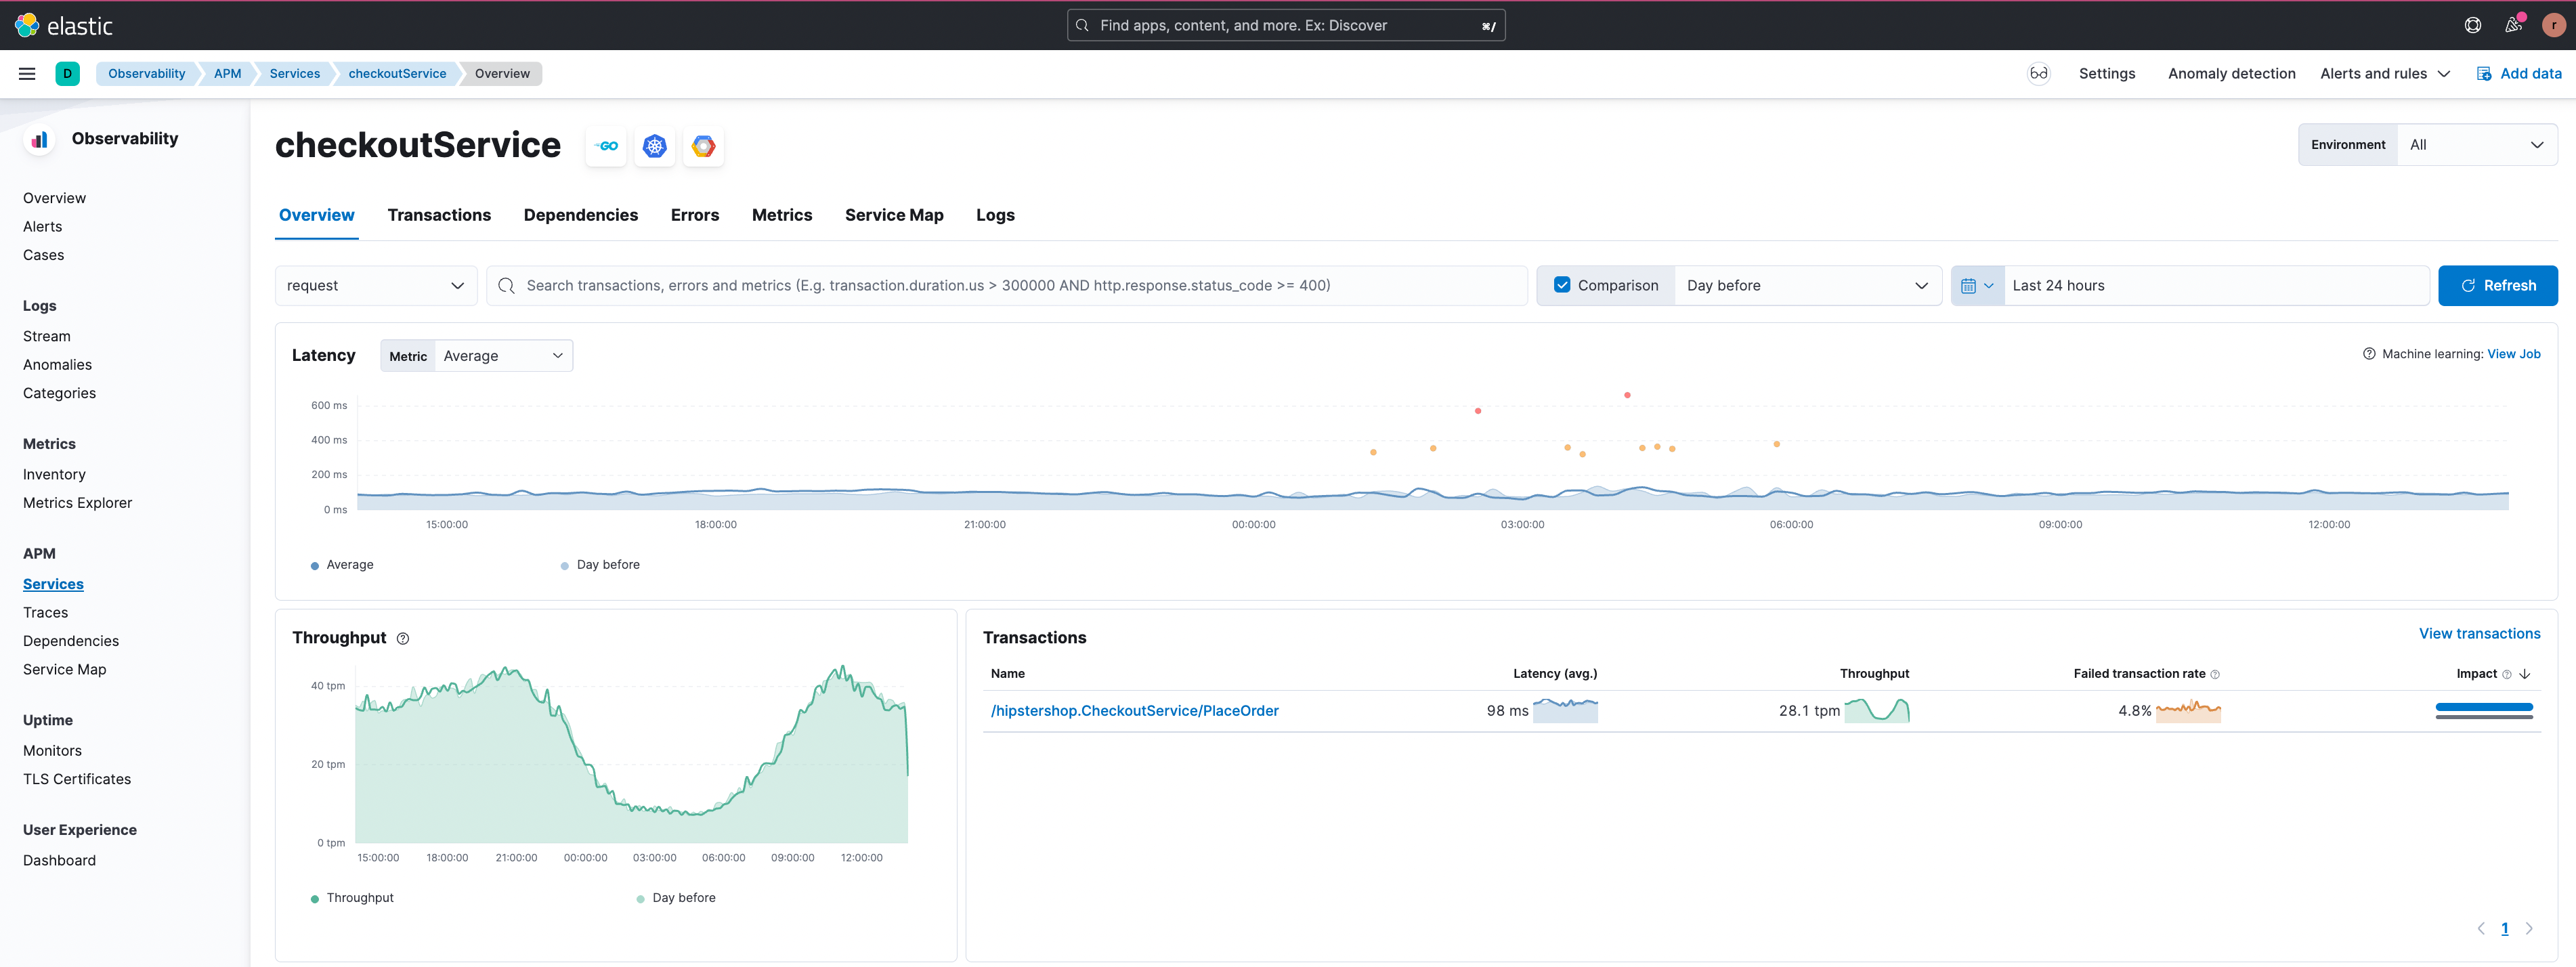
Let’s consider the scenario of failed transactions next. In the example below, the ‘/hipstershop.CheckoutService/PlaceOrder’ transactions group in the ‘checkoutService’ is experiencing a high failed transactions rate.
The failed transactions correlation feature shows failing transactions for users from South America in the figure below.
By clicking the filter “+” it is possible to focus on this particular subset of transactions and an example transaction with the error is shown.
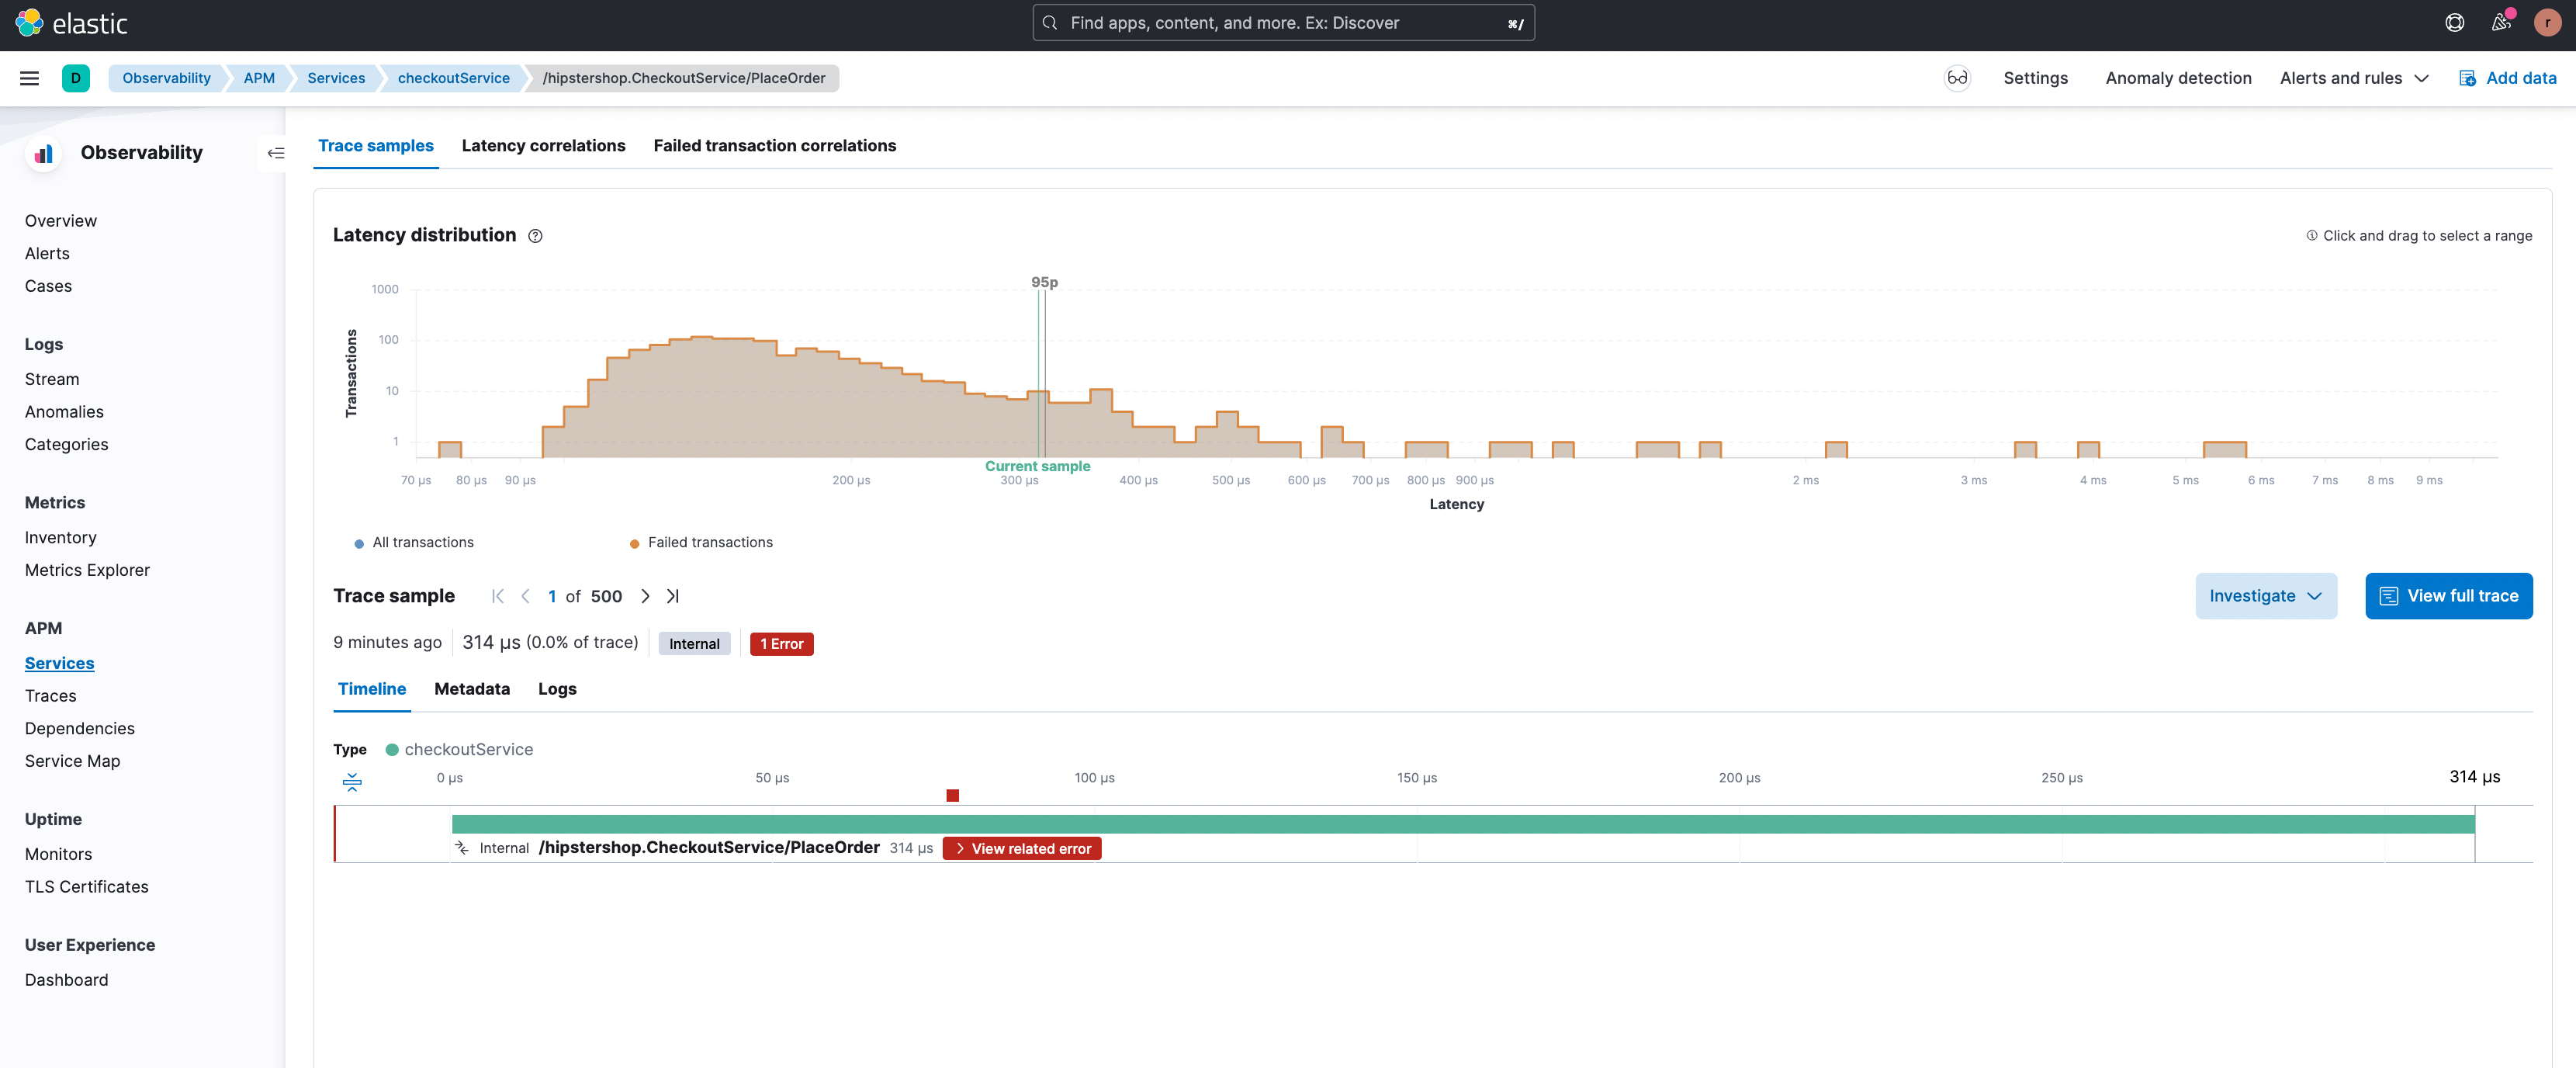
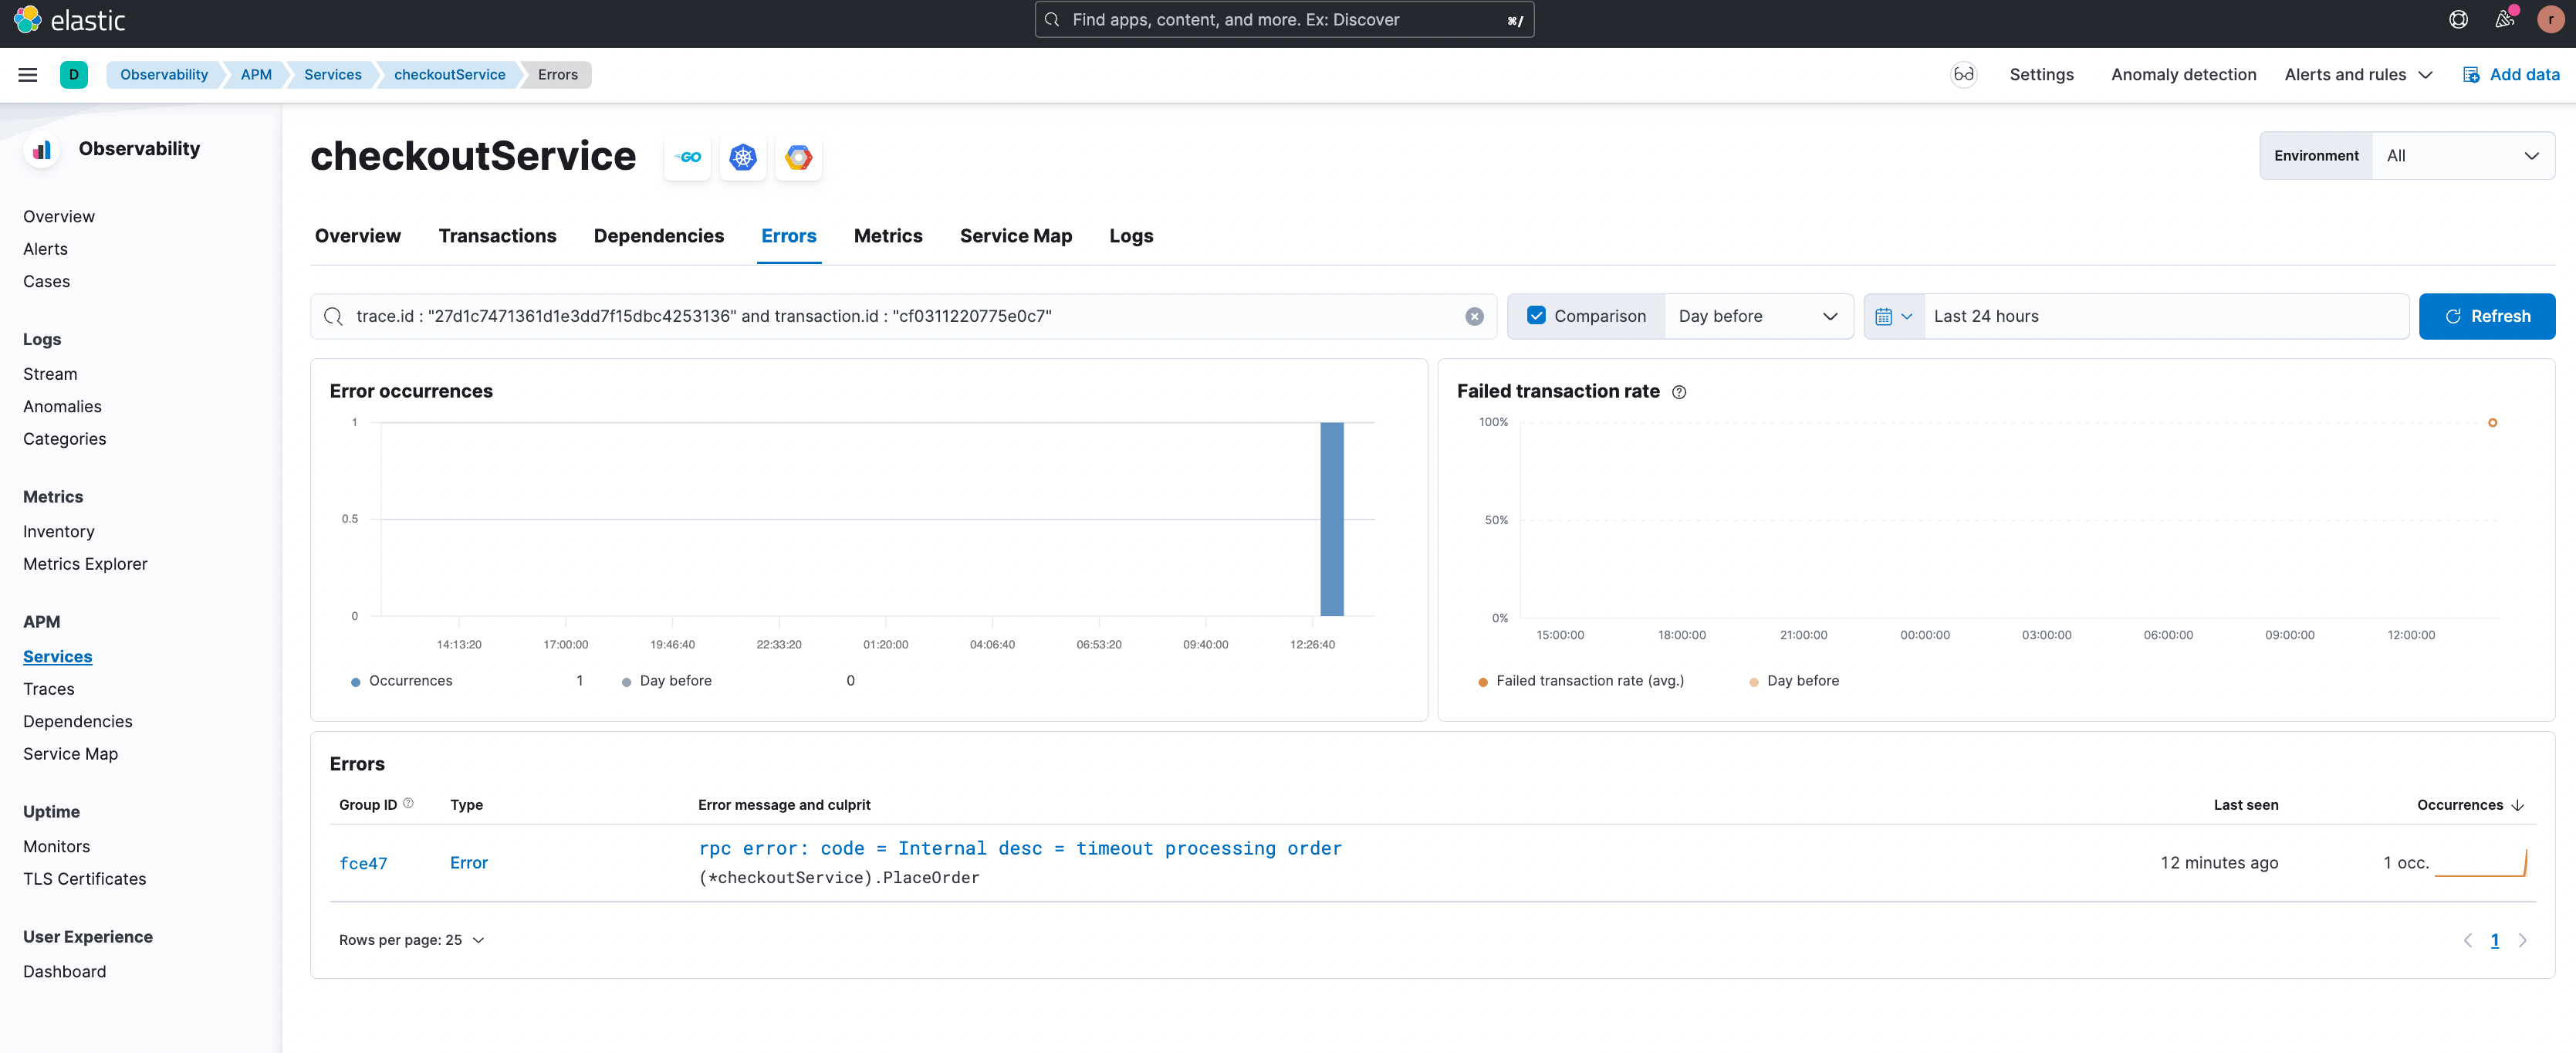
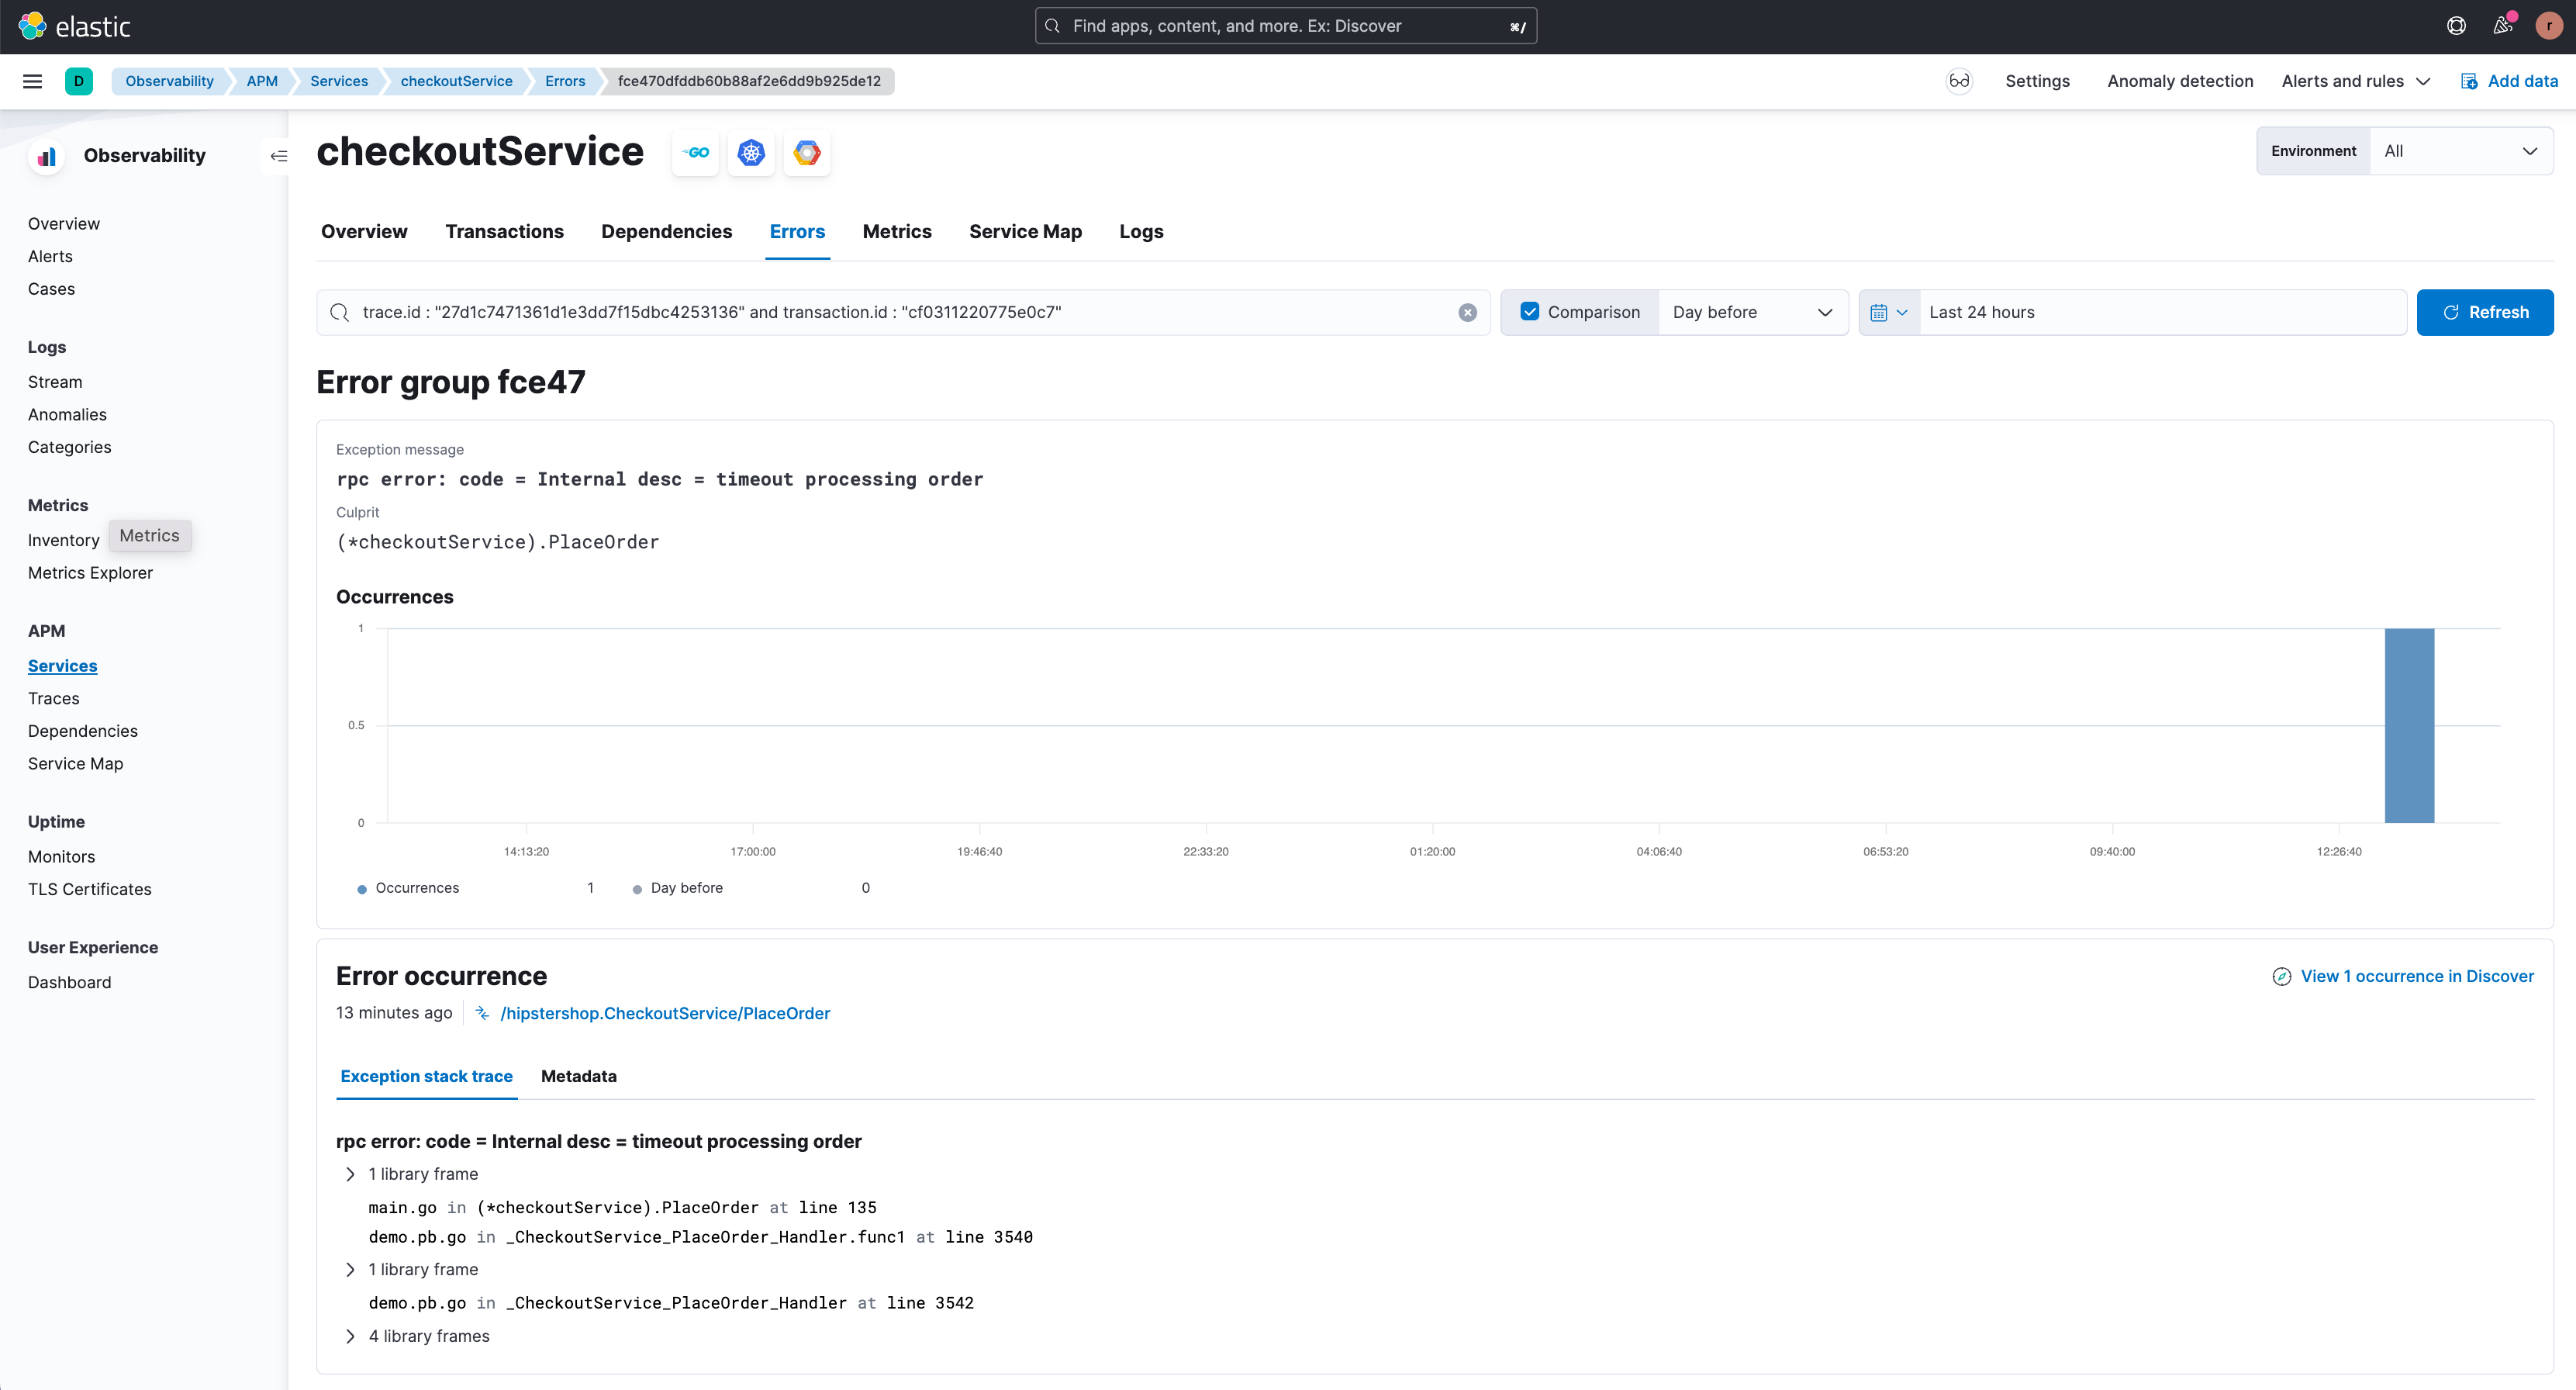
By clicking on ‘View related error’ the user is redirected to the relevant error details page (shown below) where the different types of errors associated with this endpoint are highlighted. The stack trace for an error occurrence is also available here providing enhanced debugging information.
From the examples above it can be seen that the APM correlations feature does the heavy lifting for the user in terms of narrowing down group(s) of transactions that are slow or erroneous. As a result, mean time to detect and time to issue resolution are significantly reduced.
Inputs and data needed to aid correlations
The APM Correlations capability can significantly speed up root cause analysis with issues affecting only a segment of the population. The more metadata there is to describe the apps, services, transactions, infrastructure, and clients, the richer the analysis and the higher the probability of finding attributes that crisply explain suboptimal transactions. The correlations feature utilizes all fields and labels that are present in the data.
Use the “Add Integrations” workflow from the Overview page to add agent capabilities and/or data ingestion for the various applications, infrastructure, and dependencies deployed in your environment. Note that you can also integrate natively with several technologies including cloud-native environments such as cloud-based Kubernetes and serverless technologies like Lambda. Once you’ve identified the various telemetry sources, you can further enrich the incoming data via Logstash or directly via the APM agent. Elastic also has seamless integration with and comprehensive, native support for OpenTelemetry data (which in turn also supports manual instrumentation).
Client-side information can be brought in via real-user monitoring (RUM) data. Distributed tracing is enabled by default when using the Elastic RUM agent, and tracing for cross-origin requests and propagation of tracestate can be easily configured by setting the distributedTracingOrigins configuration option. Coupled with APM this way, RUM adds rich client-side information such as browser versions, client OS, and user context and all that data is automatically included in the correlation determination.
With this data flowing into Elastic, APM correlations can then get to work, providing crisp and clear investigative insights, along with cutting down time to determine root cause in many situations.
Situations where APM correlations can drastically reduce time to root cause determination
Almost by definition, there’s no fixed set of complex problems for which a specific feature can provide all answers with certainty. After all, many APM problems are deemed complex precisely because there are multiple unknowns going into the investigation. Otherwise with only a few known issues, we would know exactly what to look for and those problems would not be complex anymore!
For many complex investigations though, APM correlations can become a vital part of your investigatory toolkit to quickly narrow down focus to specific areas of your deployment and determine or validate the root cause. A key consideration is: is your problem affecting your entire deployment or only some subpopulations? For example, do you see all transactions suffering from high latency? Or do you see a fraction of transactions exhibiting high latency while others seem to be running within expected bounds? When you notice that the problem is not pervasive, then you should consider using the APM correlations feature to see if a subset of attributes can help characterize the transactions of interest. With those attributes, you can filter to a smaller, more manageable set of transactions and check their traces to reveal the root cause, or view infrastructure dependencies contributing to transaction performance issues.
Examples of situations where we’ve seen APM correlations to be particularly effective are:
Hardware performance issues: especially in load-balanced cases where certain loads are being serviced by certain hardware, hardware performance degradation can in turn result in certain groups of users or certain parts of an application to experience higher latency. APM correlations can help quickly isolate those specific instances of hardware via labels and identifiers.
Input data utilized:
- Global labels from the APM agent collected in the distributed traces
- Infrastructure metrics from Elastic Agent or metricbeat, to be able to continue investigating after utilizing the APM correlations feature
Hyperscaler tenancy or multi-cloud deployment related issues: hyperscalers add another layer of complexity to application deployments. Multi-cloud and hybrid cloud deployments are increasingly common. When troubleshooting issues that are only impacting some parts of an application, hyperscaler labels and tags (for example, cloud metadata) help detect which instances, cloud providers, regions, or availability zones are linked to the issue. The Elastic Java APM Agent allows auto-detection of the cloud provider using configuration variables.
Input data utilized (automatically collected by APM agent):
- Cloud availability zone
- Cloud region
Geo or user-group specific issues: tags identifying specific geolocations or user groups can be surfaced through APM correlations and can be used to isolate a user segment and study just those transactions. For example, the Elastic Java APM Agent supports global labels, which are utilized by this feature, so they can help provide additional context and identify a subset of the population. Elastic APM Agents, such as the Java APM Agent, support configuration of global labels, which can be used to add additional meta information to all events. Global labels are added to transactions, metrics, and errors. Similarly, the Java APM Agent API allows manual instrumentation of transactions that can be used to extract geo or user group information. These labels can help focus on important or new classes/methods in the service that can speed up root cause analysis, validation of hypotheses, etc.
Input data utilized:
- Cloud metadata (automatically collected by APM agent)
- Global labels, to optionally add meta information to events
- Any data added via manual instrumentation
Canary or other partial deployment related problems: in enterprise application deployments, and especially in SaaS delivered applications, it’s not uncommon to have multiple versions of your software running concurrently. Canary rollouts or A/B testing strategies, are examples of concurrent multi-version deployments. When a specific version of the application misbehaves, APM correlation can help bubble up the errant version, narrowing the scope of the problem and leading to faster root cause determination. The service version can be configured either via auto-detection or by using an environment variable, for example in the Elastic Java APM agent.
Input data utilized:
- Service version, through auto detection or from APM agent
Client-side problems: client-side indicators such as specific browser versions or device types immediately help narrow down the scope and the potential cause, providing valuable root cause information for further analysis, resolution, and remediation.
Input data utilized:
- Client data automatically collected via Elastic RUM Agent, such as browser and OS version, device details, network type, etc
Issues with third-party service providers: in scenarios where third-party providers such as authentication service providers are being used, APM correlations help identify issues pertaining to a specific provider quickly. This can be done by using an SDK (Elastic or OTel) for adding custom labels to identify authentication providers. Custom labels can be useful in other similar scenarios where auto-instrumentation alone will not be sufficient to provide the relevant context required to facilitate root cause analysis.
Input data utilized:
- Custom labels added via Elastic or OTel SDK
- Global labels
… and many more use cases, you get the drift. Correlations work for complex problems that impact some parts of your service, while other parts of your service seem to be running smoothly.
On the flip side, there are certain situations where APM correlations might not yield the best results. Examples include pervasive problems that occur throughout your application service(s) as opposed to specific smaller subpopulations or segments. In such situations, many different tags, labels, or indicators might all be highly correlated with the suboptimal transactions, providing little value to further your investigation. And finally, if the relevant data is not present or does not have enough descriptors and labels, the correlation might not be detected at all. Please see the previous section on inputs and data to aid correlations.
For many of your APM investigations though, the APM correlations feature is a powerful tool that can help quickly narrow down investigations to specific groups of transactions.In many cases those correlated transactions will lead you quickly to root cause, drastically reducing investigation time.
Happy troubleshooting!
Additional resources and information
The APM Correlations feature is generally available starting 7.15. Click here to review the release notes around the feature. A user guide and documentation for the APM Correlations feature is available here.
Share
- Share on Twitter
Share on Twitter
- Share on LinkedIn
Share on LinkedIn
- Share on Facebook
Share on Facebook
- Share by Email
Share by Email
- Print this page
Print