Get hands-on with Elasticsearch: Dive into our sample notebooks in the Elasticsearch Labs repo, start a free cloud trial, or try Elastic on your local machine now.
Kibana tracks how many times each dashboard is viewed, but that data isn’t exposed natively in any built-in dashboard. In this article, we’ll use Elastic Workflows to automatically collect that data every 30 minutes and index it into Elasticsearch, so we can build our own analytics on top of it.
Elastic Workflows is a built-in automation engine inside Kibana that lets you define multistep processes using a simple YAML configuration. Each workflow can be triggered on a schedule or event or as a tool in Elastic Agent Builder, and each step can call Kibana APIs, query Elasticsearch, or transform data.
We’ll use dashboard view counts as a concrete example, but the same pattern applies to any metric exposed through the Kibana saved objects API.
Prerequisites
- Elastic Cloud or self-managed cluster running 9.3
- Workflows enabled (Advanced settings)
Step 1: Explore the raw data in
Before building anything, let's understand what data we have. Kibana stores most of its configuration and metadata as saved objects in a dedicated internal index. One of the things Kibana tracks this way is dashboard view counts, using a special saved object type called usage counters. You can query them directly from Dev Tools:
The response looks like this:
The counterName field is the dashboard ID, and count is the cumulative view count for that dashboard on that specific day. Kibana creates one counter object per dashboard per day; you can see the date suffix in the object ID (...viewed:server:20260310). The count grows throughout the day as users open the dashboard.
Rather than replicating this daily-document model in our index, we’ll create one document per workflow execution. Each document records how many views that dashboard had accumulated for the day at the moment of capture.
Step 2: Create the destination index
We need an index to store our dashboard view snapshots. The following command creates it with explicit mappings so we can aggregate and visualize later. Run this in Dev Tools:
Using keyword mappings for IDs and names allows aggregations. Using integer for view_count is a safe default, since Kibana resets the counter daily, reaching the 32-bit limit (more than 2 billion views in a single day) isn’t a realistic concern. It still supports numeric operations, like max, avg, and min among others.
Step 3: Create the workflow
Go to Stack Management > Workflows > New Workflow, and paste the following workflow YAML configuration:
In the next section, let's break down the workflow step by step.
How the workflow works
Triggers
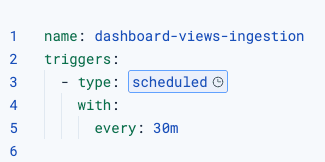
The workflow runs on a scheduled trigger every 30 minutes. This gives us time-series data without hammering the API.
fetch_dashboard_views
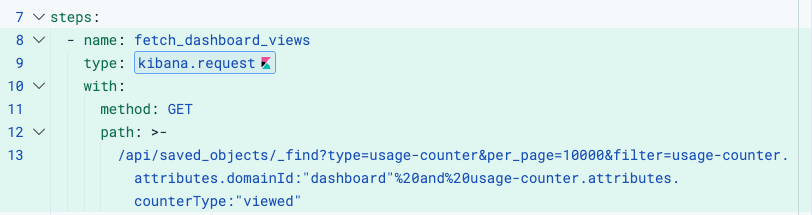
Uses kibana.request to call the Kibana saved objects API. No authentication setup is needed: The workflow engine automatically attaches the correct headers based on the execution context.
index_each_dashboard (foreach)
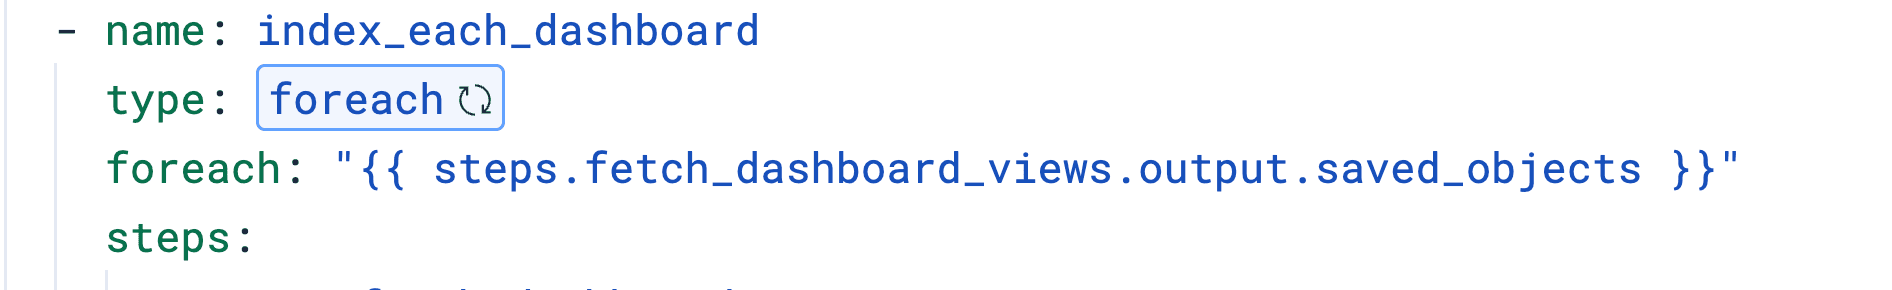
Iterates over the saved_objects array returned by the previous step. The current item in each iteration is available as foreach.item. Inside the loop, we run two nested steps for each dashboard.
1. fetch_dashboard_name:
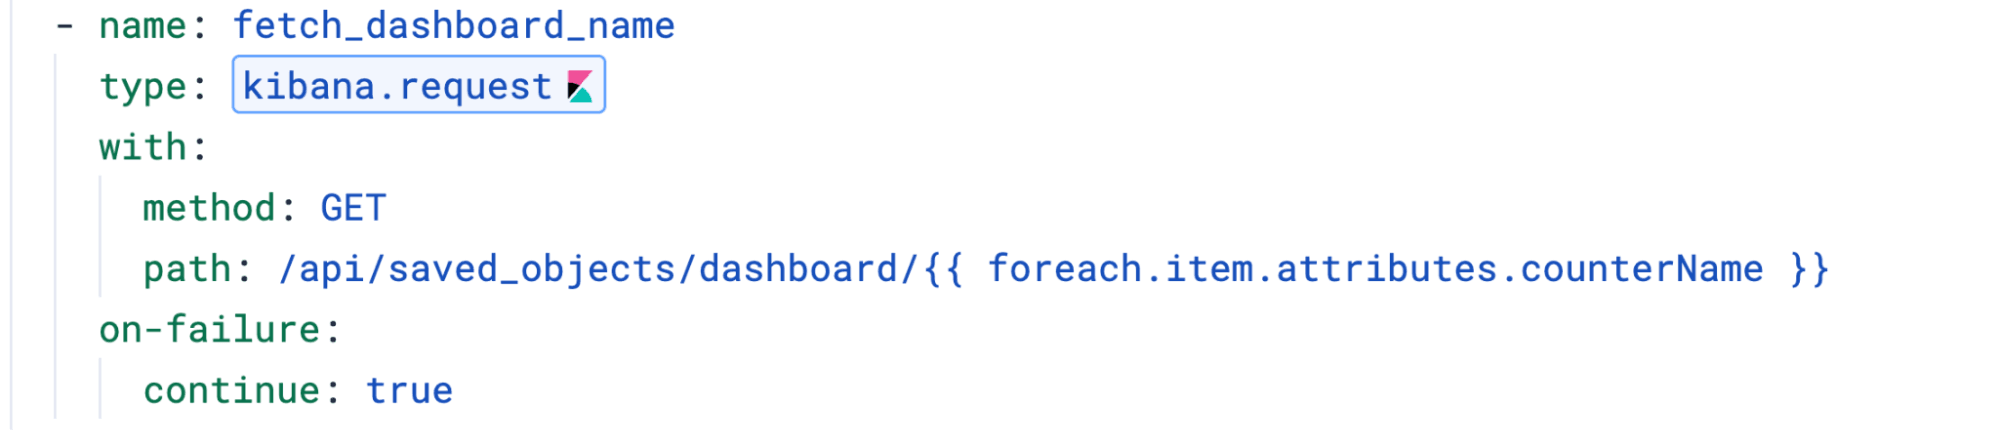
Resolves the human-readable dashboard title by calling GET /api/saved_objects/dashboard/{id}. We add on-failure: continue: true so that if a dashboard was deleted but still has view counters, the loop continues instead of failing the whole execution.
2. index_doc:
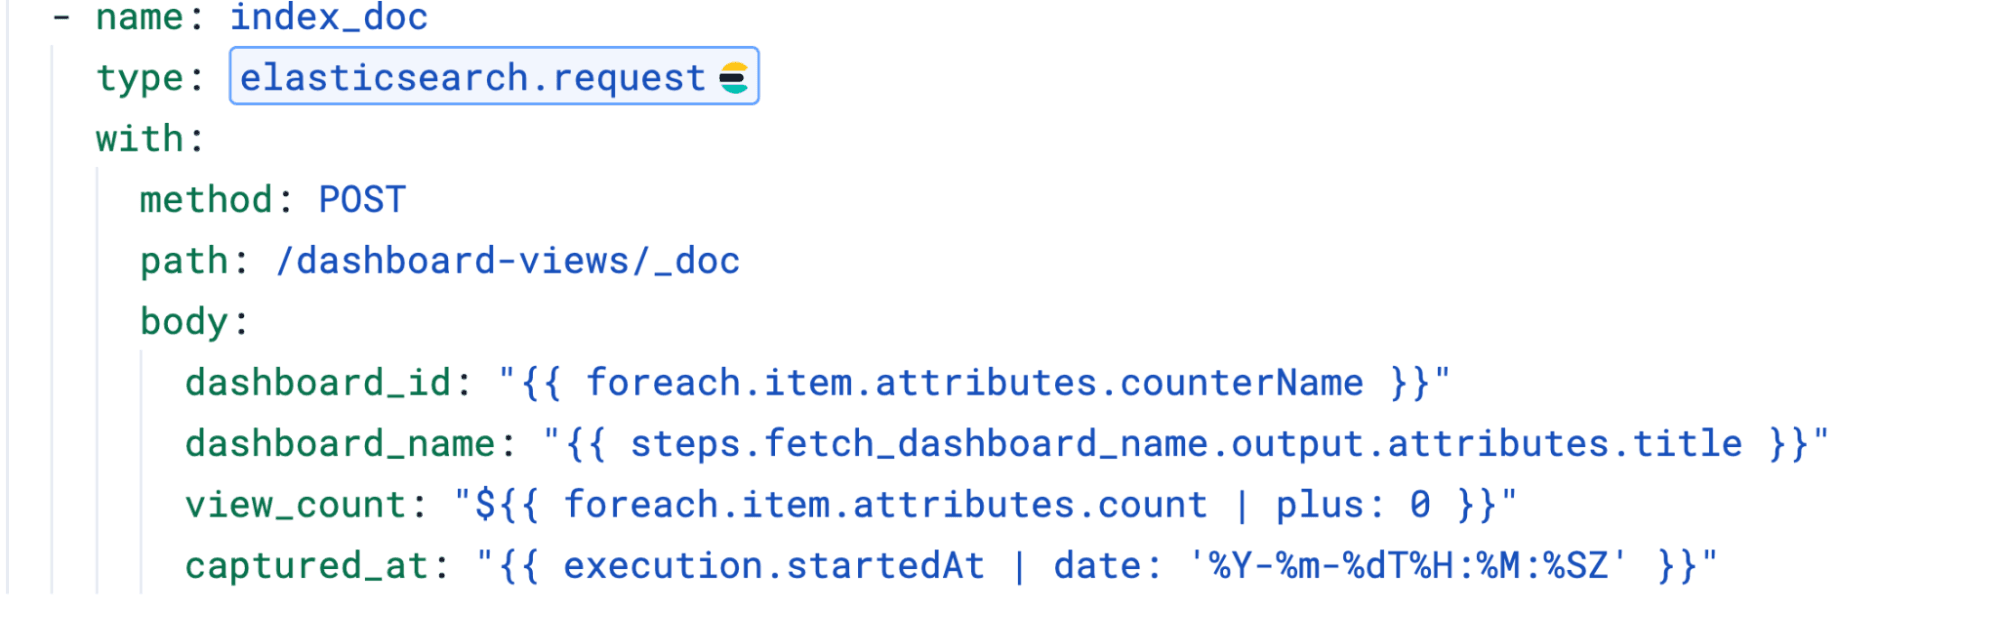
Indexes each document using POST /dashboard-views/_doc (without an explicit ID), which lets Elasticsearch auto-generate IDs. This creates a new document on every run, building a history of view counts over time rather than overwriting the previous snapshot.
Two things worth noting:
- The
captured_atfield uses the date filter to format the timestamp as ISO 8601. Without it, the value comes out as a JavaScript date string, likeTue Mar 10 2026 05:03:47 GMT+0000, which Elasticsearch won't map as a date. - The
view_countuses${{ }}syntax with| plus: 0to preserve the numeric type. Using{{ }}would render it as a string, which would prevent math operations in the dashboard.
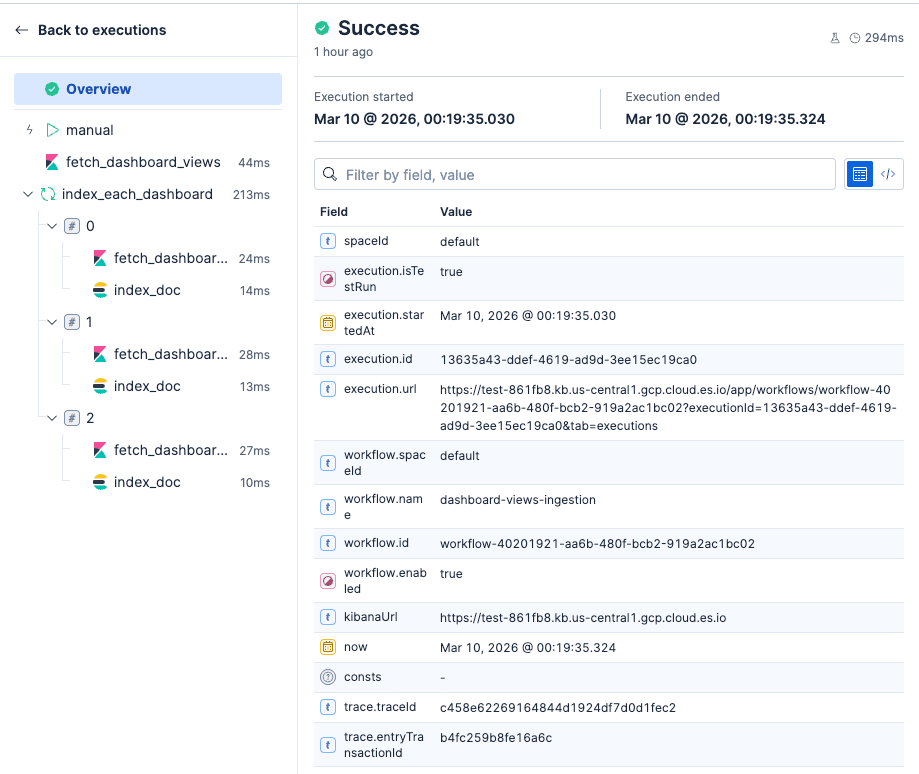
The UI allows you to nicely debug each of the workflow steps.
Step 4: Build the stats dashboard
Once the workflow has run a few times and data is collected, create a new dashboard in Kibana using the dashboard-views data view.
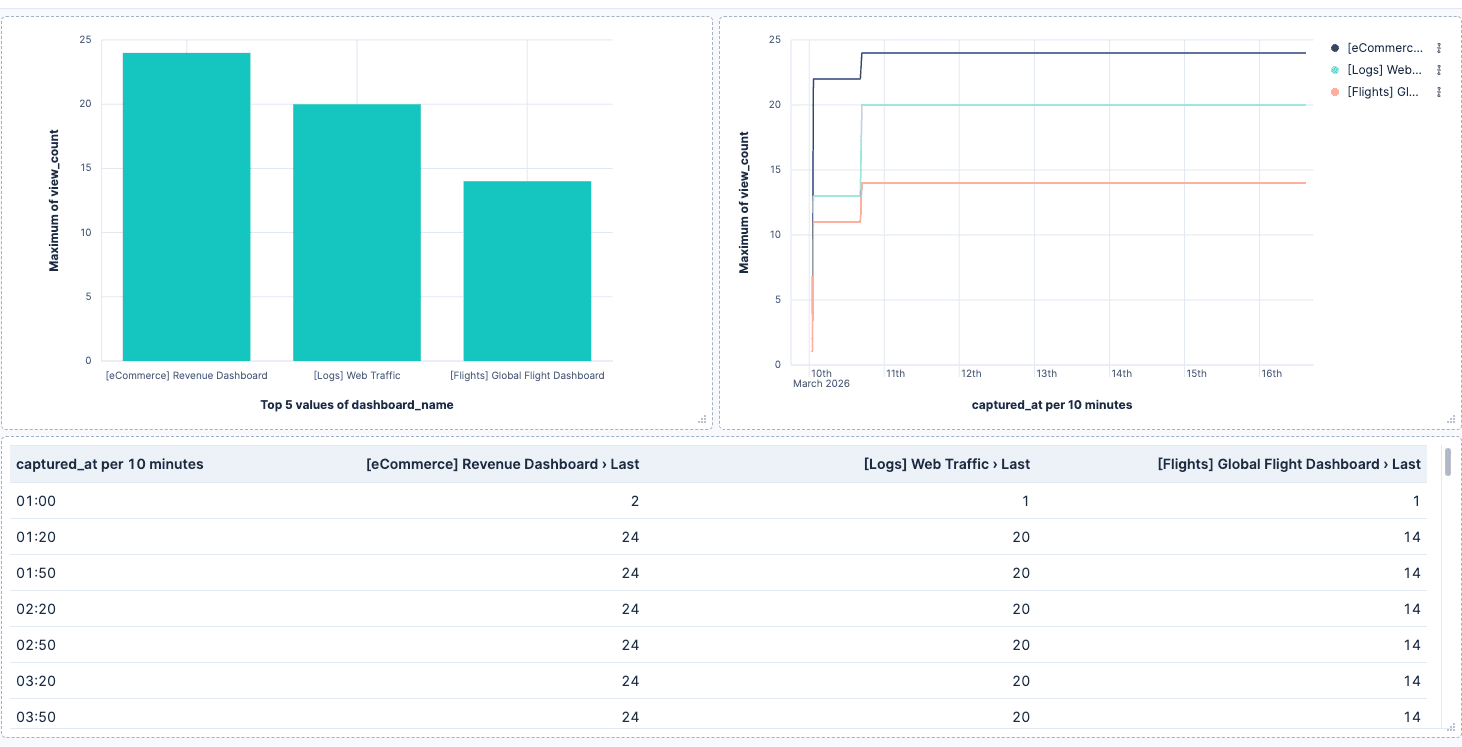
Some panels to start with:
- Top dashboards by views: Use a Bar chart with
dashboard_nameon the X axis andlast_value(view_count)on the Y axis. This shows the current daily view count per dashboard. - Views over time: Use a Line chart with
captured_aton the X axis andlast_value(view_count)on the Y axis, broken down bydashboard_name. Since each run appends a new document, use last value to get the peak count per time bucket rather than summing duplicates. - Current snapshot: Use a Data table with the latest
captured_atto show the most recent view counts across all dashboards.
Since each workflow creates a new document, you can filter by time range to analyze activity in specific periods, compare week over week, or build alerts when a dashboard drops below a view threshold.
Conclusion
Elastic Workflows is a good fit for this kind of periodic data collection because both the source (Kibana API) and the destination (Elasticsearch) are native, which means zero credential management. The workflow engine handles authentication automatically for kibana.request and elasticsearch.request steps, so the only thing you write is the logic.
Resources
Related Content

July 1, 2026
One command. Natural language. Your Elasticsearch data, straight to the terminal.
Query your Elasticsearch data from the terminal in plain English. The official Elastic GitHub Copilot CLI plugin generates and runs ES|QL queries against your cluster. No Kibana, no manual syntax.

April 20, 2026
Introducing unified API keys for Elastic Cloud Serverless and Elasticsearch
Learn how Elastic unified control plane and data plane authentication in Serverless with a globally distributed IAM architecture. Use one API key for Cloud and Elasticsearch APIs.
April 14, 2026
How big is too big? Elasticsearch sizing best practices
There’s no hard size limit in Elasticsearch, but there are clear signals you've outgrown your setup. Learn how to size shards, manage node limits, choose storage by tier, and use AutoOps to catch problems before they happen.

February 19, 2026
Dependency management on Kubernetes
How to streamline dependency management on Kubernetes using Renovate CLI and Argo Workflows.

February 2, 2026
Cookbook for a production-grade generative AI sandbox
Exploring the recipe for a generative AI sandbox, giving developers a secure environment to deploy application prototypes while enabling privacy and innovation.