Kibana는 각 대시보드의 조회수를 추적하지만 해당 데이터는 기본으로 제공되는 대시보드 내에서 직접적으로 확인할 수는 없습니다. 이 글에서는 Elastic Workflows를 사용하여 30분마다 해당 데이터를 자동으로 수집하고 Elasticsearch에 인덱싱하고 이를 바탕으로 직접 분석 환경을 구축하는 방법을 알아보겠습니다.
Elastic Workflows는 Kibana에 내장된 자동화 엔진입니다. 간단한 YAML 설정을 통해 여러 단계로 구성된 프로세스를 정의할 수 있습니다. 각 워크플로우는 일정 또는 이벤트에 따라 트리거될 수 있으며 Elastic Agent Builder의 도구로 활용할 수 있습니다. 또한 각 단계에서 Kibana API 호출, Elasticsearch 쿼리 실행, 데이터 변환 작업을 수행할 수 있습니다.
여기서는 대시보드 조회수를 구체적인 예로 사용하지만 Kibana saved objects API를 통해 노출되는 모든 메트릭에 동일한 패턴을 적용할 수 있습니다.
필수 구성 요소
- 9.3 버전이 실행 중인 Elastic Cloud 또는 자체 관리형 클러스터
- 워크플로우 기능 활성화(고급 설정)
본격적인 구축에 앞서 우리가 활용할 데이터가 어떤 구성을 갖추고 있는지 먼저 이해해 봅시다. Kibana는 대부분의 설정 정보와 메타데이터를 전용 내부 인덱스에 Saved Objects라는 형태로 저장합니다. Kibana가 이러한 방식으로 추적하는 항목 중 하나는 대시보드 조회수입니다. 이때 'Usage Counters'라는 특수한 유형의 Saved Object를 사용하게 됩니다. 다음과 같이 Dev Tools에서 직접 쿼리할 수 있습니다.
응답은 다음과 같습니다.
counterName 필드는 대시보드의 ID를 나타내며 count는 해당 특정 날짜의 대시보드 누적 조회수입니다. Kibana는 대시보드당 하루에 하나의 카운터 객체를 생성합니다. 객체 ID의 날짜 접미사(예: ...viewed:server:20260310)를 통해 이를 확인할 수 있습니다. 조회수는 사용자가 대시보드를 열 때마다 하루 동안 계속해서 증가합니다.
인덱스에 이러한 일일 문서 모델을 그대로 복제하는 대신 워크플로우 실행당 하나의 문서를 생성해 보겠습니다. 각 문서는 캡처 시점을 기준으로 해당 대시보드의 당일 누적 조회수를 기록합니다.
2단계: 대상 인덱스 생성
대시보드 조회 스냅샷을 저장할 인덱스가 필요합니다. 나중에 집계와 시각화가 가능하도록 명시적 매핑을 사용하여 다음과 같이 인덱스를 생성합니다. Dev Tools에서 다음 명령을 실행하세요.
ID와 이름에 keyword 매핑을 사용하면 집계를 수행할 수 있습니다. view_count에 integer 타입을 사용하는 것은 안전한 기본값입니다. Kibana는 카운터를 매일 초기화하므로 32비트 제한(하루 20억 회 이상의 조회수)에 도달하는 것은 현실적인 우려 사항이 아니기 때문입니다. 이 타입은 여전히 max, avg, min과 같은 수치 연산을 지원합니다.
3단계: 워크플로우 생성
Stack Management > Workflows > New Workflow 메뉴로 이동한 뒤 아래의 워크플로우 YAML 설정 내용을 복사하여 붙여넣으세요.
다음 섹션에서는 워크플로를 단계별로 자세히 살펴봅니다.
워크플로우 작동 방식
트리거
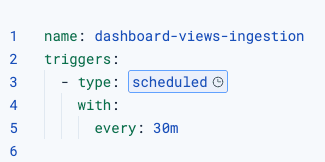
워크플로우는 30분 간격의 예약된 트리거에 따라 실행됩니다. 이를 통해 API에 무리를 주지 않으면서도 시계열 데이터를 확보할 수 있습니다.
fetch_dashboard_views
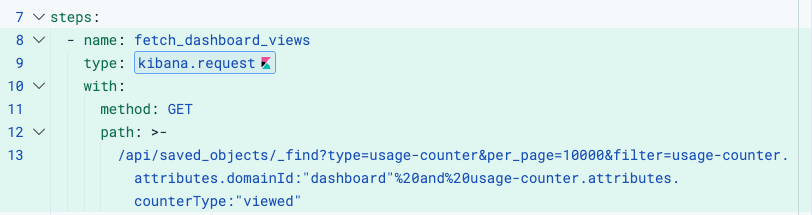
kibana.request를 사용하여 Kibana Saved Objects API를 호출합니다. 별도의 인증 설정은 필요하지 않습니다. 워크플로우 엔진이 실행 컨텍스트에 따라 적절한 헤더를 자동으로 첨부하기 때문입니다.
index_each_dashboard (foreach)
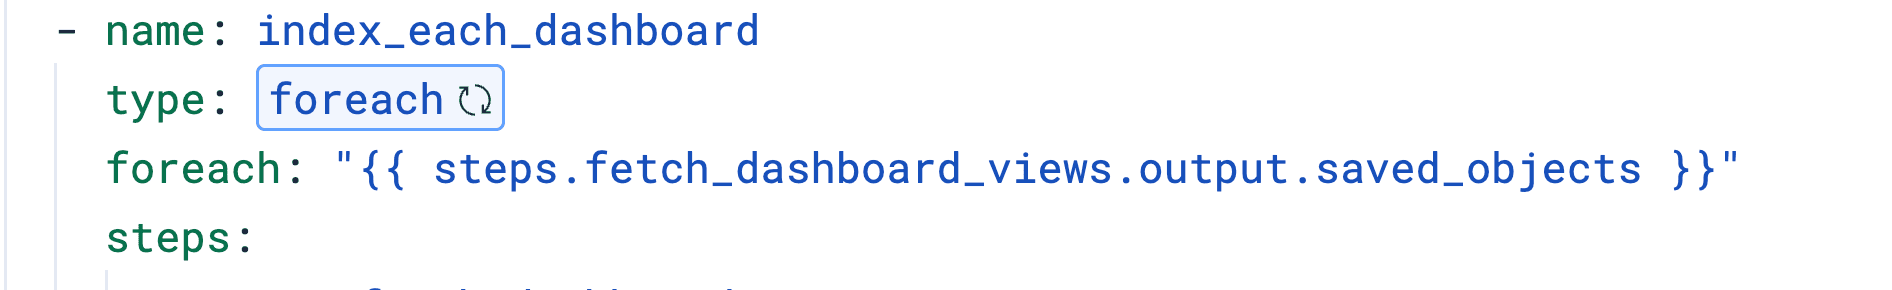
이전 단계에서 반환된 saved_objects 배열을 순회합니다. 각 반복에서 현재 항목은 foreach.item을 통해 접근할 수 있습니다. 루프 내부에서는 각 대시보드에 대해 두 개의 하위 단계를 실행합니다.
1. fetch_dashboard_name:
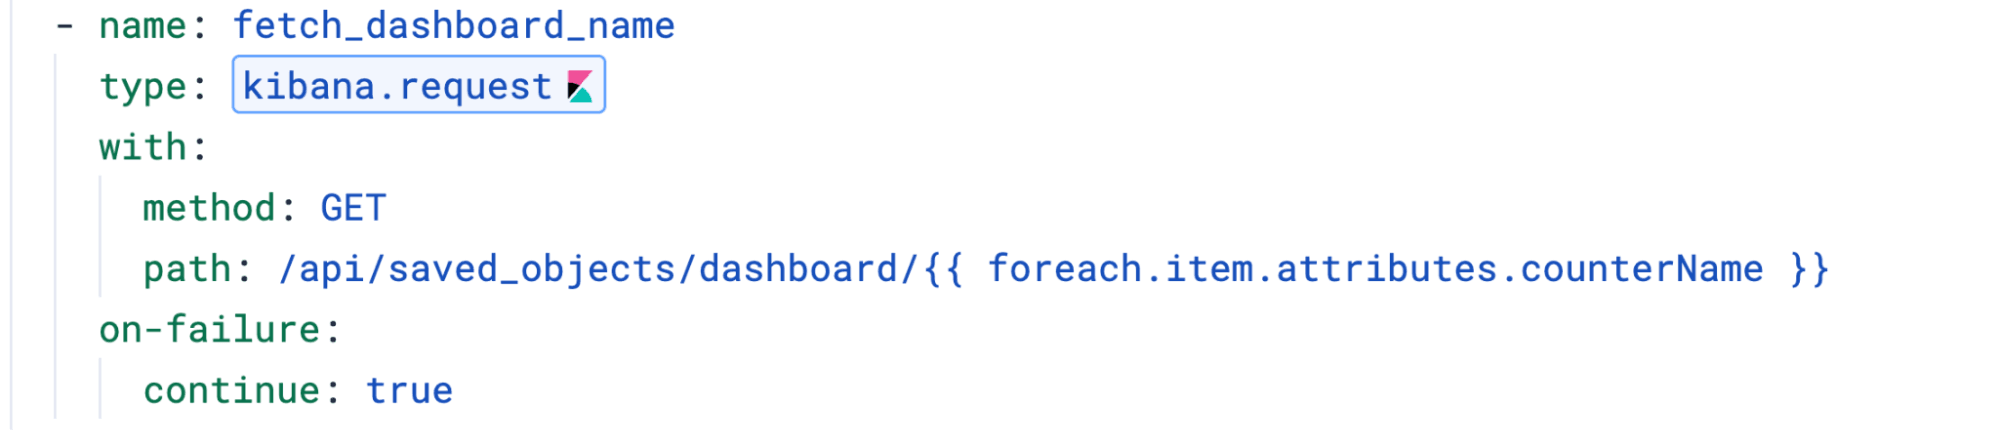
GET /api/saved_objects/dashboard/{id}를 호출하여 사용자가 읽을 수 있는 대시보드 제목을 확인합니다. on-failure: continue: true설정을 추가합니다. 이를 통해 특정 대시보드가 삭제되었더라도 조회수 카운터가 남아있는 경우 전체 실행이 실패 처리되지 않고 루프가 계속 지속됩니다.
2. index_doc:
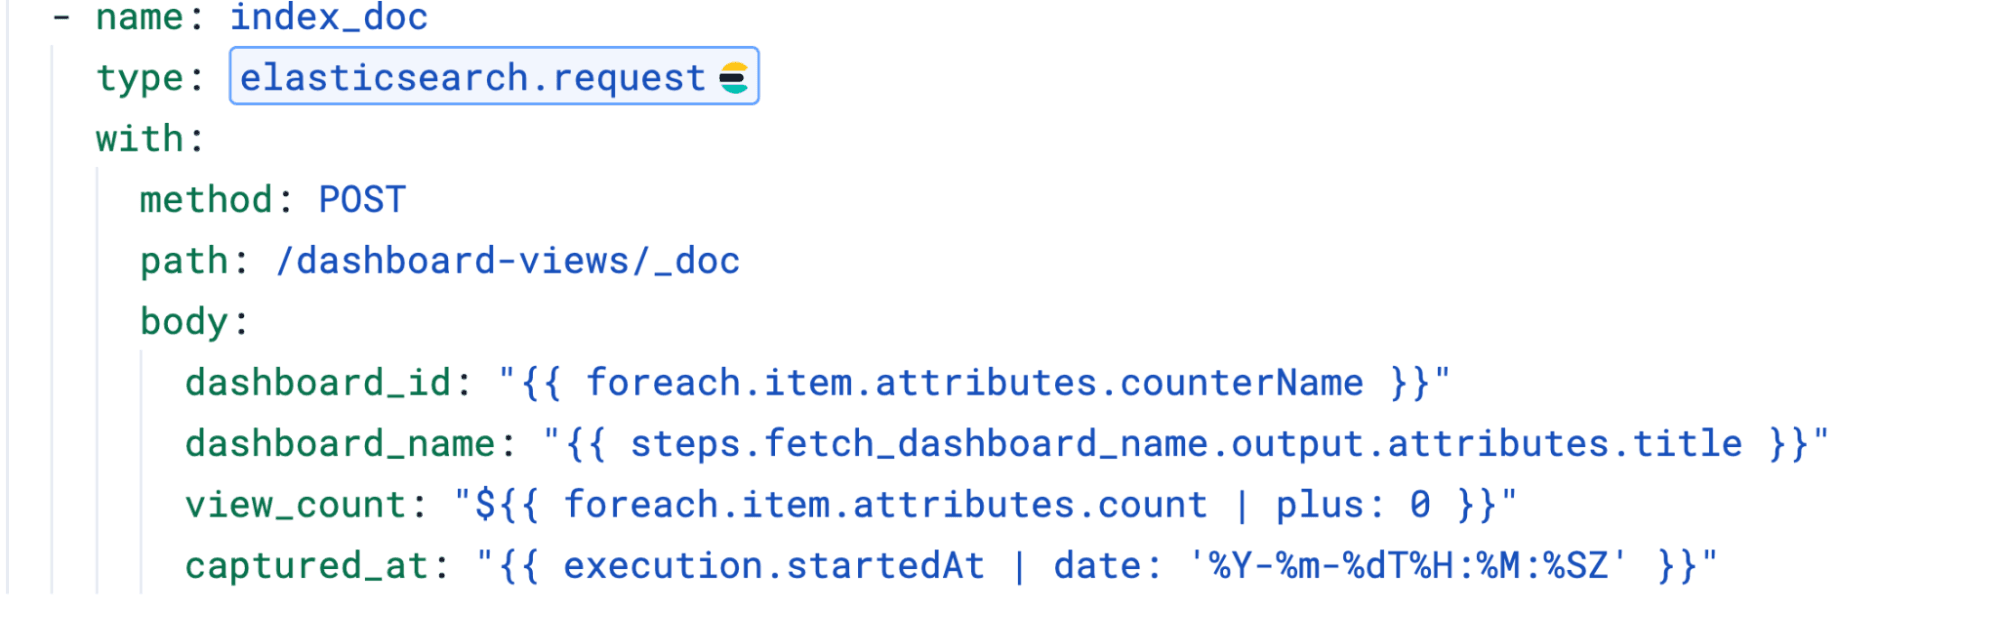
POST /dashboard-views/_doc을 사용해 명시적 ID 없이 각 문서를 인덱싱하며 이 과정에서 Elasticsearch가 ID를 자동으로 생성합니다. 이는 실행할 때마다 새로운 문서를 생성합니다. 이전 스냅샷을 덮어쓰지 않고 시간에 따른 조회수 이력을 쌓을 수 있습니다.
주목할 만한 두 가지 사항이 있습니다:
captured_at필드는 날짜 필터를 사용하여 타임스탬프를 ISO 8601 형식으로 변환합니다. 이 설정이 없으면 값이Tue Mar 10 2026 05:03:47 GMT+0000과 같은 JavaScript 날짜 문자열로 출력됩니다. 이 경우 Elasticsearch가 이를 날짜 형식으로 매핑하지 못합니다.view_count는 숫자 유형을 유지하기 위해${{ }}구문과| plus: 0을 사용합니다. 단순히{{ }}를 사용하면 값이 문자열로 렌더링되어 대시보드에서 수치 연산을 수행할 수 없게 됩니다.
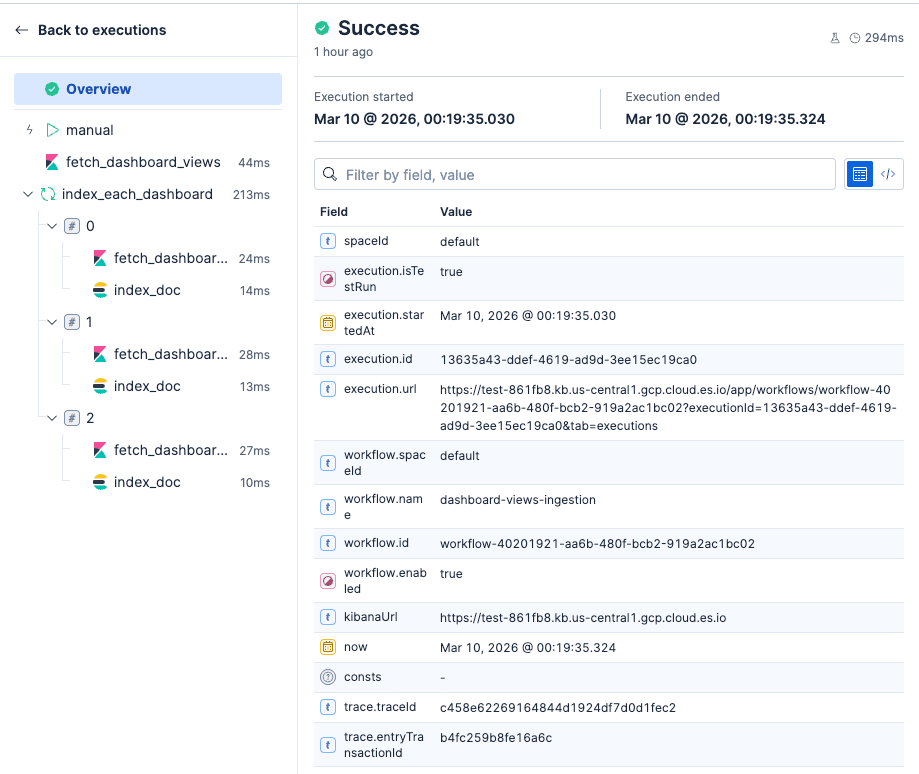
UI를 통해 워크플로의 각 단계를 편리하게 디버깅할 수 있습니다.
4단계: 통계 대시보드 구축
워크플로우가 몇 번 실행되어 데이터가 수집되면 dashboard-views 데이터 뷰를 사용하여 Kibana에서 새 대시보드를 만듭니다.
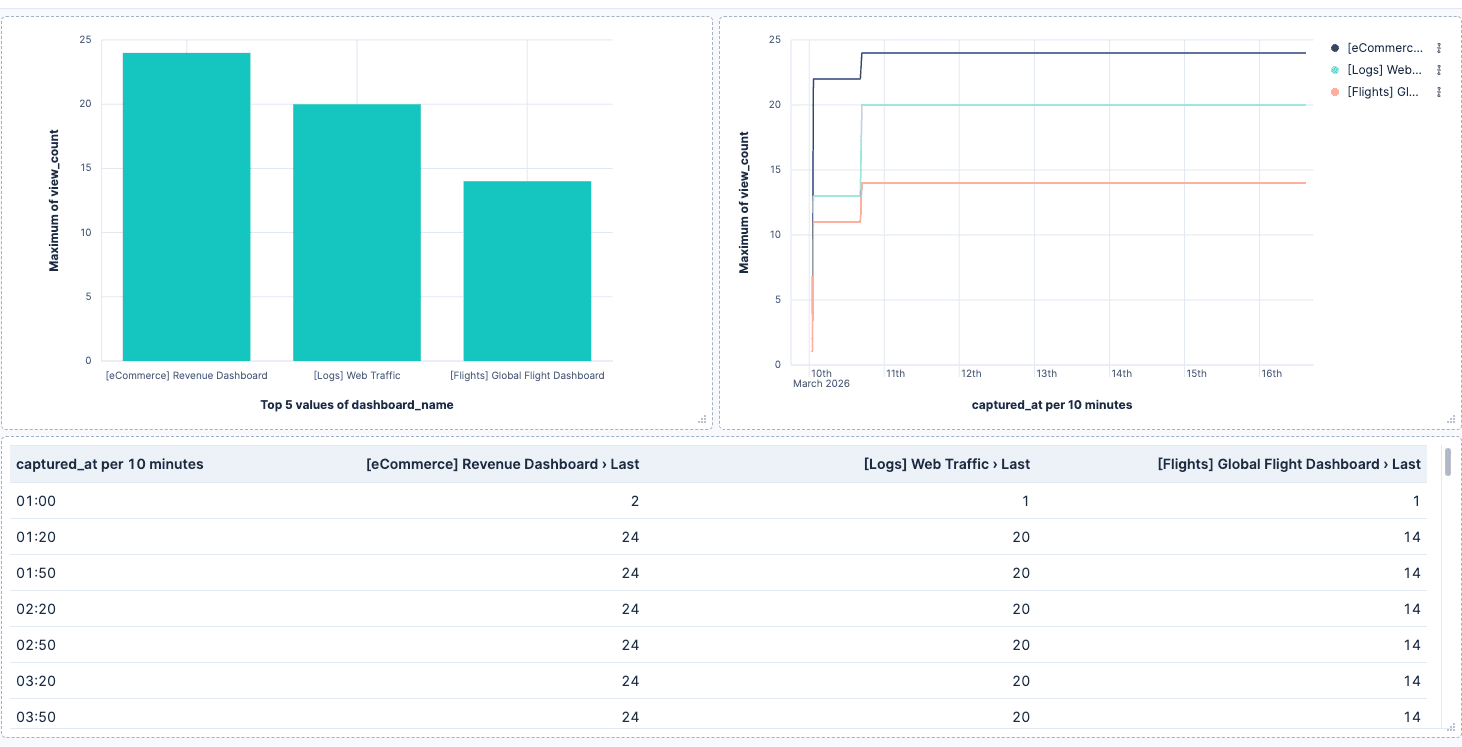
활용 가능한 패널 예시:
- 조회수별 주요 대시보드: X축에
dashboard_name을, Y축에last_value(view_count)를 설정한 막대 차트를 사용하세요. 이를 통해 각 대시보드의 현재 일일 조회수를 확인할 수 있습니다. - 시간에 따른 조회수 변화: X축에
captured_at을, Y축에last_value(view_count)를 설정하고dashboard_name으로 구분한 선형 차트를 사용하세요. 워크플로우를 실행할 때마다 새로운 문서가 추가되므로 중복 합산 대신 'Last value' 집계를 사용하여 시간 버킷당 최종 수치를 가져옵니다. - 현재 스냅샷: 가장 최근의
captured_at데이터를 사용하는 데이터 테이블을 만들어 모든 대시보드의 최신 조회수를 표시하세요.
각 워크플로우 실행 시마다 새 문서가 생성되므로 시간 범위를 필터링하여 특정 기간의 활동을 분석하거나 주간 단위로 비교할 수 있습니다. 또한 대시보드 조회수가 임계값 아래로 떨어질 때 알림을 구축할 수 있습니다.
결론
Elastic Workflows는 이러한 주기적인 데이터 수집에 매우 적합합니다. 데이터 소스(Kibana API)와 대상(Elasticsearch)이 모두 네이티브로 연결되어 있어 자격 증명을 별도로 관리할 필요가 없기 때문입니다. 워크플로우 엔진이 kibana.request 및 elasticsearch.request단계의 인증을 자동으로 처리하므로 사용자는 로직만 작성하면 됩니다.
리소스
관련 콘텐츠

2026년 4월 20일
Elastic Cloud Serverless 및 Elasticsearch용 통합 API 키 소개
Elastic이 글로벌 분산형 IAM 아키텍처를 통해 서버리스 환경에서 컨트롤 플레인과 데이터 플레인 인증을 어떻게 통합하는지 알아보세요. 클라우드 및 Elasticsearch API에 하나의 API 키를 사용하세요.


Kibana의 Elasticsearch 쿼리 규칙 UI 소개
Elasticsearch 쿼리 규칙 UI를 사용해 자연 순위에 영향을 주지 않고 Kibana에서 사용자 정의 가능한 규칙 세트를 사용해 검색 쿼리에서 문서를 추가하거나 제외하는 방법을 알아보세요.

Mastra와 Elasticsearch를 사용하여 시맨틱 리콜 기능을 갖춘 지식 에이전트 구축하기
메모리 및 정보 검색을 위한 벡터 저장소로 Mastra와 Elasticsearch를 사용해 시맨틱 리콜 기능을 갖춘 지식 에이전트를 구축하는 방법을 알아보세요.
2026년 5월 22일
Kibana 대시보드 로딩 속도 최대 25% 단축, 그 뒤에 숨겨진 폴링 최적화 전략
Kibana가 어떻게 지속적 폴링과 브라우저 단 HTTP/2 감지 기술을 활용해 대시보드 로딩 시간을 최대 25%까지 줄였는지, 그리고 HTTP/1 환경으로의 자동 폴백 기능은 어떻게 작동하는지 알아봅니다.