Get hands-on with Elasticsearch: Dive into our sample notebooks in the Elasticsearch Labs repo, start a free cloud trial, or try Elastic on your local machine now.
A year of work on time series data streams (TSDS) and Elasticsearch Query Language (ES|QL) has turned Elasticsearch into a metrics datastore that matches or beats Prometheus, Mimir, and ClickHouse on ingest, storage, and query performance.
Elasticsearch metrics now land at 3.75 bytes per data point for OpenTelemetry metrics, down from 25 bytes a year ago. Indexing throughput is up to 50% higher. Time series queries run up to 160x faster. That's what a year of work on TSDS and ES|QL looks like: a fully columnar metrics engine that stores and queries OpenTelemetry (OTel) and Prometheus data on the same platform as your logs, traces, and documents. If you’re curious to learn the detailed story, with architectural details and benchmarks, read How we rebuilt Elasticsearch as a leading columnar metrics datastore.
This post pulls together that work and the deep dives behind it into one place. A quick primer for what follows. TSDS are Elasticsearch's index mode for metrics: Enable it on an index, and Elasticsearch stores each document sorted by its time series, routes a given series to a single shard, and applies metrics-specific compression, with no manual tuning. ES|QL, Elasticsearch's piped query language, is how you read that data, and as of this work, it treats time series as a first-class data type. Everything below is about making TSDS smaller in footprint and faster to store and making ES|QL query it more efficiently.
The headline is simple: For TSDS, Elasticsearch is now a fully columnar metrics engine, in addition to the document store that most people picture. The same platform stores logs, traces, and documents next to your metrics, and ES|QL queries all of it.
How Elasticsearch stores metrics as columnar data
The columnar layout in Elasticsearch is built on four properties that TSDS has enforced since version 8.7:
- The metric name plus dimension names and values produce the
_tsid, a unique identifier per time series. - Data is sorted by
[_tsid ascending, @timestamp descending], so each time series sits contiguously on disk and dimension values cluster together. - Shard routing is based on
_tsid, so a given series lives in one shard. - Backing indices are time-bound and don't overlap.
The key change over the past year was to stop keeping separate inverted indices or BKD trees for every field and instead store each field as doc values (Lucene’s columnar storage), supported by doc value skippers, which are lightweight hierarchical sparse indices. That makes the on-disk layout columnar end to end, which is what lets the query engine read one column at a time and process it with vectorized execution.
Storage: 25 bytes to 3.75 bytes per data point
When most data points carry a unique set of dimensions, as is typical for OTel and Prometheus data, each document holds a single data point. That setup started at 25 bytes per data point for OTel. Four changes account for the path down to 3.75:
| Change | Bytes saved | Available since |
|---|---|---|
| Doc value skippers | -10 bytes | v9.3 |
| Larger numeric codec blocks | -2 bytes | v9.3 |
| Synthetic _id | -5 bytes | v9.4 |
| Sequence number trimming | -4 bytes | v9.4 |
| Total | -21 bytes (25 → 3.75) |
- Doc value skippers replace inverted indices and BKD trees (-10 bytes). A doc value skipper is a hierarchical sparse index that records the min and max value for blocks of documents, so a range query can skip whole blocks. Because TSDS is sorted by
_tsidand@timestamp, dimension values cluster on disk and skippers work well on them, with no measurable query regression. The Lucene-level mechanics are in How DocValuesSkippers in Lucene 10 make range queries faster. Skippers are on by default for TSDS since version 9.3. - Synthetic
_id(-5 bytes). Instead of building an inverted index for_id, Elasticsearch derives the identifier from_tsidand@timestampand uses a segment-level bloom filter for deduplication, falling back to doc values only on a bloom filter hit. Document APIs keep working unchanged. The implementation, including how the bloom filter keeps false positives low, is in How Elasticsearch cuts time-series storage with synthetic _id and bloom filters. Enabled by default in version 9.4. - Sequence number trimming (-4 bytes). Sequence numbers (
_seq_no) are needed for replication and optimistic concurrency control, but metrics are append-only and rarely use compare-and-swap updates. For TSDS, sequence numbers are now trimmed during segment merges once the global checkpoint has passed them, which also removes future merge work. The trade-offs, and how to opt back in, are covered in How Elasticsearch cut metrics storage by 41% by dropping sequence numbers after replication. Generally available (GA) in version 9.4. - Larger numeric codec blocks (-2 bytes). Raising the numeric block size from 128 to 512 elements in version 9.3 lets the codec compress repeated sequences, such as dimensions holding IP and MAC addresses.
Indexing: Native OTLP and Prometheus ingestion
OTel and Prometheus both ship metrics as protocol buffers. Elasticsearch now accepts those binary messages directly through native OpenTelemetry Protocol (OTLP) and Prometheus remote write entry points, instead of translating them into bulk requests first. For both protocols, parsing binary is cheaper than parsing JSON, the _tsid hash is computed once per document on the coordinator and reused across data nodes, and the dimension hashing amortizes across many data points in one message. Together with the indexing CPU saved by doc value skippers and the synthetic recovery source added in version 9.1, OTel indexing throughput improved by up to 50%; because Prometheus remote write reuses the same ingestion path, it benefits from the same optimizations. The OTLP entry point reached GA in version 9.3; the Prometheus remote write entry point followed as technical preview in version 9.4.
Querying Elasticsearch time series metrics with ES|QL
A columnar layout only pays off if the query engine reads it that way. The TS source command in ES|QL runs time series queries with a two-level model: an inner aggregation per series (such as RATE or AVG_OVER_TIME), and then an outer aggregation across series (such as SUM or AVG). Because data arrives in _tsid order, the engine applies the inner function over a fetched column of metric values until the _tsid or time bucket changes, all with vectorized, parallel execution.
Several optimizations stack on top of that model:
- Zero-copy decoding reads on-disk data straight into the primitive arrays the compute engine aggregates over, with run-length encoding for repeated
_tsidand dimension values and Lucene-level filtering of null metrics. - Counter rate evaluation assigns in-order
_tsidranges to each thread so resets are detected correctly while data is still scanned in order, and it interpolates values at time bucket boundaries for accurate per-bucket deltas. - Sliding windows let an aggregation span more than one bucket (for example, a one-hour window with five-minute buckets) to smooth noise, computed in two phases to avoid rescanning data.
Combined, these optimizations improved query latency up to 160x over earlier TSDS versions. TS and windowing support are GA in version 9.4.
ES|QL: Time series and metrics as a first-class citizen
The vectorized time series engine in ES|QL (which delivers up to 160x faster query performance) is how you access the columnar metrics store.
Time series support arrived as technical preview in version 9.2 with the TS command, described in the 9.2 ES|QL update. Version 9.3 expanded the function library and improved latency, as covered in Elastic's metrics analytics gets 5x faster: functions like PERCENTILE_OVER_TIME, STDDEV_OVER_TIME, VARIANCE_OVER_TIME, and DERIV for distribution and trend analysis, CLAMP for bounding noisy values, TRANGE for time filtering, and the sliding window argument on time series aggregations. As of version 9.4, the TS command and its time series aggregation functions are GA. For the full reference, see the TS command docs and the time series aggregation functions docs.
Three capabilities round out the metrics experience in ES|QL:
- Native exponential histograms. The
exponential_histogramfield type stores OTel exponential histograms directly, so you can query any percentile at query time with bounded error, no fixed buckets and no lossy conversion. An::exponential_histogramcast reads older T-Digest histogram data in the same query. Details can be found in native exponential histogram support in ES|QL. GA in version 9.4. - Time series discovery. If you manage a lot of metrics, just discovering and exploring what's actually in your time-series catalog can be half the battle. The
METRICS_INFOandTS_INFOcommands report which metrics and series actually have data in your current query context, with their types, units, and dimensions, rather than every field the mapping declares. They run against the sameTSexecution and stay responsive on billions of documents. Check the METRICS_INFO and TS_INFO post for more details. GA in version 9.4. - Downsampling, fully queryable. Downsampling now offers two methods: last value for maximum storage savings, and aggregate, which keeps min, max, sum, and count and preserves counter resets for accurate rates. Both support histograms, and as of version 9.4, any ES|QL dashboard built on raw data runs unchanged on downsampled gauges. See last-value vs. aggregate sampling for details.
Because all of this is ES|QL, metrics queries compose with the rest of the language, including LOOKUP JOIN and INLINE STATS, something PromQL-only systems cannot do.
Prometheus and PromQL compatibility
Teams that have built PromQL queries and Grafana dashboards for over a decade shouldn’t have to rewrite them to get all the benefits Elasticsearch has to offer. So Elasticsearch now supports Prometheus end to end: It ingests metrics through Prometheus remote write and runs PromQL queries directly.
On the ingest side, a native Prometheus remote write endpoint accepts Snappy-compressed protobuf from Prometheus or Grafana Alloy with no adapter, maps labels to TSDS dimensions, and infers metric types from naming conventions. The internals, from protobuf parsing to data stream routing, are in How Prometheus Remote Write Ingestion Works in Elasticsearch. Because remote write reuses the same storage and query engine, Prometheus workloads get the same storage and query gains.
The PROMQL source command runs PromQL directly inside ES|QL. It doesn’t use a separate engine: It parses the PromQL expression, resolves functions to their ES|QL equivalents (rate to RATE, sum to SUM, and so on), and builds a TS execution plan, so PromQL queries get the same vectorized, parallel execution as native ES|QL.
In Kibana, the command infers start, end, and step from the date picker, and the result is a normal ES|QL table you can filter, sort, and enrich with LOOKUP JOIN. The full design is described in Query Prometheus Metrics in Elasticsearch with Native PromQL Support.
Both Prometheus remote write and PromQL are in technical preview in version 9.4.
What's next for metrics in Elasticsearch
Three active areas:
- TSDS codec improvements: Further bytes-per-data-point reductions and a more configurable layout.
- Batch processing of ingested metrics: Cuts synchronization overhead for well-formatted data.
- Pre-computed block aggregates: Doc value skippers will carry sum and count to shortcut query processing.
PromQL coverage and Prometheus remote write are advancing toward GA.
The direction is set: one platform, with a columnar engine for metrics, that stores and queries your metrics, logs, and traces, seamlessly.
Start a free cloud trial, point your OTel or Prometheus metrics at it, and run a TS or PROMQL query.
The release and timing of any features or functionality described in this post remain at Elastic's sole discretion. Any features or functionality not currently available may not be delivered on time or at all.
Frequently Asked Questions
How many bytes does Elasticsearch use per metrics data point?
In version 9.4, OTel metrics land at 3.75 bytes per data point, down from 25 bytes a year earlier. That 6.6x drop comes from four changes in TSDS: doc value skippers, a synthetic _id, trimmed sequence numbers, and larger codec blocks.
Is Elasticsearch a columnar datastore for metrics?
For TSDS metrics, yes. Every metric and dimension field is stored as Lucene doc values in its own file, with no separate inverted index or BKD tree. Pair that on-disk layout with the vectorized ES|QL engine, and you get columnar storage and query execution, end to end.
How do I query time series metrics in ES|QL?
Use the TS source command, GA since version 9.4. It runs an inner aggregation per series (RATE, AVG_OVER_TIME, and so on) and an outer aggregation across series, all vectorized and parallel. For example: TS metrics* | STATS SUM(RATE(search_requests)) BY host.name, TBUCKET(1h).
Can I query Elasticsearch metrics with PromQL?
Yes, and one way is through the PROMQL source command in ES|QL. It parses your PromQL, maps the functions to their ES|QL equivalents, and builds a TS execution plan, so the query runs on the same engine as everything else. It’s in technical preview in version 9.4, and we’re working toward comprehensive coverage of PromQL commands.You can also point any Prometheus-compatible client at Elasticsearch and run PromQL directly against your existing metrics.
Does Elasticsearch support OpenTelemetry and Prometheus metrics natively?
Yes, both. OTel metrics come in directly over an OTLP protobuf endpoint (GA in version 9.3), and Prometheus metrics over a native Prometheus remote write endpoint (in technical preview in version 9.4), with no adapter or bulk translation in either case. OTel exponential histograms are also stored as is in the exponential_histogram field type (GA in version 9.4), so you can ask for any percentile at query time.
Related Content

July 9, 2026
Why Elasticsearch is becoming a columnar database
Elasticsearch is becoming a first-class columnar database. Columnar Mode ships in 9.5, storing data once alongside the existing modes and cutting storage footprints while speeding up analytical queries.
How to build search analytics on Elastic using OpenTelemetry, no extra pipeline required
How to instrument your search application to use modern Open Telemetry standard to drive insights in to your search and users.

July 7, 2026
Your compliance posture just got an upgrade: Elasticsearch now supports FIPS 140-3
Elastic 9.4 brings FIPS 140-3 support for Elasticsearch and Kibana to GA. Here's what changes for federal, defense and regulated deployments, and how to migrate from 140-2.

July 2, 2026
A simdvec deep-dive: How Elasticsearch uses neural-net and video-codec CPU instructions for vector search
Four ways Elasticsearch's vector search engine reuses neural-network, video-codec and cryptography CPU instructions for up to 6x speedups; with the math, the failed attempts and the benchmarks.
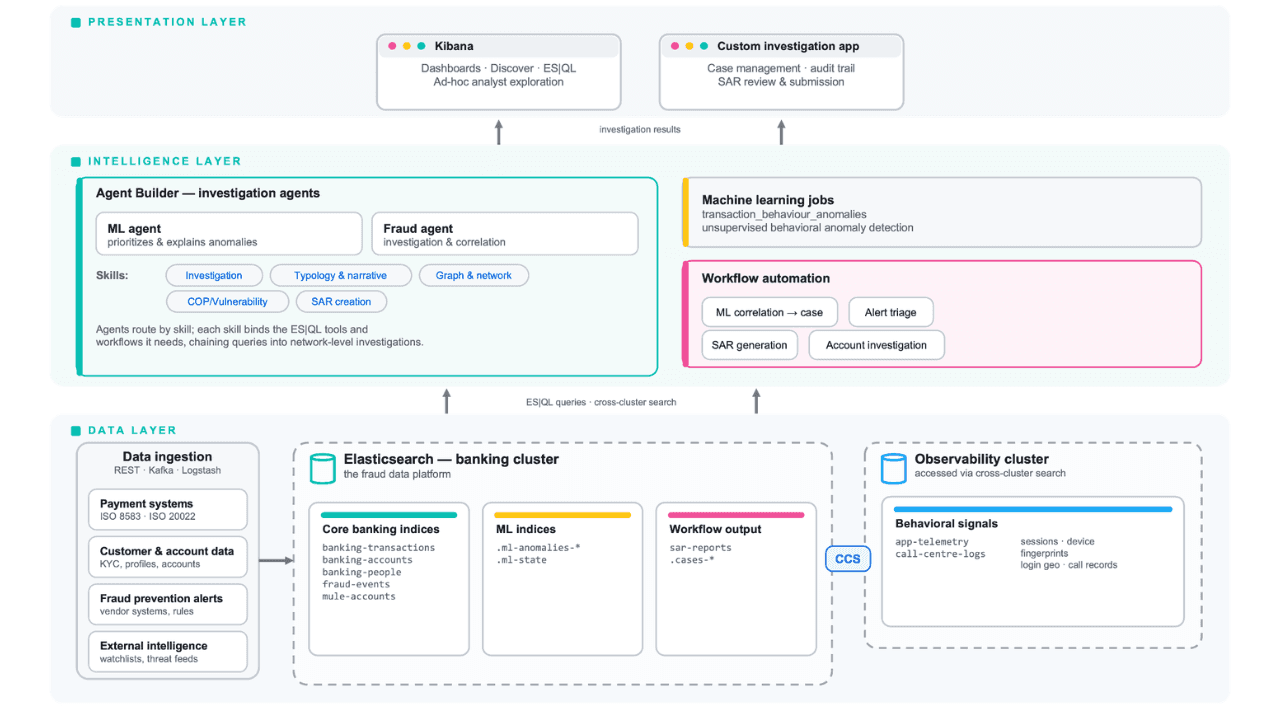
Follow the money: tracing laundering networks with ES|QL and cross-cluster search
The data model, cross-cluster architecture and five ES|QL queries that power mule detection and laundering network tracing, built from infrastructure most financial institutions already run.