Telecommunications observability with the Elastic Stack: Monitoring voice traffic data
Applying an observability strategy to core telecommunication data processing enables operators to answer questions that were not possible to answer before. As this approach has gained prominence, the Elastic Stack has become increasingly popular in the telecommunications space, with companies like Deutsche Telekom — their data transformation effort championed by Hans-Konrad Roth — adopting Elastic as their solution of choice for international traffic monitoring.
Monitoring voice traffic data with Elastic
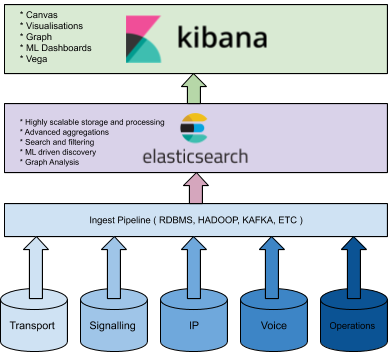
Powered by Elasticsearch, the Elastic Stack provides all three layers for processing information. Ingest pipelines (Elastic Endpoint Security, Beats, and Logstash) enable users to rapidly integrate data from any data source and parse, normalise, and enrich it. Elasticsearch allows users to store, query, and analyze data with powerful features like out-of-the-box machine learning capabilities. And — likely the most important to many end users — Kibana provides a curated visualisation experience with dedicated apps for logs, metrics, APM, SIEM, maps, and more.
Where the Elastic Stack can significantly boost traditional operational work efficiency is transport network monitoring. Traditional systems are highly siloed, and correlating between different data sources is very difficult (if not impossible). Insights are limited to a single data source domain and do not provide a customer-centric view.
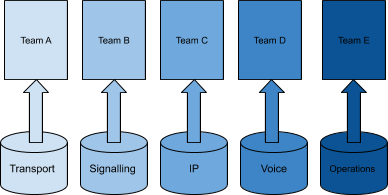
Changing the approach to collocate all information in a single analytical platform opens new ways to perform data analysis. It enables operators to map customer experience to service quality and later to system availability with a detailed view on failing components. Fraud detection and abuse of the network can be detected using the same data set and the same analytic capabilities.
Making data ingest simple
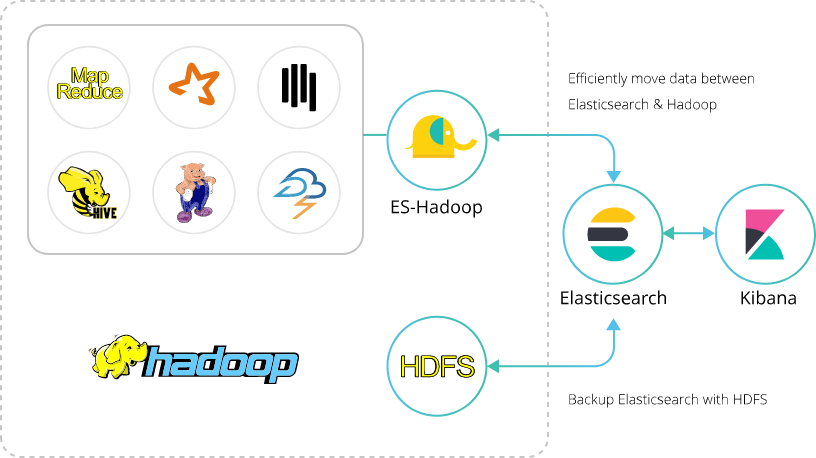
Quite often, infrastructure data like KPIs, fault management, inventory information, or CDR/EDR data is stored in curated form in a RDBMS or Hadoop. One of the fastest ways to retrieve data from such a complex system and ingest it into the Elastic Stack is through direct integration with those systems. It is fairly easy to write necessary queries, and RDBMS also enable users to create views on data and make enrichment (joins) on SQL level. The same applies to Hadoop integration (Elastic provides an Elasticsearch-Hadoop connector).
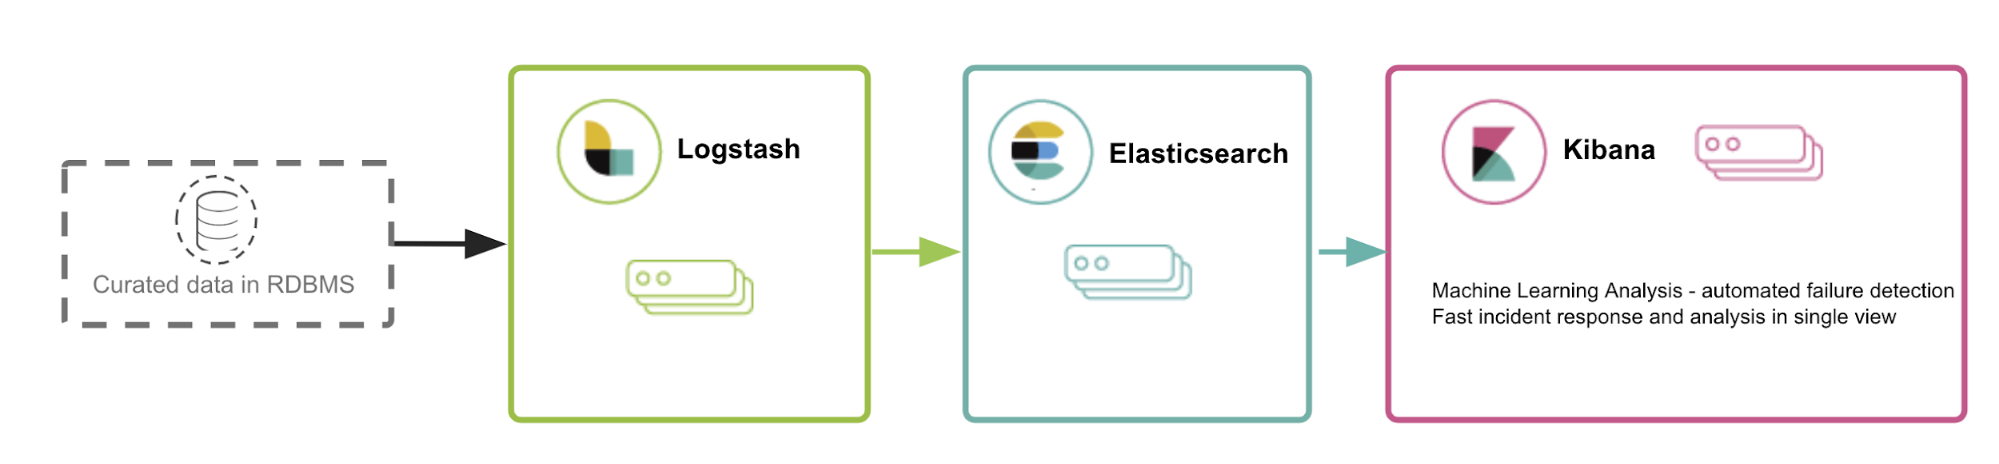
Some organisations may not have this kind of advanced data warehouse setup. In such cases, Logstash and Beats enable users to ingest data directly from device logs like EDR, CDR, or signalling information from core network devices like MME.
Why is data enrichment important?
Most available systems provide a limited view, as they are specialised in just one area. Today, system capability enables organisations to store much more data — and, most importantly, process it faster. It is possible to merge multiple domains such as customer traffic, planning, inventory management, performance management, fault management, configuration management, software management, and environmental monitoring.
Having all of the information correlated in a document enables entirely new analytical possibilities, leading to much faster issue resolution and new discoveries.
Some examples of areas of interest which can be covered are:
- Understanding multi-factor influence on observed measurements
- Human factor contribution to error rate
- Understanding network element performance by element type, vendor, location, and type of installation
- The contribution of weather and environmental conditions to measurements
- Overview of the platform and surrounding systems and connections
- Much faster problem source identification (MTTR-1)
Storage and processing
Elasticsearch is the core of the Elastic Stack and is designed to store and analyze data. It can store any type of data, making it a great observability tool for users to answer all possible questions based on their dataset.
The basics of voice
The most common logs operators get from the system in relation to voice traffic are CDRs (call data records). Getting CDRs to Elasticsearch requires slight preprocessing, especially focused on data enrichment. The final data should contain enough information to understand it and allow for deep insight.
There are a number of KPIs which can be derived from this dataset. Please look at a few examples of what kind of visualisations and analysis can be easily done.
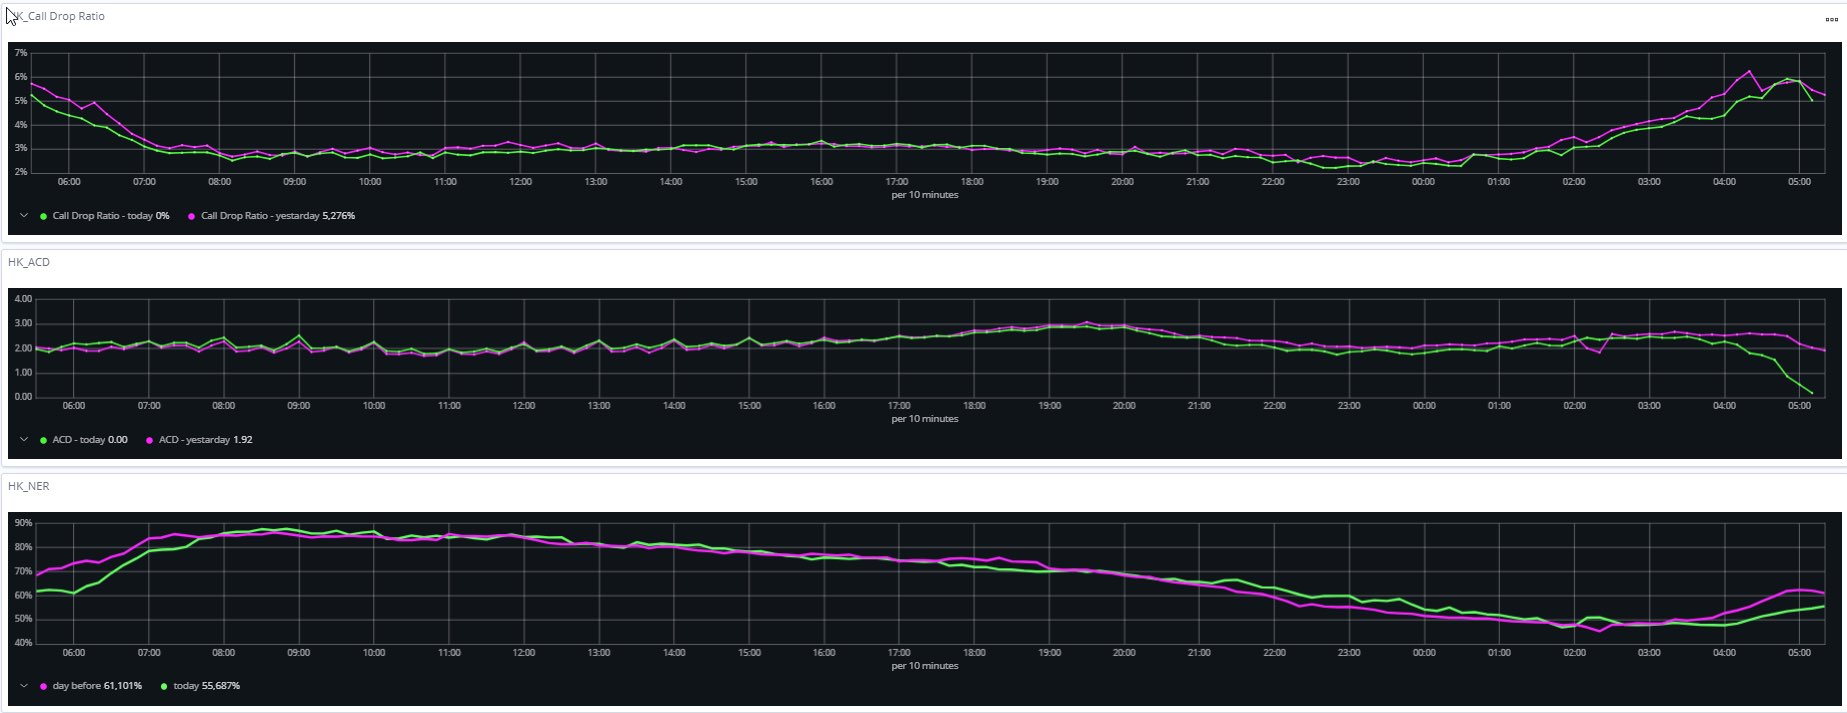
CDR (call drop ratio)
- The number of calls disconnected due to platform failure
- The number of all calls routed via the system
ACD (average call duration)
- The average call duration per destination and product
- The percentage of customers with an ACD over the average per destination and product
NER (network efficiency ratio)
- The expression of the system’s ability to fulfill the call to a given destination
- The percentage of customers with a lower NER than the average for the given destination
The visualisation below is a representation of all the above-mentioned parameters.
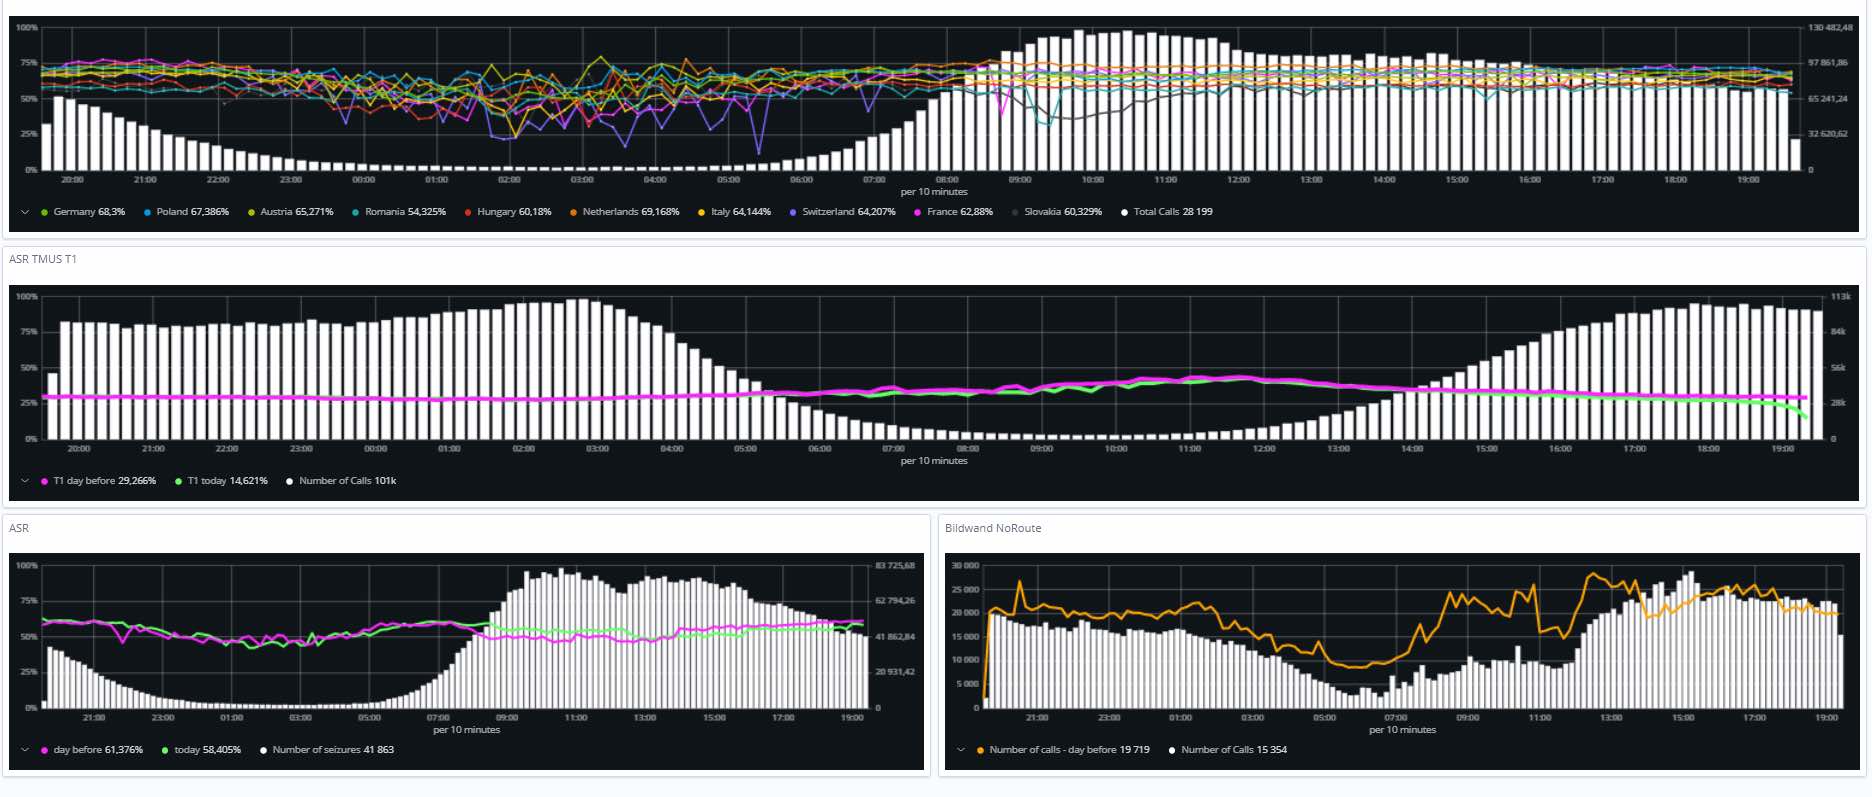
ASR (answer seizure ratio)
The available views:
- The number of successful calls
- The number of call attempts
- The percentage of subscribers with lower ASR compared to the average per destination and direction
The visualisations below represent the traffic monitoring for the top 10 destinations ASR / success rate.
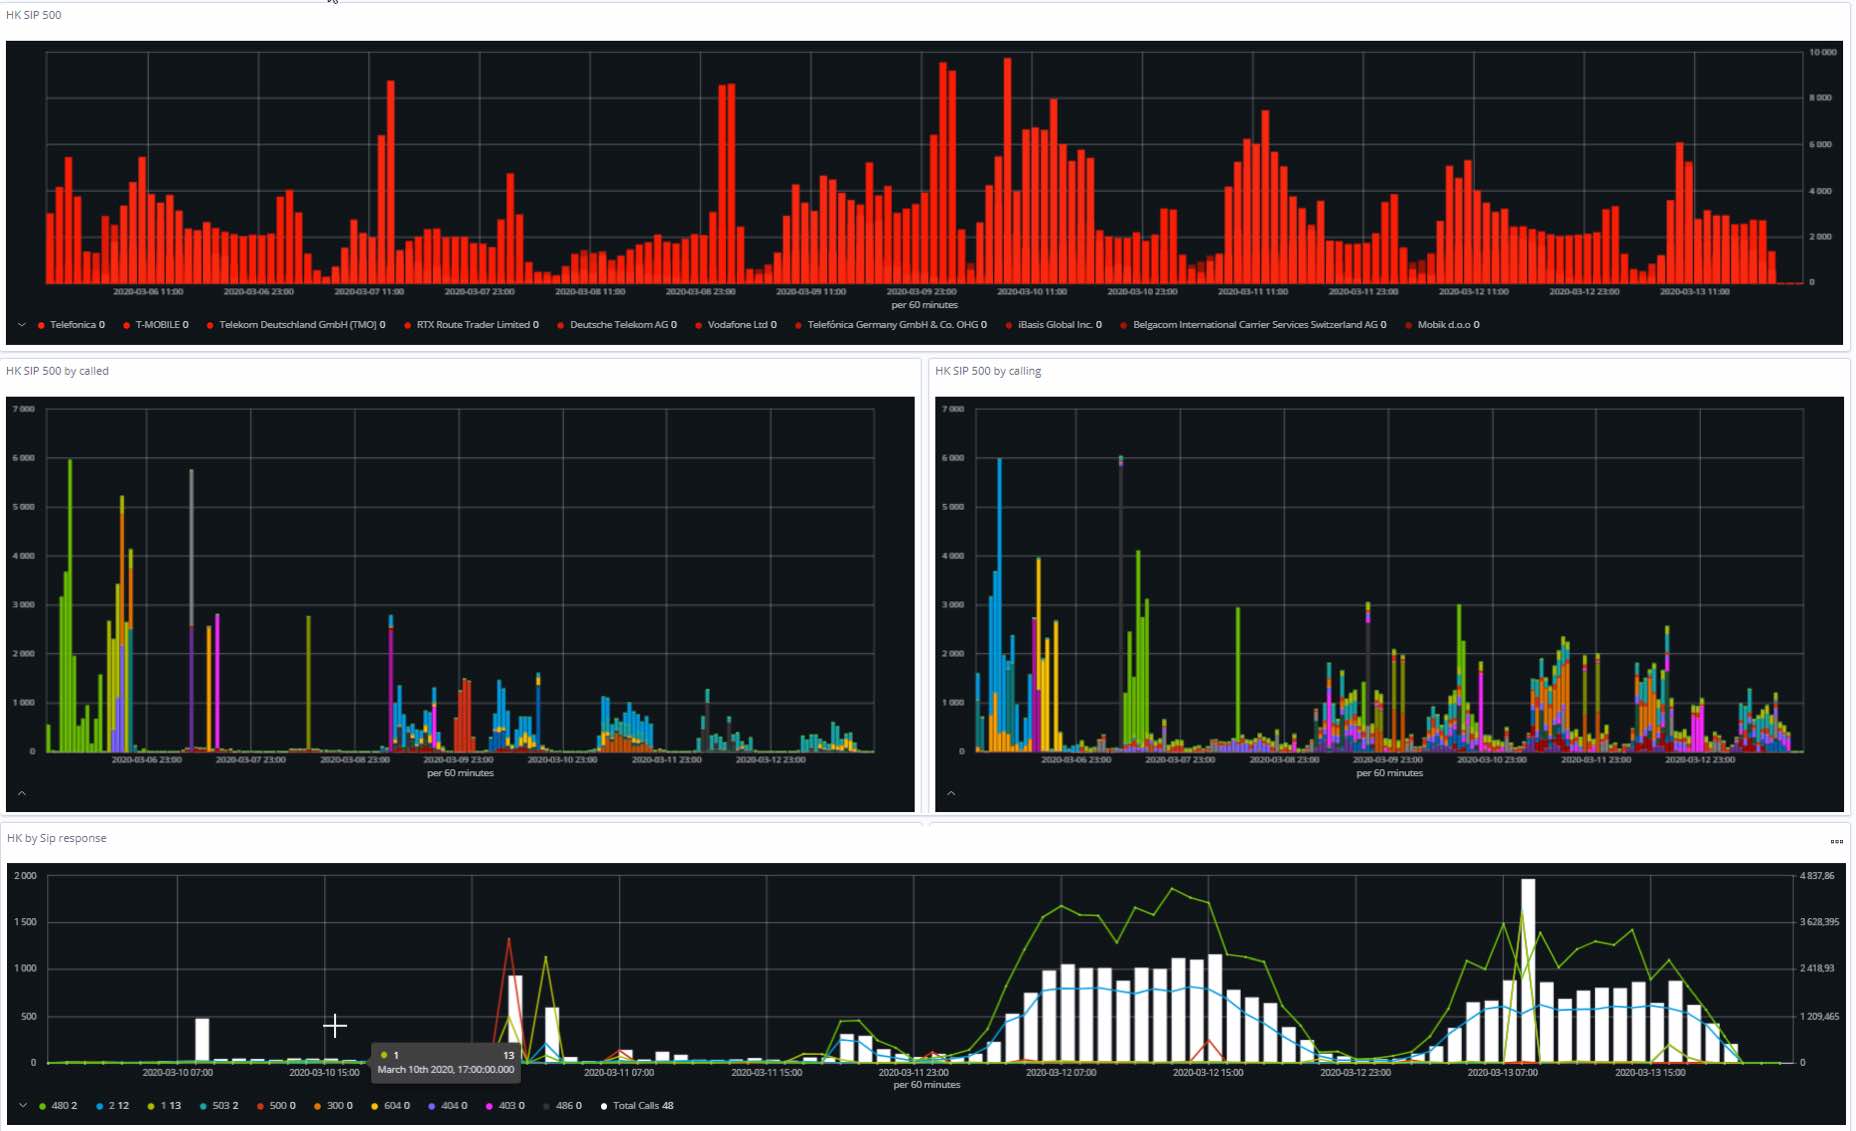
SIP traffic analysis
The visualisations below represent the 500 failure codes summary.
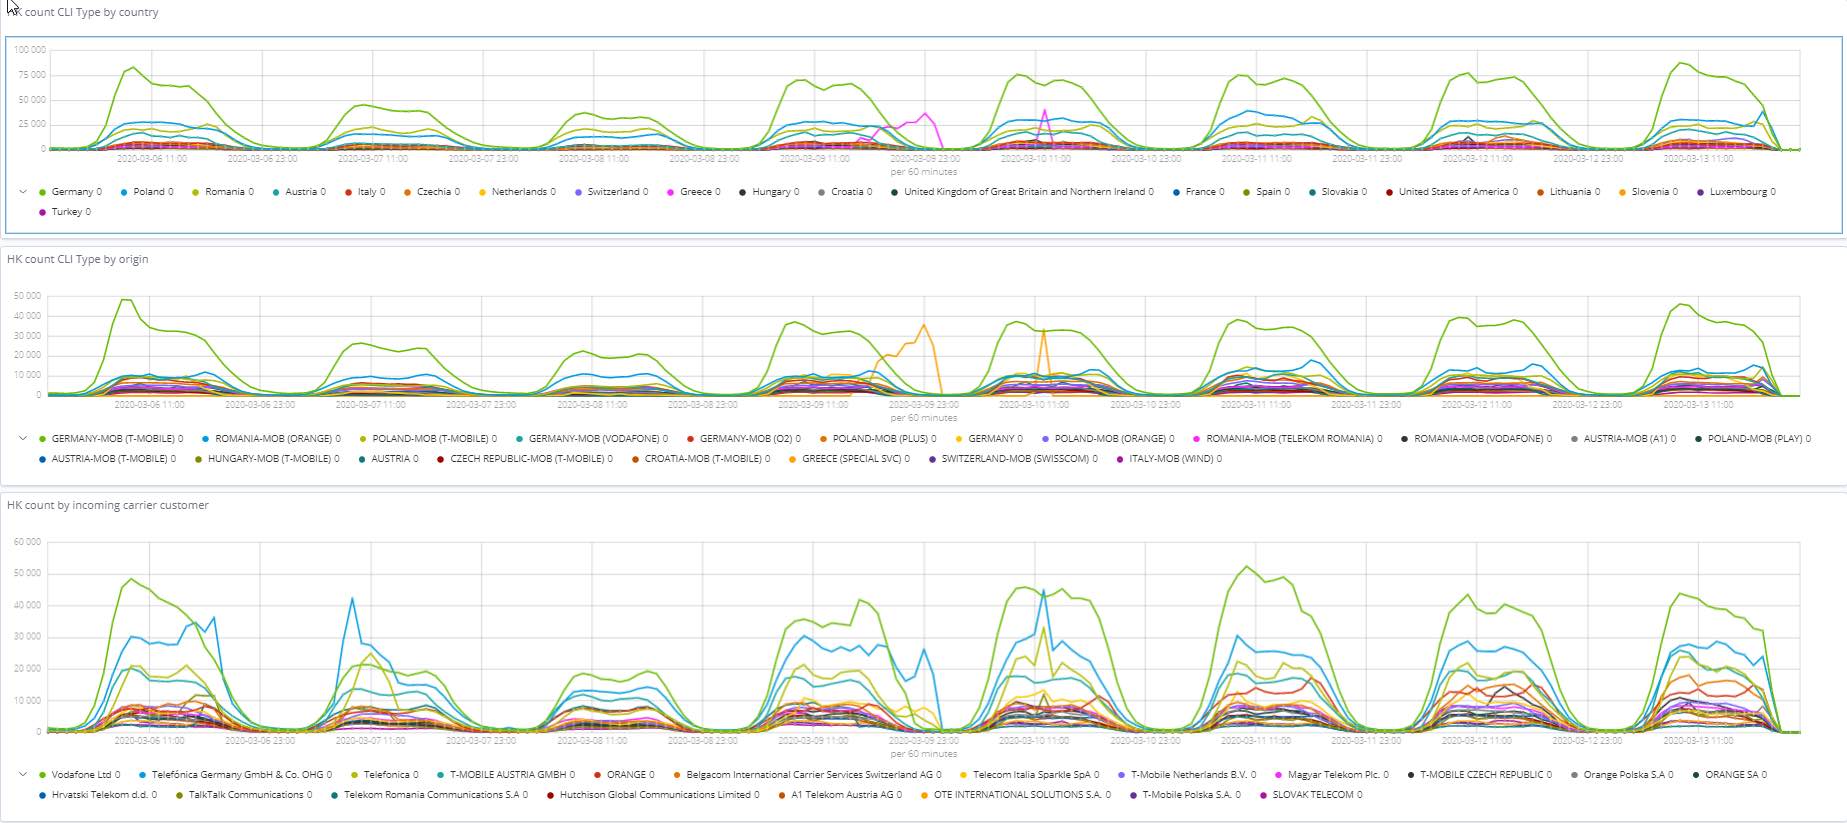
CLI (calling line identification)
The available views:
- CLI per destination and product
- Number and percentage of customers affected by non-CLI routes
The visualisations below enable profiling by CLI on a different level to have a good understanding about the structure of a traffic stream.
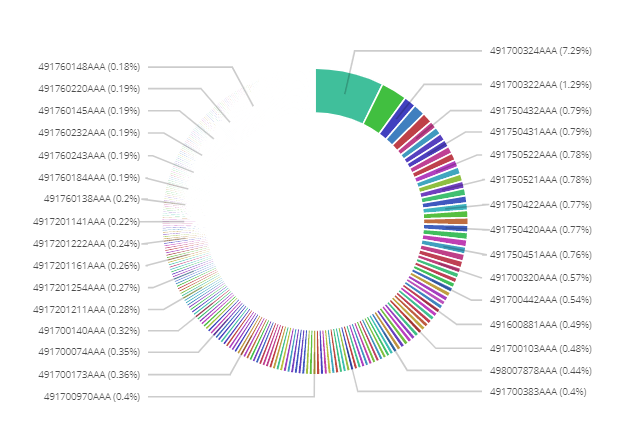
Calling/called number analysis
The Elastic Stack enables users to build very detailed views of data. Profiling by calling/called number to have percent statistics is a simple step, and users can use Elasticsearch to perform more advanced aggregations and data partitioning by any of the available fields inside the data set.
Anomaly detection in voice traffic analysis
Anomaly detection enables operators to simply set up a single machine learning job on all traffic and split automatically across any of the parameters or data entities, unlike traditional alerting, which requires setting thresholds for each entity separately. Machine learning-based alerting will automatically adjust to network-specific behaviour. It can simplify and speed up network defect detection as well as pinpoint unusual behaviours, which are quite often recognised as abuse of the network to gain revenue by bad actors.
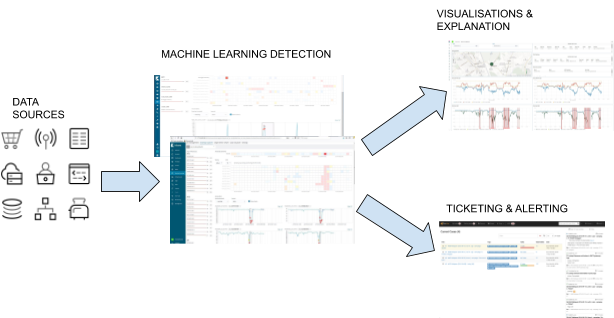
The typical analysis from machine learning in the Elastic Stack contains the following steps:
- Data sources are ingested
- Machine learning detection is applied to the data
- Visualizations and explanations are generated, as well as tickets and alerts
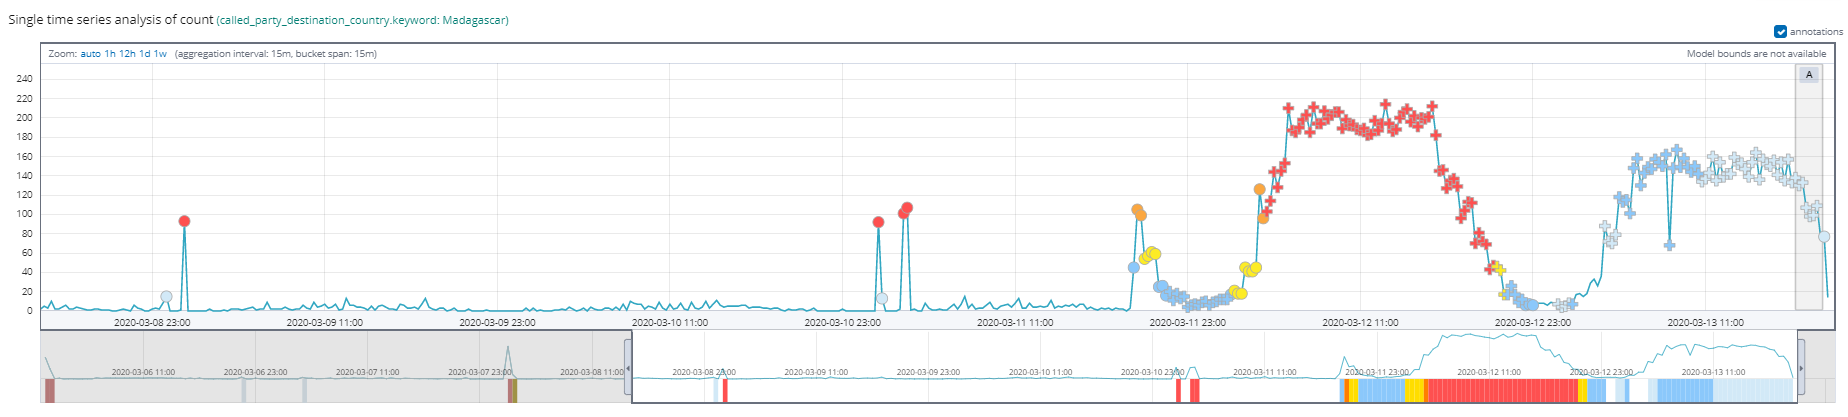
In the example below, we can see anomalies related to traffic originating from Madagascar. The system detected a significant increase in connections and an automated alert was created.
Another dashboard shows the anomalies for traffic from Gabon. Users can navigate from the anomaly detection view directly to any custom dashboards that the user created.
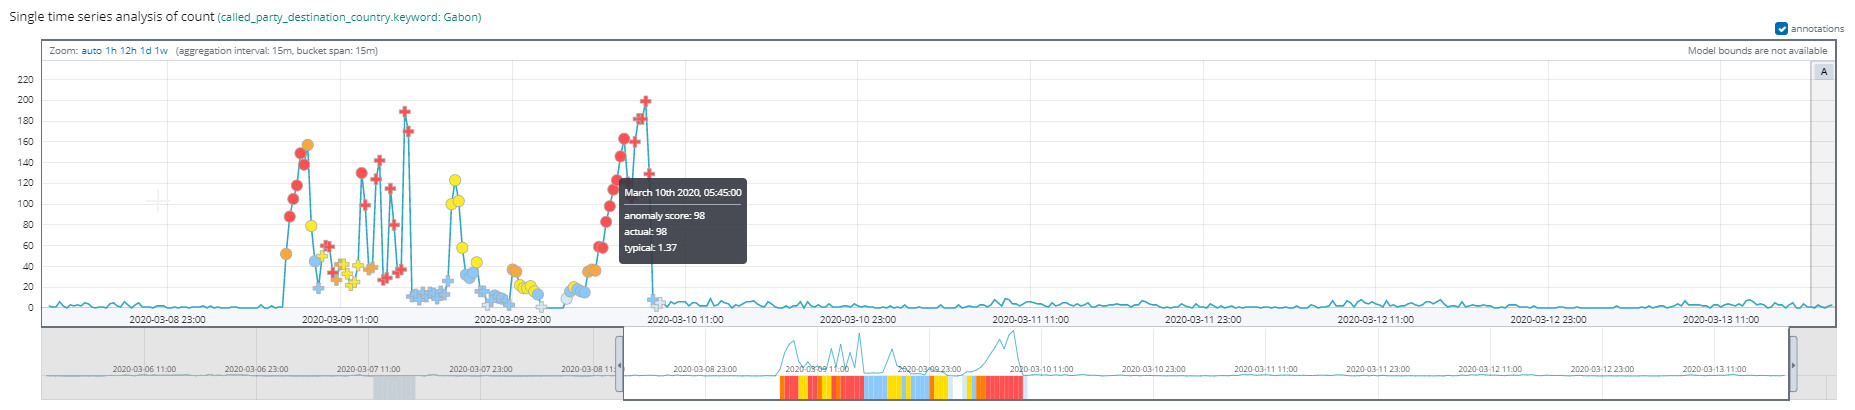
In this case, the operator can find details for the Gabon-originated traffic alert and quickly understand that the anomaly was caused by individual numbers.
Currently we see rapid adoption of the Elastic Stack for CDR data analysis. It is important for each operator to be able to track subscriber behaviour and know about important events immediately when anomalous behaviour is spotted. This will significantly lower the risk of revenue loss or reputation damage.
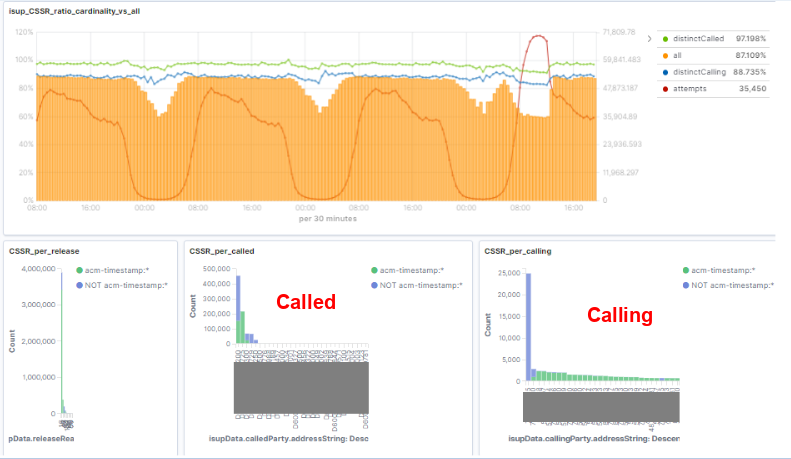
CSSR (call setup success ratio)
CSSR analysis is one of the KPIs which have to be constantly monitored by the operator. The ability to act fast can prevent revenue loss and customer dissatisfaction. In many cases, it is not obvious if drops in particular values are the result of network failure or single subscribers abusing the network to their benefit (mass callers, number scanning, etc.). With the Elastic Stack, the situation looks much simpler, and operators can easily see the distribution of call attempts between calling and called parties. The Operations team can filter out individual numbers or groups of numbers and immediately verify the thesis. All operations can be aided by machine learning anomaly detection to spot unusual spikes in subscriber traffic without compromising accuracy.
In this example, data is decoded directly from ASN1 Call Data Records which are produced by the SS7 monitoring system. The ingest pipeline is used to perform enrichment (SPC/name, IP/name), including additional scripting.
Success is assumed if the called party exists and the called party has been notified about the incoming call.
The image below represents four different statistics:
- All: catch call data record is counted
- distinctCalling: unique event count on calling party
- distinctCalled: unique event count on called party
- Attempts: call attempts
Get started in minutes
As we’ve seen, Elastic Observability provides immediate value to the telecommunications space by unifying data that was previously siloed and allowing for powerful analysis in the Elastic Stack. Start visualising your voice traffic data with a free trial of Elasticsearch Service on Elastic Cloud.
And if you'd like to learn about another Elastic project at Deutsche Telekom, check out their talk from Elastic{ON} 2018 Munich: Smart Tracing at Deutsche Telekom - Revealing the secrets behind modern networks with the Elastic Stack.