Elastic Stack 8.9: Faster cross-cluster searches and aggregations on metrics


 Share on Twitter
Share on Twitter

 Share on LinkedIn
Share on LinkedIn

 Share on Facebook
Share on Facebook

 Share by Email
Share by Email

 Print this page
Print
Elastic Stack 8.9 delivers significant performance improvements on multiple fronts: faster cross-cluster search in Kibana®, faster aggregations with Elasticsearch®, and faster and more relevant vector search (read the Elastic Search 8.9 blog to learn more). These performance enhancements accelerate insights at scale and establish Elastic®’s vector search as a leader in relevance and within reach on speed. Additionally, take advantage of several enhancements in Kibana, a simplified aggregation over geo lines, and simplified management of alerting rules across clusters from a single place, using Terraform.
These new features allow customers to:
- Achieve 90%+ faster aggregations on metrics
- Reduce latencies in cross-cluster searches by up to 80x
- Manage alerting rules across multiple clusters from a single place using Terraform
Elastic Stack 8.9 is available now on Elastic Cloud — the only hosted Elasticsearch offering to include all of the new features in this latest release. You can also download the Elastic Stack and our cloud orchestration products, Elastic Cloud Enterprise and Elastic Cloud for Kubernetes, for a self-managed experience.
What else is new in Elastic 8.9? Check out the 8.9 announcement post to learn more >>
Radical improvements to aggregation latency on metrics
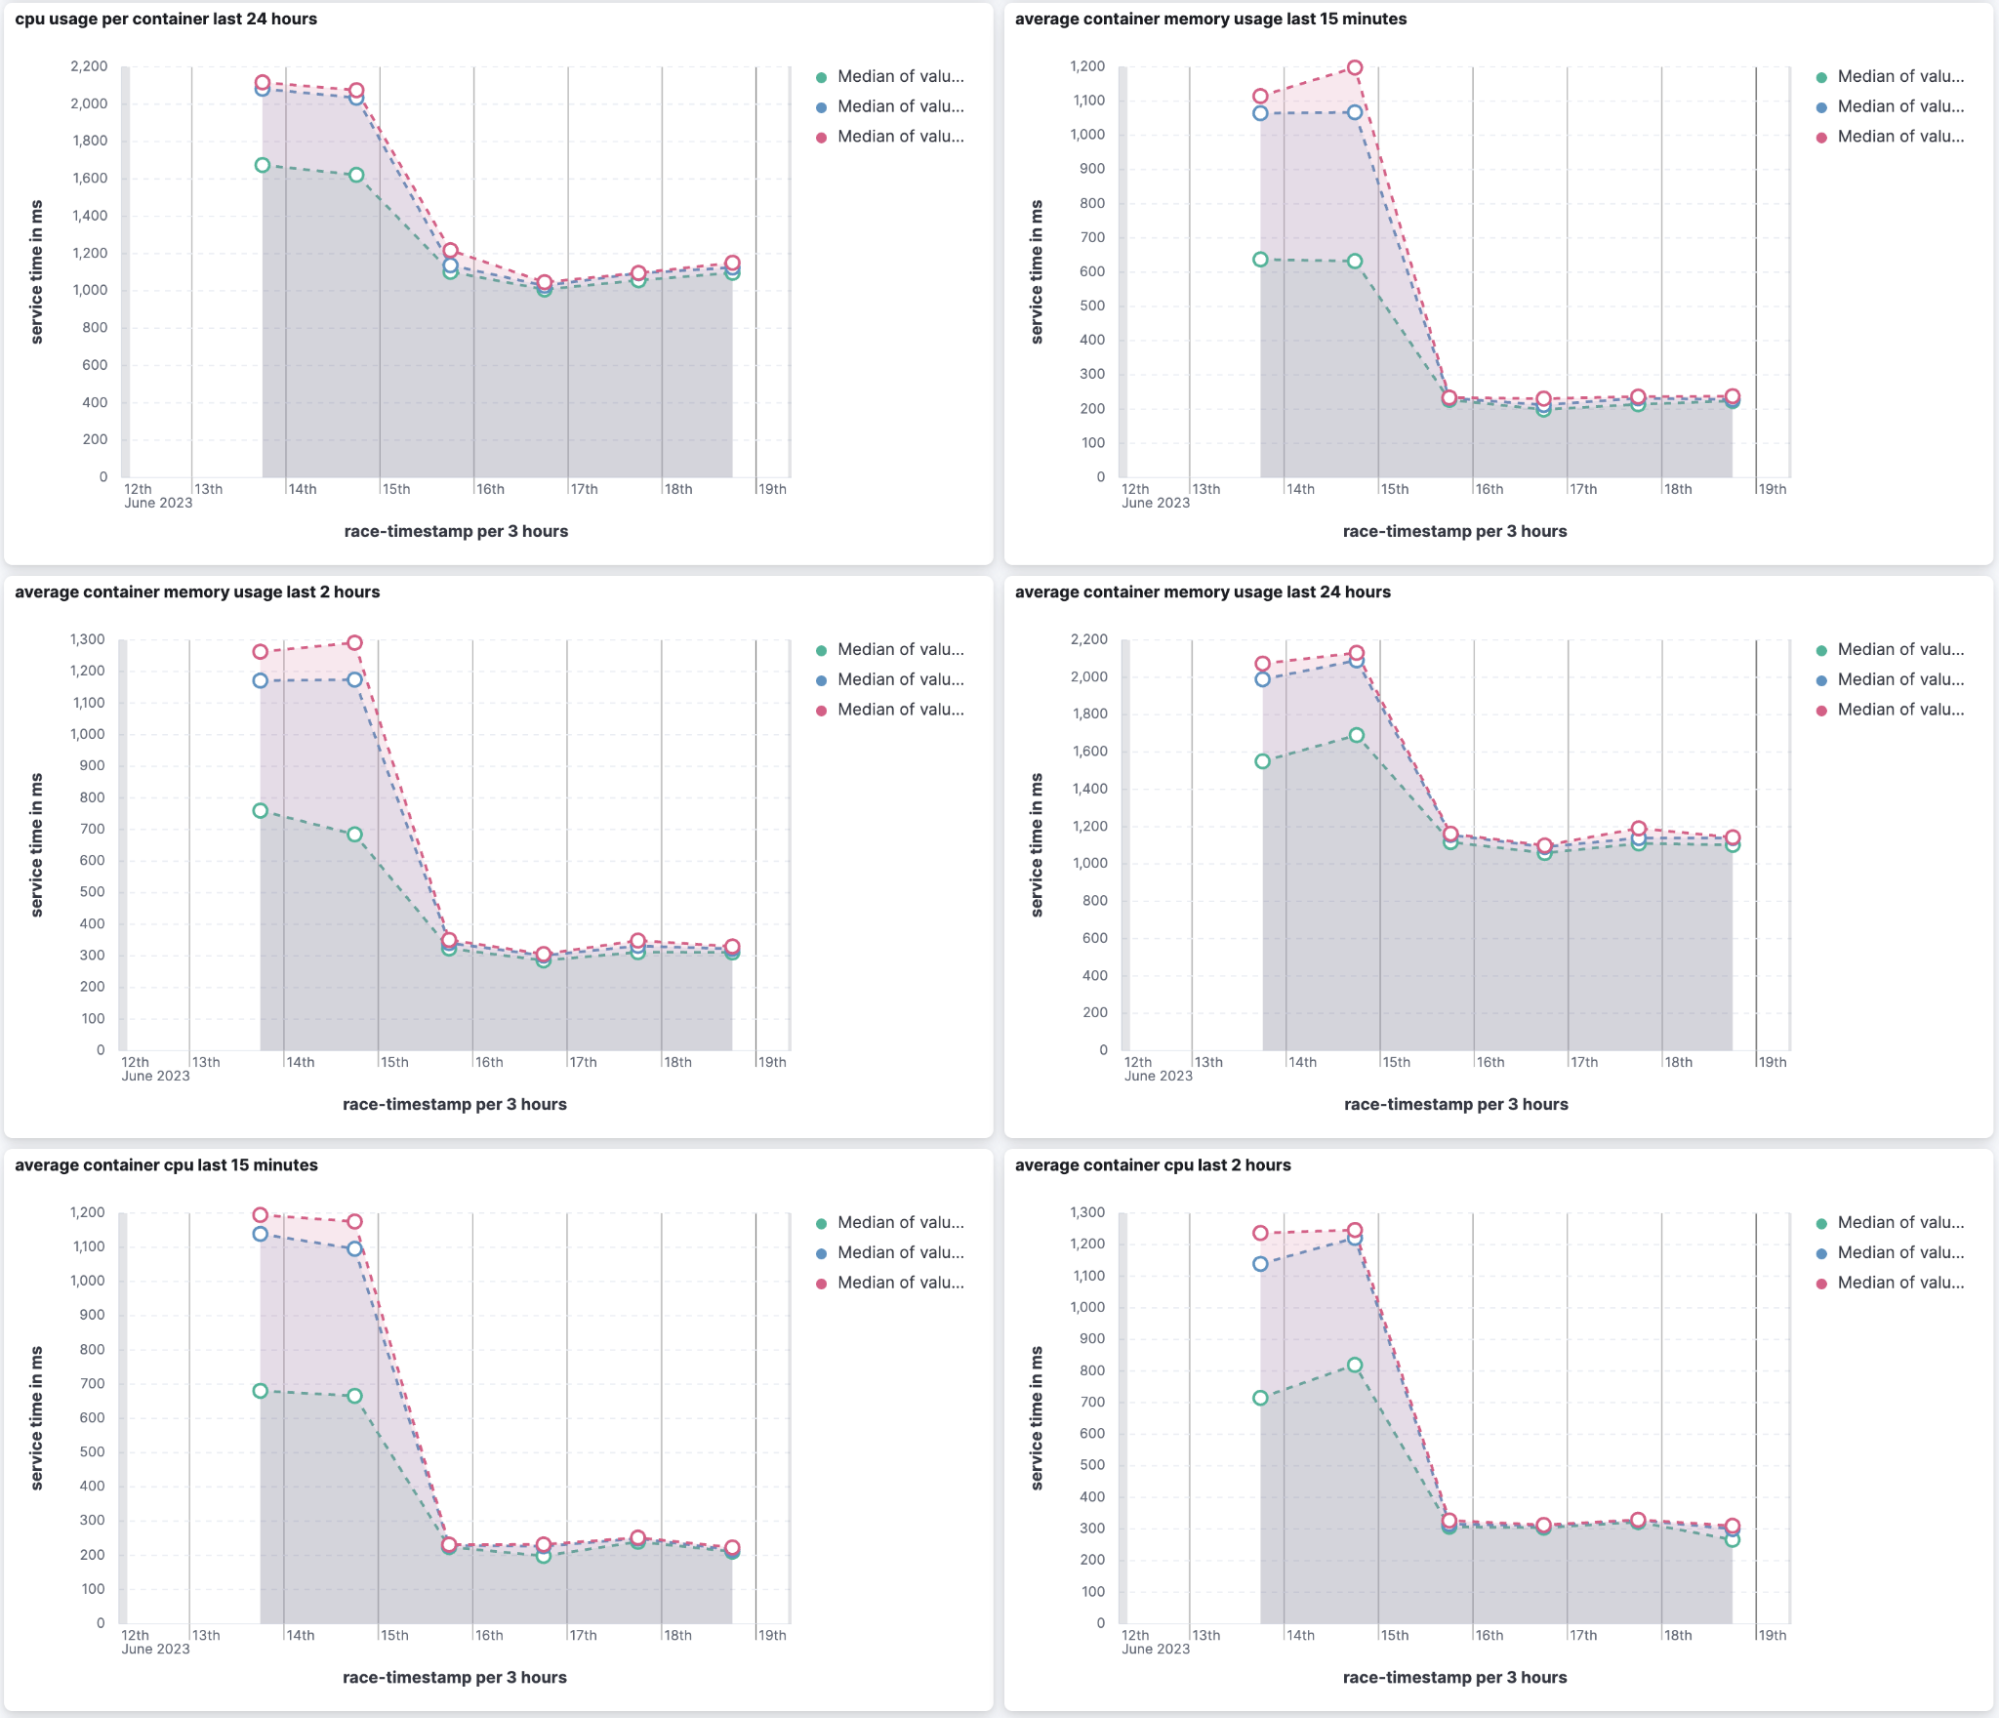
As part of the time series database (TSDB) project, relating to optimizing Elasticsearch for metrics data, we set to improve the latency of aggregations that are frequently used with metrics data. We focused on Kubernetes metrics and achieved improvements of between one to two orders of magnitude in aggregation latency (i.e., running the relevant aggregations takes between 10% to 1% of the time it took prior to 8.9).
Let’s examine the details and the relevant public nightly benchmarks:
- We improved the default refresh behavior of Elasticsearch. By default, a refresh only happens if a shard is search active, and a shard goes search-idle after 30 seconds of search activity. When a shard is search-idle, no scheduled refresh happens, and this favors indexing throughput. However, searching a search-idle shard can increase query time significantly — this is noticeable when loading visualizations in Kibana because after some time of inactivity, dashboards load slowly. We made two changes that reduced latency of searches with aggregations by over 90%, because shards were search-idle.
- We improved the can match phase of the search api to sometimes determine whether a query doesn’t match with a shard without doing any search related i/o. For specific queries that query a field that doesn’t exist or a constant keyword field that doesn’t match, we can skip entire shards without doing any search related i/o on data nodes. This improves the default refresh behavior because shards remain search-idle and no scheduled refresh happens.
- When a shard is search-idle and a refresh does need to happen, the refresh is executed immediately, instead of having the refresh scheduler to kick in. This reduces latency when searching idle shards and reduces query time by over 1 second (the exact improvement depends on the number of shards allocated on a data node).
- We improved the ability of cardinality aggregation to identify that certain sets of docs are not able to add new values and so should not be examined as part of the cardinality aggregation run. This optimization resulted in cardinality aggregation improvement of over 85% and in certain conditions over 99%.
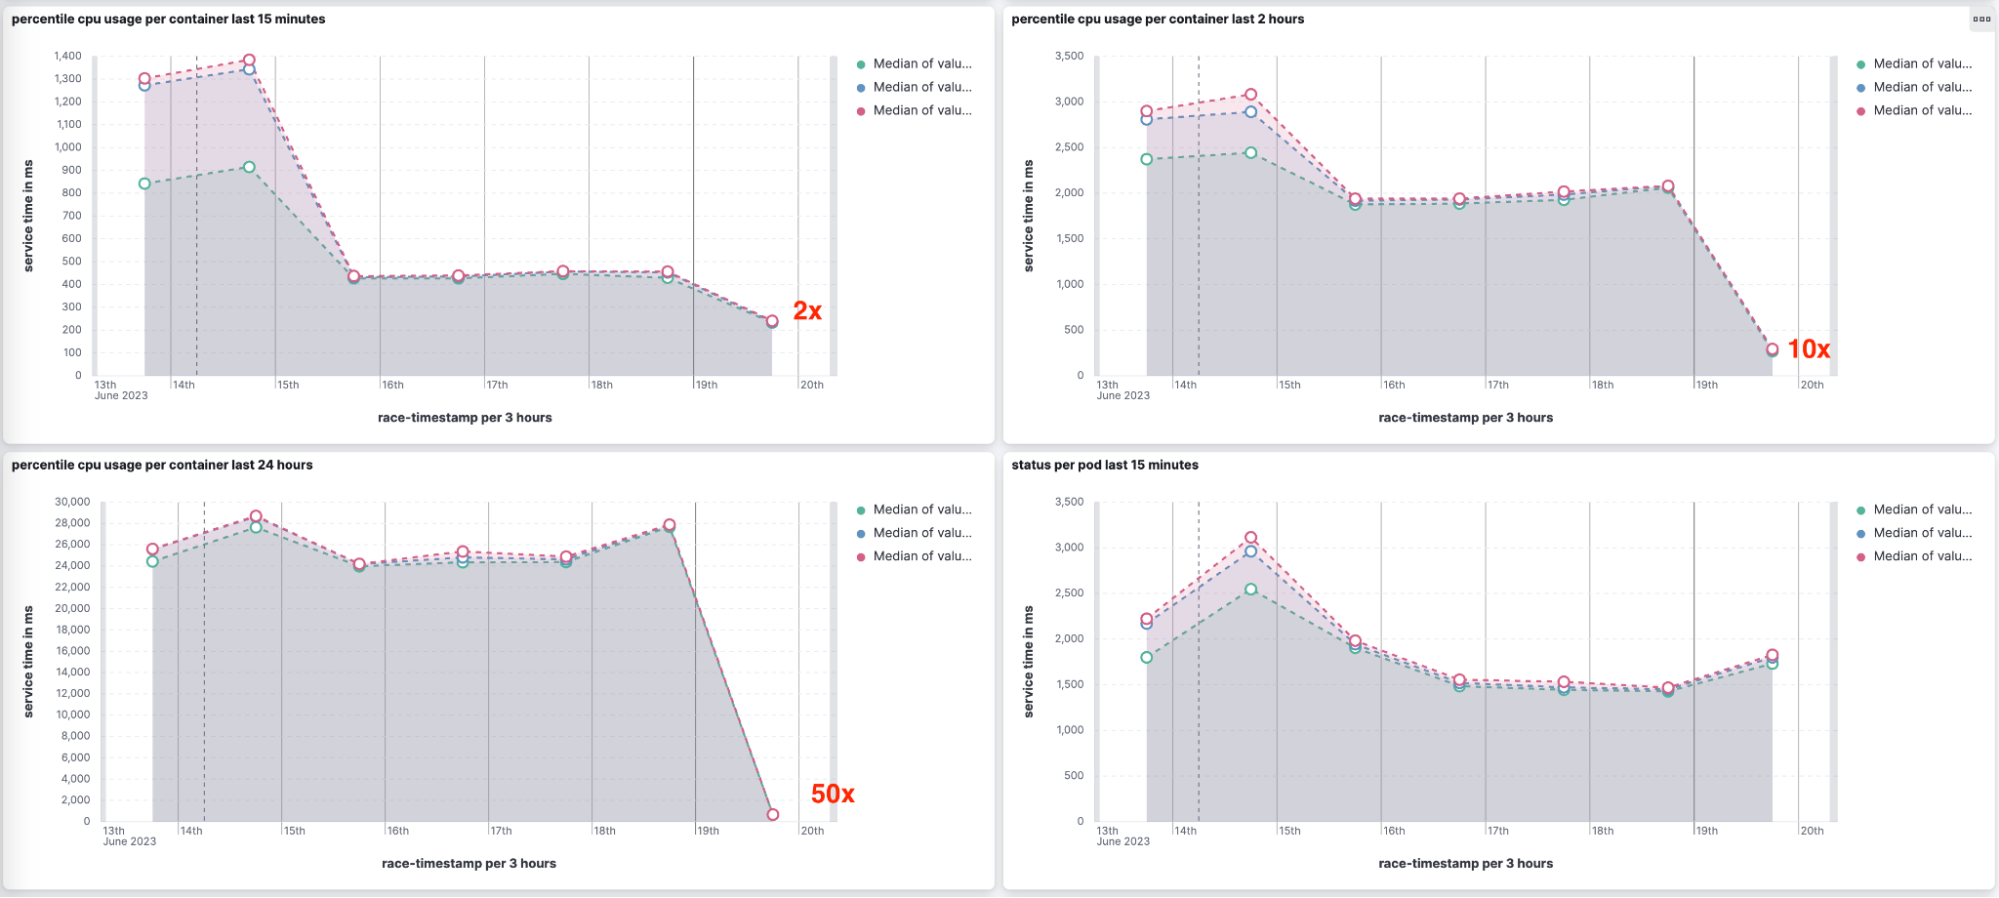
- We have changed the way we use histograms, changing from AVL trees to merging, bartering a little accuracy (changing from around 0.1% error to around 1% error) for a lot of aggregation latency improvement (with aggregations running between twice as fast to 50 times faster). This improvement impacts a set of aggregations including percentile, percentile rank, and others.
Cross-Cluster Search is faster with fewer network trips
Cross-Cluster Search (CCS) lets you federate multiple Elasticsearch clusters into one Kibana or search endpoint to help with your data locality, regulatory and compliance, and scaling needs. The clusters can be anywhere in the world, in Elastic Cloud, or in your own self-managed deployments in the cloud or on-prem.
As a distributed system, Elasticsearch is affected by network latency. This is amplified in a cross-cluster setup where searches have to fan out across the network to multiple clusters and nodes within those clusters. The more network trips, the more performance is impacted by network latency. Traditionally, cross-cluster searches involved a lot of network trips if they weren’t using an option we call “minimize round trips.”
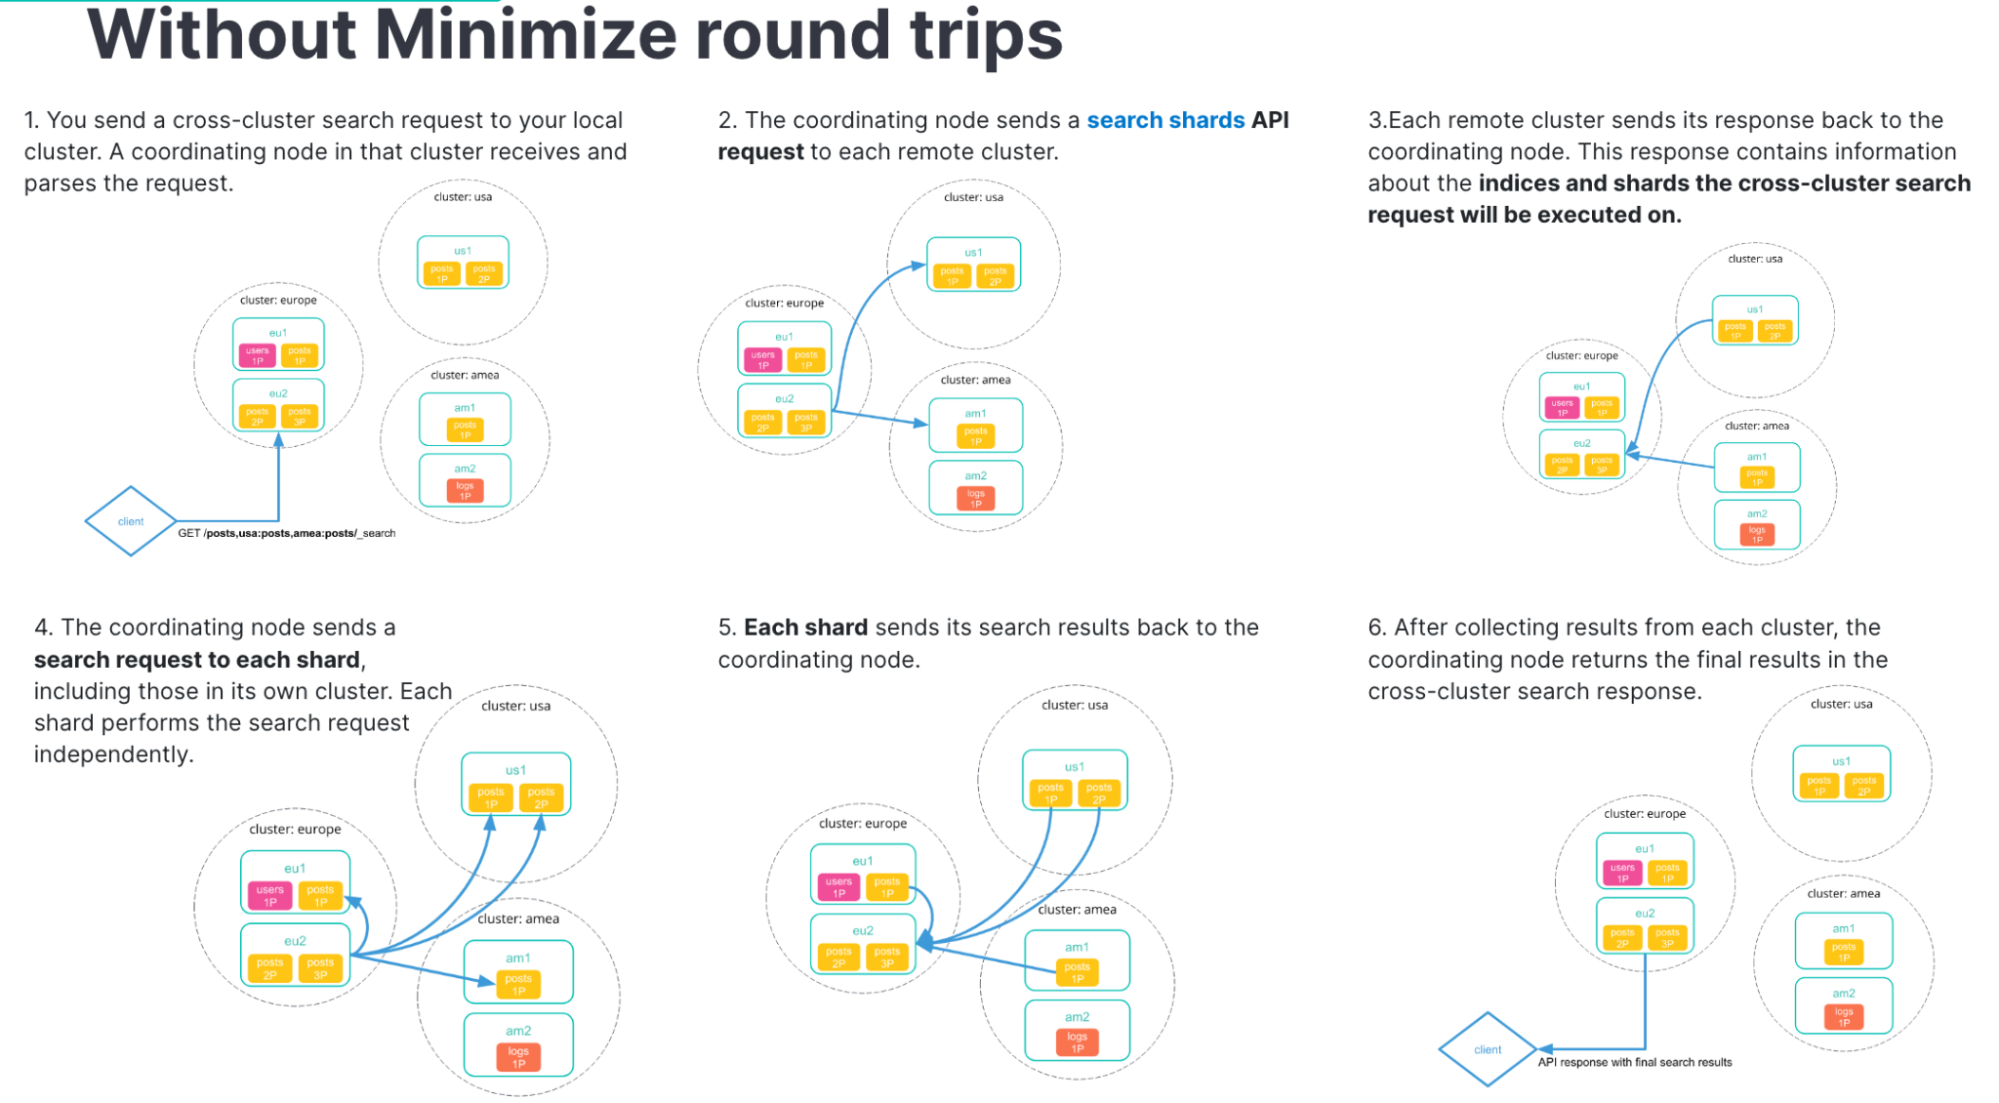
The search API supported minimizing round trips even with CCS, but when Kibana is doing searches via CCS, behind the scenes it is using the async_search API, which did not support minimizing round trips. We’ve addressed that limitation in 8.9 by adding support for ccs_minimize_roundtrips=true in async search. Kibana 8.9 will use this mode by default.
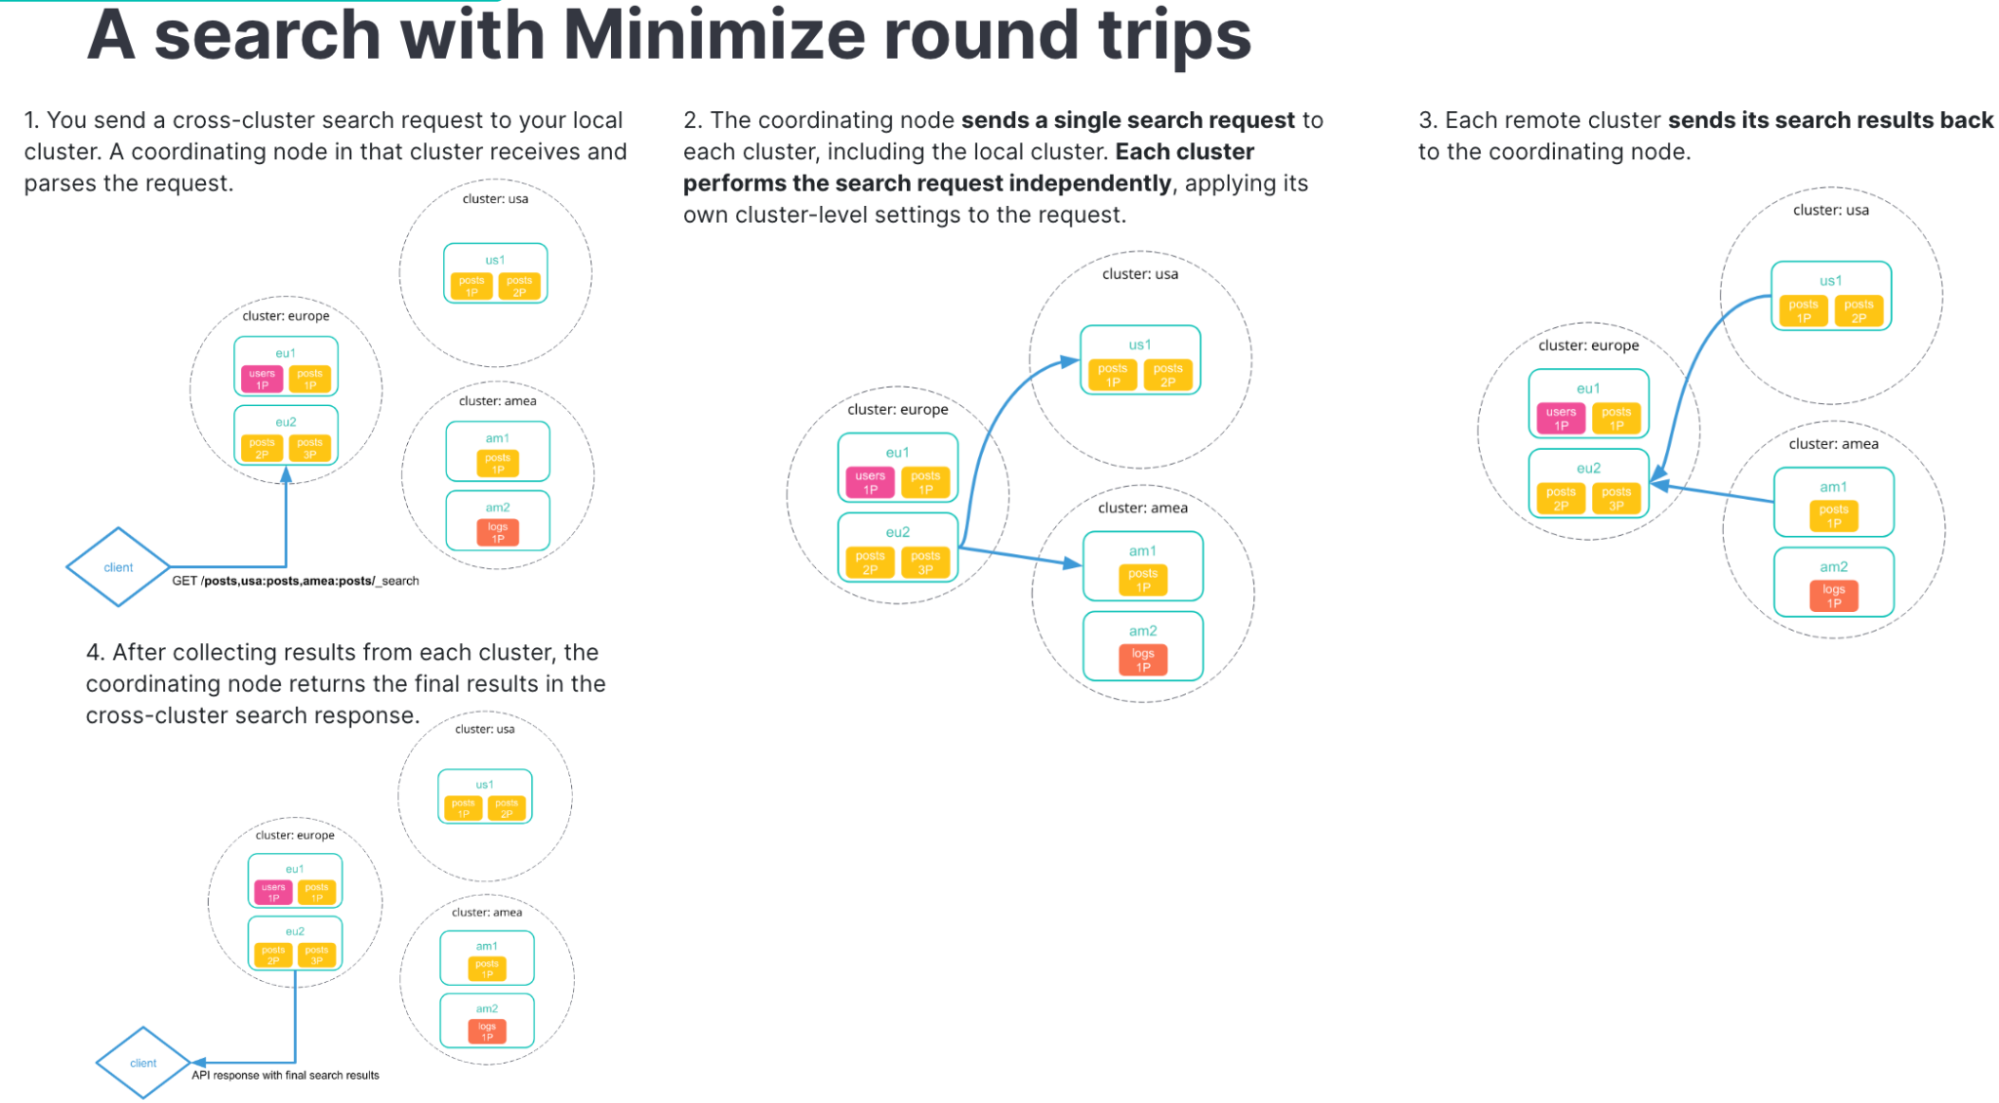
The performance gain increases as more shards are involved. We’ve run benchmarks of cross-cluster search operations simulating typical Kibana usage scenarios with various numbers of remote clusters — up to 150 clusters with 150,000 total shards! In those tests we saw common tasks like loading a Discover page or a dashboard load up to 10 to 80 times faster when minimizing round trips.
We also sometimes saw the average time (pink bars below) staying more consistent as we added more remote clusters.
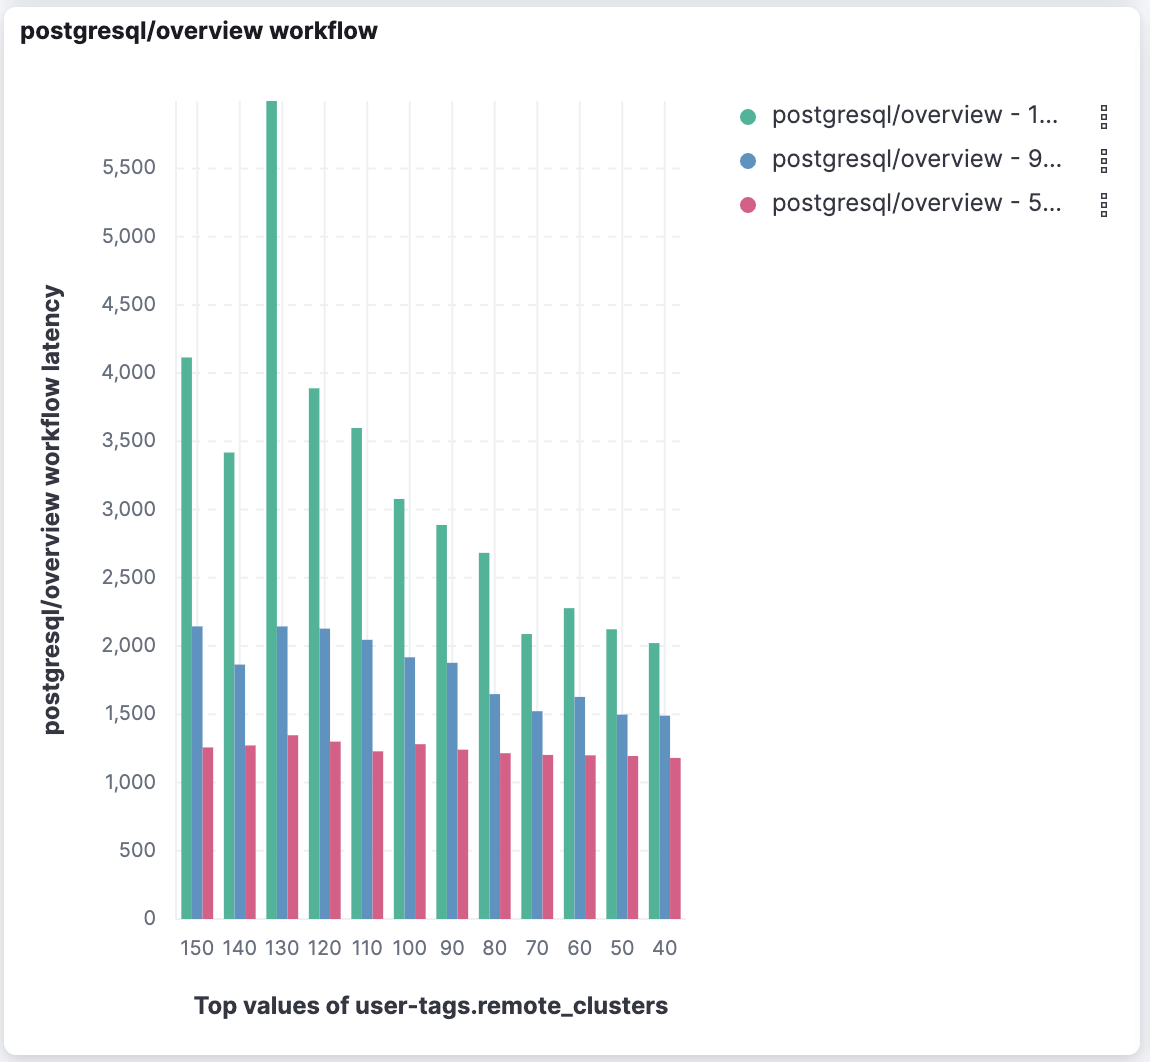
It tended to increase more noticeably without minimize round trips.
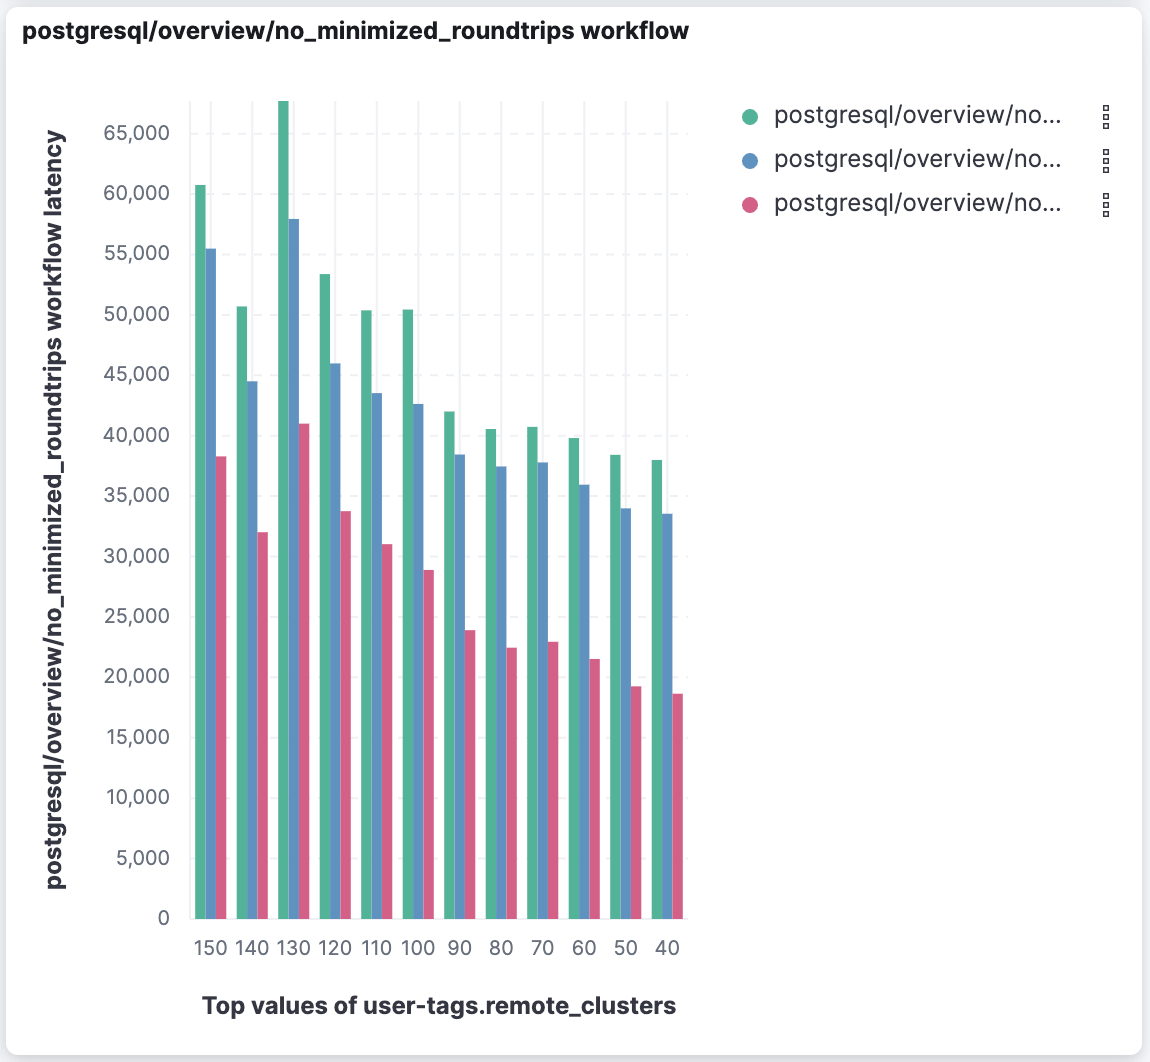
Overall, we expect a noticeable improvement in speed when using CCS in 8.9.
Faster and more reliable CCS searches against Cold and Frozen tier
We’ve also improved remote searching against Searchable Snapshots (Cold or Frozen tier data) with an optimization to do shard skipping. Local searches (non CCS) could filter out (skip) irrelevant shards using cluster state information, comparing the time range of the search request to min and max timestamps in shard metadata. CCS did not support this shard skipping mechanism when not minimizing round trips, until now.
In 8.9, we execute the can_match phase of search in the remote clusters. This makes search behave similarly with and without CCS, in that the coordinating node can determine which shards to skip, which is particularly important for cold and frozen indices. This can improve situations where there is latency between the local and remote clusters by not hitting remote clusters as frequently. Note this optimization is relevant only when not minimizing round trips. Cross-Cluster Searches with minimize round trips already had this capability. In 8.9, you’re covered either way.
Find ILM policies that are stuck with the Health Report
Index Lifecycle Management (ILM) automates your data management chores, performing rollover, shrink, merge, downsample operations, and more, and moving your data from one tier to the next so you can optimize for cost and performance tradeoffs. It does this through a series of actions (rollover, shrink, etc.) and steps (wait-for-active-shards, etc.). If ILM gets stuck in a step for too long, data can pile up in the wrong tier and lead to problems.
To help you notice earlier that ILM is stuck, we’ve enhanced the ILM Health Indicator in the Health Report API. New rules will check all the indices managed by an ILM policy according to the current action and step where they are at any time. For instance, if an index has been on the rollover > wait-for-active-shards combo for more than 24 hours or the step wait-for-active-shards has been retried more than 100 times, the indicator will turn yellow.
The time and retries thresholds can be changed using the health indicator settings.
This indicator will also show up in the Elastic Cloud Deployments console. You can more quickly identify an issue that could be causing cluster performance or stability issues. As with the rest of the Health report, we’ll indicate the possible impact and include a link to a relevant troubleshooting guide.
Geo line simplification
A popular use case for geographical data is that an asset generates a time series of positions, each with its own timestamp, and the system allows tracking the asset based on that time series. Elasticsearch now supports a simplification algorithm, to allow generating a line based on a smaller subset of position points (defined by the ‘size’ parameter), while minimizing the resulting inaccuracy. This capability is based on the time_series index mode infrastructure (TSDS). The simplification reduces memory consumption and supports creating complex geo_lines based on large sets of positions. Geo line simplification is released in tech preview.
Enhancements to visualizations and rule management
Elastic 8.9 delivers a number of enhancements to existing Kibana features — we are highlighting two of them below. Further, “Rules as code” significantly simplifies managing rules across multiple nodes in your cluster by leveraging Terraform to replicate them and apply version control — this facilitates maintenance of your monitoring rules for observability and security issues.
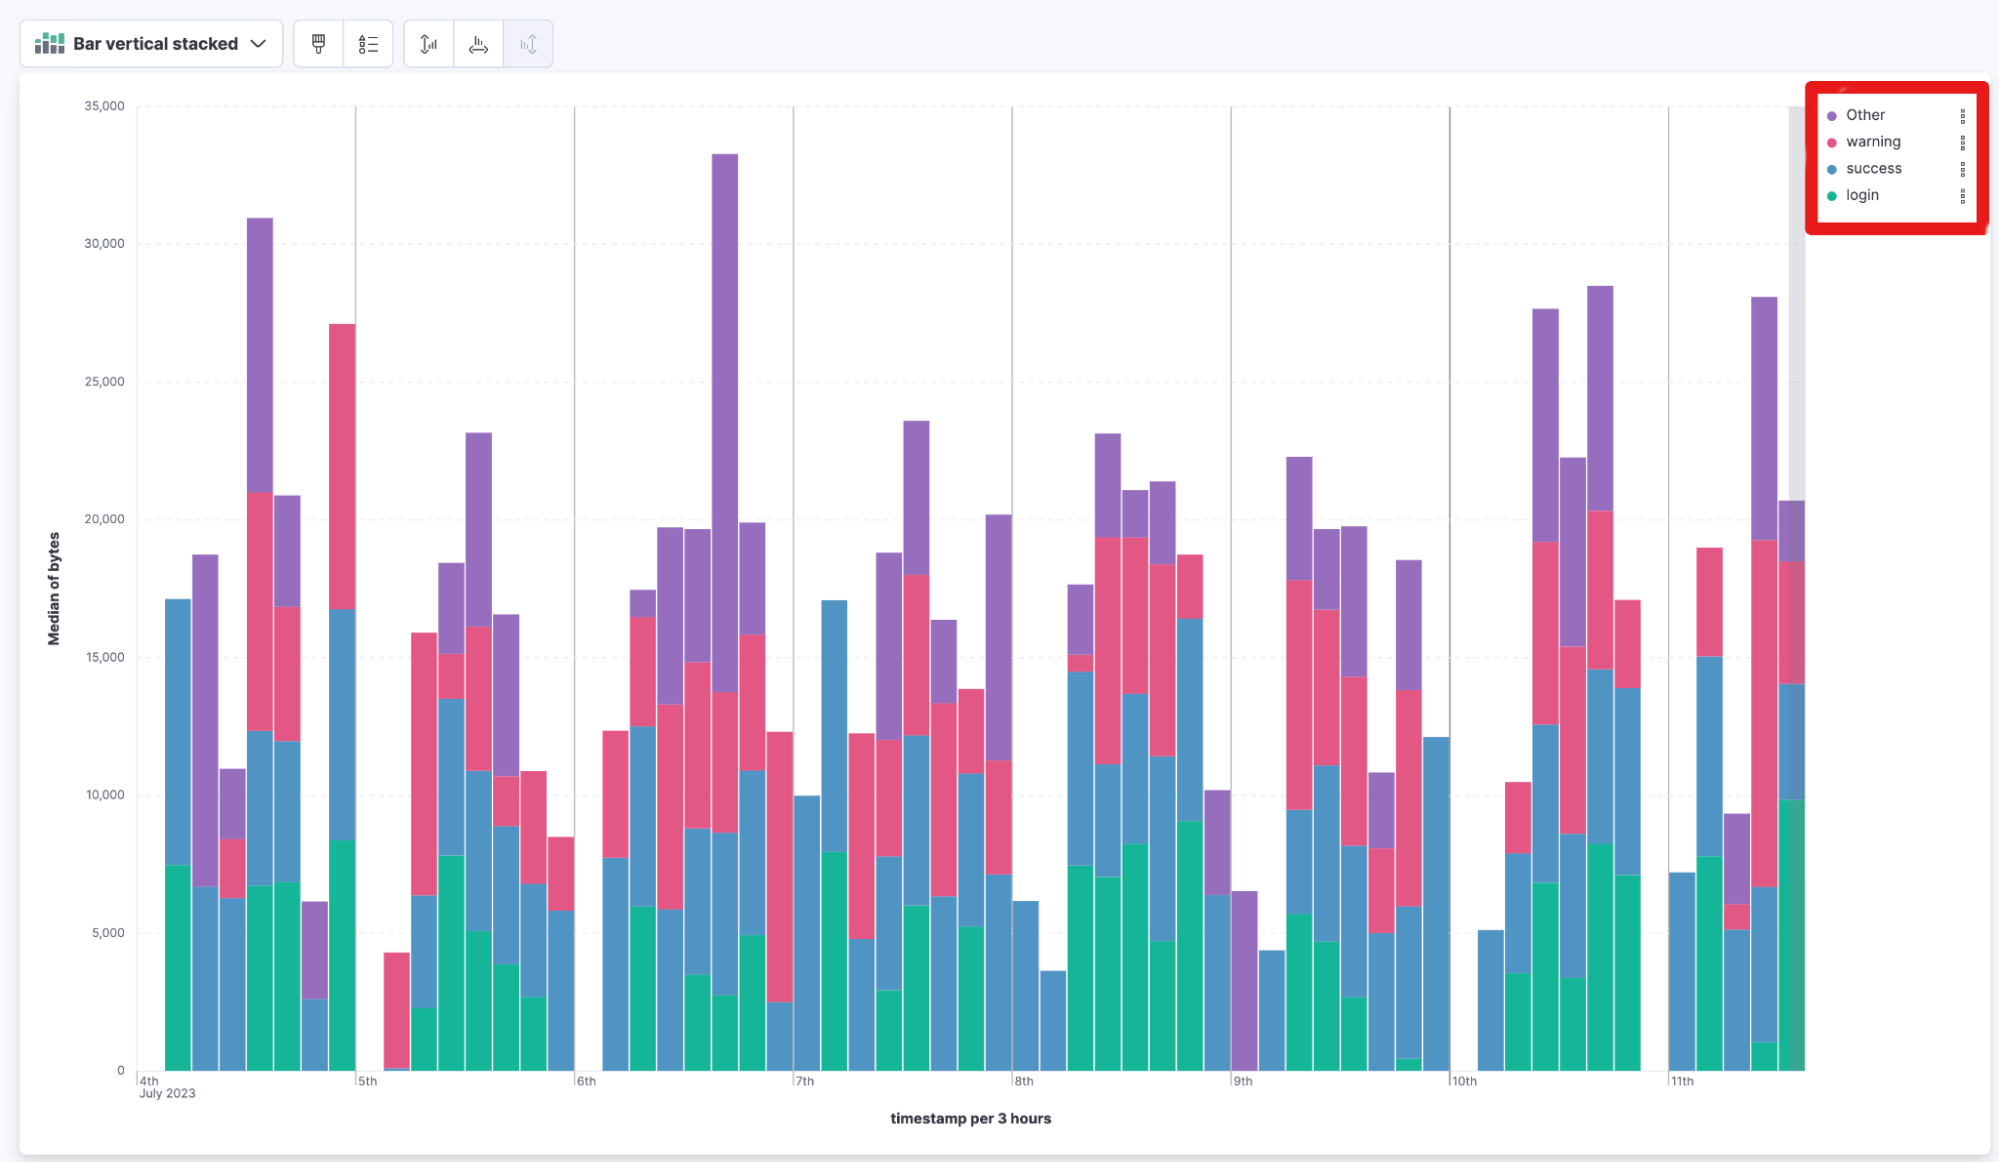
Kibana stacked bar chart legend
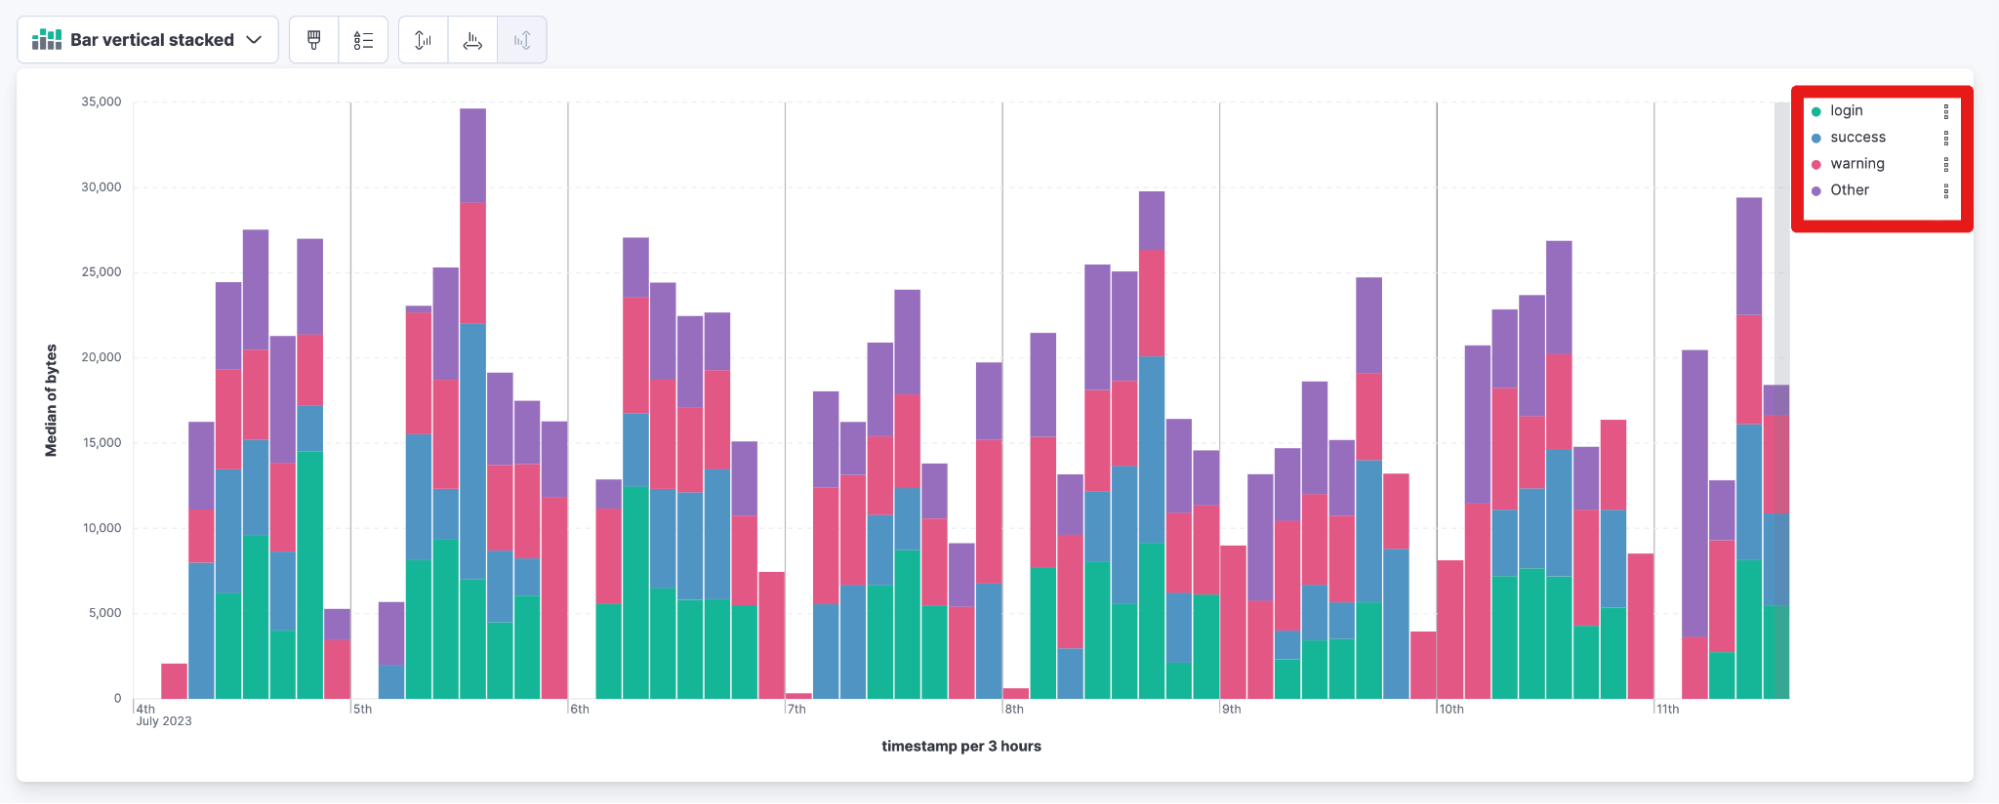
The order of stacked bar chart legends is now based on popularity with the most important element displayed on top. You no longer need to scroll to the bottom of the legend to find the most popular data in the chart.
Previously:
New starting with 8.9:
Kibana Lens step curve visual
Lens now supports three new options for line charts. The three options are straight, smooth, and step. Step curve line charts help users see clearly when data changes at irregular intervals, which helps to avoid misinterpretation. When creating visualizations select Line in the visualization type dropdown. Then use the visual options menu to choose between straight, smooth, or step in the Line interpolation dropdown.

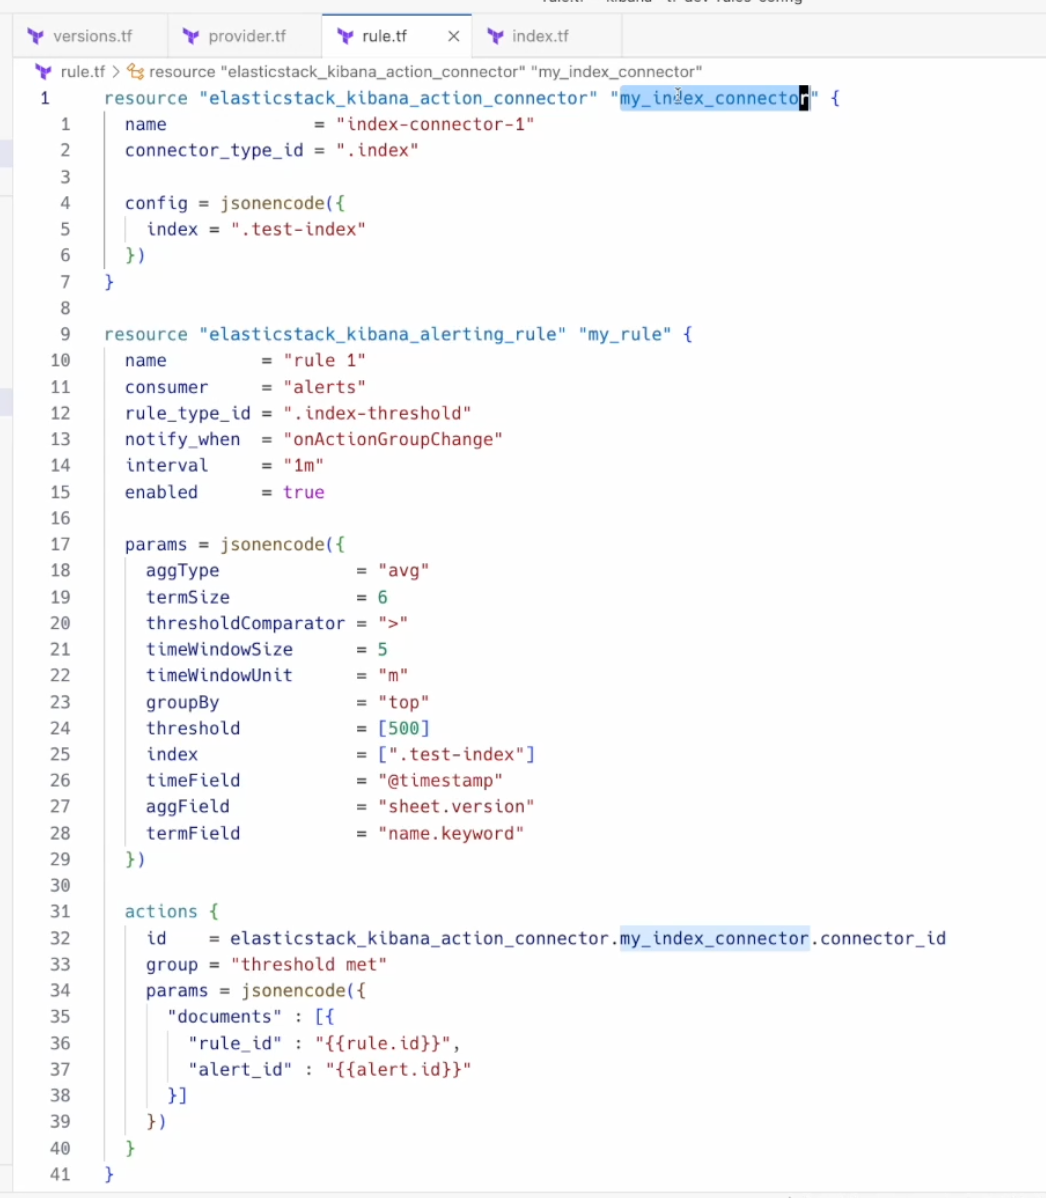
Rules as code
The Terraform Elastic Stack provider is released with a new capability that allows users to manage their alerting rules and connectors within Kibana. This empowers users to automate manual processes, manage multiple clusters from a single place, and unlock more use cases like version control.
Wait . . . there’s more!
Check out which other enhancements in Search, Observability, or Security may be relevant to you from the 8.9 release announcement blog! And find additional information on aforementioned features in What’s New in 8.9 Elasticsearch and What’s New in 8.9 Kibana for more details on that. FInally, the release notes will provide you with the complete list of all enhancements Elastic 8.9 delivers.
Try it out
Existing Elastic Cloud customers can access many of these features directly from the Elastic Cloud console. Not taking advantage of Elastic on cloud? Start a free trial.
The release and timing of any features or functionality described in this post remain at Elastic's sole discretion. Any features or functionality not currently available may not be delivered on time or at all.
Share
- Share on Twitter
Share on Twitter
- Share on LinkedIn
Share on LinkedIn
- Share on Facebook
Share on Facebook
- Share by Email
Share by Email
- Print this page
Print