Generating MITRE ATT&CK® signals in Elastic SIEM: Sysmon data
Editor’s Note — August 19, 2020: The Elastic SIEM solution mentioned in this post is now referred to as Elastic Security. The broader Elastic Security solution delivers SIEM, endpoint security, threat hunting, cloud monitoring, and more. If you're looking for more specific information on Elastic Security for SIEM use cases, visit our SIEM solution page.
Many mature security teams look to the MITRE ATT&CK® matrix to help improve their understanding of attacker tactics, techniques, and procedures (TTPs) and to better understand their own capabilities relative to these common adversarial approaches. With the release of Elastic Security 7.6, Elastic SIEM saw 92 detection rules for threat hunting and security analytics aligned to ATT&CK. We also introduced signals in Elastic SIEM, a feature that surfaces risk and severity scores based on these detection rules to enable efficient analyst triage.
Between the pre-defined detection rules and signals, security practitioners can easily uplevel pertinent alerts to rise above the noise. In this blog post, we'll outline a straightforward approach to detection that doesn't require any specific security, programming, or analytical knowledge — it's perfect for helping just about any security practitioner stay ahead of attacks.
Elastic SIEM signals
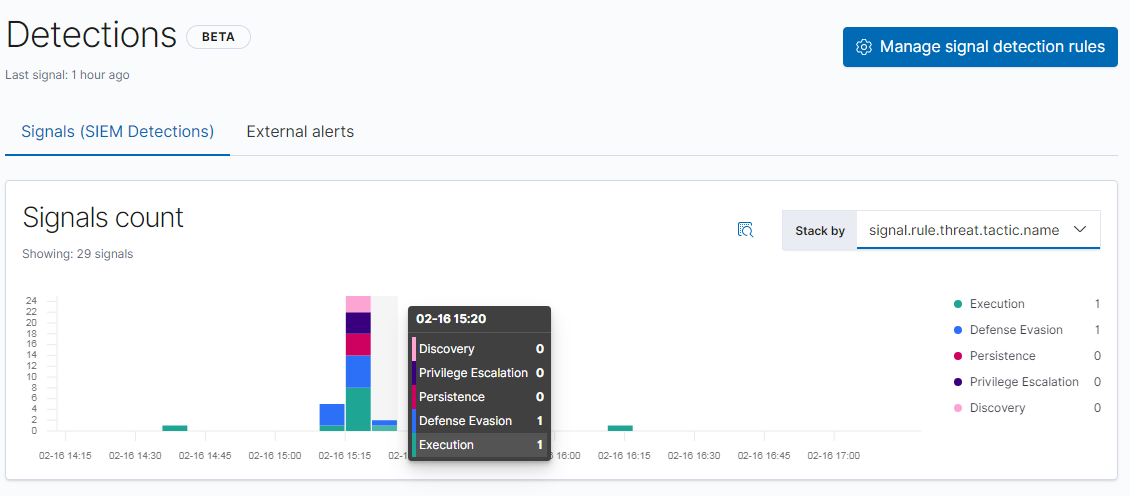
Detection rules in Elastic SIEM run every five minutes and output a “signal” when a given rule’s criteria is met. The signal is then displayed in the Detections page in the SIEM app. In this example, the signal chart has been pivoted to display signals by ATT&CK tactics:
One of the questions I am often asked is how to test or demonstrate detections like signals in the SIEM. There are a few things you should be aware of as you're getting started. The first is related to a default setting of each rule: lookback. Because the signal rules run every five minutes, as is often done in a SIEM, indexing data with timestamps from days or weeks ago will not trigger the default signal rules. If we wanted the rules to evaluate true on data far in the past, we could clone the rules and give them a longer lookback, but this would take a while and would result in duplicate rules with longer and more expensive searches. It is far simpler, easier, and faster to generate live activity in the present in order to trigger the existing signal rules. Live activity is also a more holistic systemic test, because you not only test the signal rules, but you test the entire pipeline from original activity to raw events to signal generation.
Holistic end-to-end SIEM testing using Windows events involves these steps as an alternative to re-ingesting data with timestamps in the past:
- Install and configure Sysmon or an equivalent event source
- Instrument the test system with a log shipper such as Winlogbeat which can gather and ship Sysmon events to an Elasticsearch cluster
- Verify that the Sysmon events are showing up in Kibana
- Verify that the relevant SIEM rules (for Windows in this case) are enabled
- Simulate threat activity using a test framework such as the one discussed below
- Observe the number and names of signals created in the SIEM
- In cases of missing signals, check for the presence or absence of the required events by running the search manually and examining the results
A word of caution
Before we go further here, there are some important considerations. Because the scripts we are going to use create realistic simulated threat activity, these tests should only be run on production endpoints in a workplace with the permission of your IT and Security organizations. Without security or support teams’ knowledge and permission, these scripts might trigger additional detection or response mechanisms and create unwanted work. This could include (but is not limited to):
- Activation of security detection and response tools
- Interruption of normal workplace software functions
- Activation of incident response procedures by security, operations, or help desk teams
- Dogs and cats living together in harmony and otherwise mass hysteria
Because of this, these tests should only be run in a lab environment or on a test computer designated for security testing unless you are authorized to perform security testing on your workstation. The same goes for personal systems at home — for the same reasons. It is highly recommended to not run security tests on your home computer where you do your computing. Use a virtual machine or instance instead.
It is also important to note that such tests should not be run in a workplace environment without authorization — simulated threat activity tends to resemble the real thing, as you might expect. Such test activity must be coordinated in advance with security teams and performed only by authorized testers in order to avoid accidentally triggering an incident. Check with your security team to determine where such simulations are expected to take place (and whether they are expecting you to be generating simulated threat activity.) Your company’s security team may be named “InfoSec” or just “Security.”
Shipping Sysmon event logs to Elasticsearch
Threat hunting rules that look for tactics and techniques like those in the ATT&CK matrix need several kinds of data sources in order to find and detect what they are looking for. Under Windows, one major popular datasource is Sysmon. Sysmon is a Windows-specific application that is capable of auditing file, process, network, and other operations that can be ingested by security solutions to identify threats or other activity.
Sysmon can record logs of most kinds of activities on a Windows host. These event logs are searched by the threat hunting rules to look for patterns of activity that match descriptions of threat tactics and techniques like those in the ATT&CK matrix that are often used by threat actors.
So what’s the catch? Sysmon is not present by default. Sysmon needs to be installed and configured to generate several events on Windows hosts being monitored. A sysmon instance could be configured to log only one event type or another — depriving the rules of the events they need — or even to log few or no events if it is not configured correctly.
Sysmon event logs need to be shipped to Elasticsearch so that Elastic SIEM can find them. Elastic makes this easy. Shipping can be accomplished several ways, including using a recent version of Winlogbeat or an ECS (Elastic Common Schema)-compatible Logstash pipeline. However the events are shipped, ECS compatibility is key, as the SIEM app and its associated detection rules, operate off this schema to work across any Elasticsearch cluster, anywhere.
Sysmon can generate a large amount of data from any population of Windows computers, so this datasource needs careful planning. If your Elastic clusters are already running at or near capacity, use caution. Don’t ship huge amounts of Sysmon data into a production Elasticsearch cluster until you are certain that sufficient capacity is available to handle the expected data volume.
In general, starting Symon with some default options like “-in” to install Sysmon and enable network events — in addition to the default of process execution events — will give you results from at least some threat hunting rules. For the purposes of this post, I am going to assume the following dependencies are met:
- You’re running an instance of Elastic Stack 7.6. There’s a free trial available if you need to get started. Alternatively, you can download the Elastic Stack manually and run it locally.
- In the SIEM app, in your 7.6 instance, the Windows rules have been enabled by selecting the 39 Windows rules. To do this, you can use the “Windows” tag and select the “Activate selected” choice from the Bulk Actions dropdown menu.You’ll need to be in the rule manager for this, accessible by clicking “Manage signal detection rules” after installing the default rules. Detailed documentation for working with rules is available.
- At least one Windows testbed instance is shipping Sysmon events into your Elasticsearch instance (this can be confirmed by searching by hostname) and is available for security testing. These Sysmon events are being shipped by a recent Winlogbeat instance or an ECS-compatible alternative pipeline. Note: Winlogbeat does not ship Sysmon logs by default; this needs to be enabled as in this example.
Configuring signals
Let’s get after it. First, we need Python 2.7 (download link).Download the relevant installer — most likely the Windows x86–64 MSI Installer — to your Windows testbed instance. Run the installer using the defaults and install Python in C:\Python27 (or another drive like D: if local policies require).
After the installation, you should be able to invoke the Python interpreter from inside the relevant directory by doing a “cd C:\Python27” and then “python”.
On the same Windows instance designated for security testing — again, a lab or test instance, not a computer used for doing work — download the following project from Github
Note: because this archive contains some dual-use programs, it may be blocked by an antivirus program in whole or in part. You may need to create exceptions in order to download the archive if you are authorized to modify antivirus configurations on your testbed computer. Also note: if you are about to run this on a workplace computer, this is your last chance to stop and avoid possibly creating some chaos among the aforementioned dogs and cats.
Locate the zip archive in the downloads folder and decompress it. Copy the contents of the archive into the directory where Python was installed (C:\Python27 in our example.)
In a command prompt, navigate to this folder by doing a “cd C:\Python27” and then “python run_all.py”
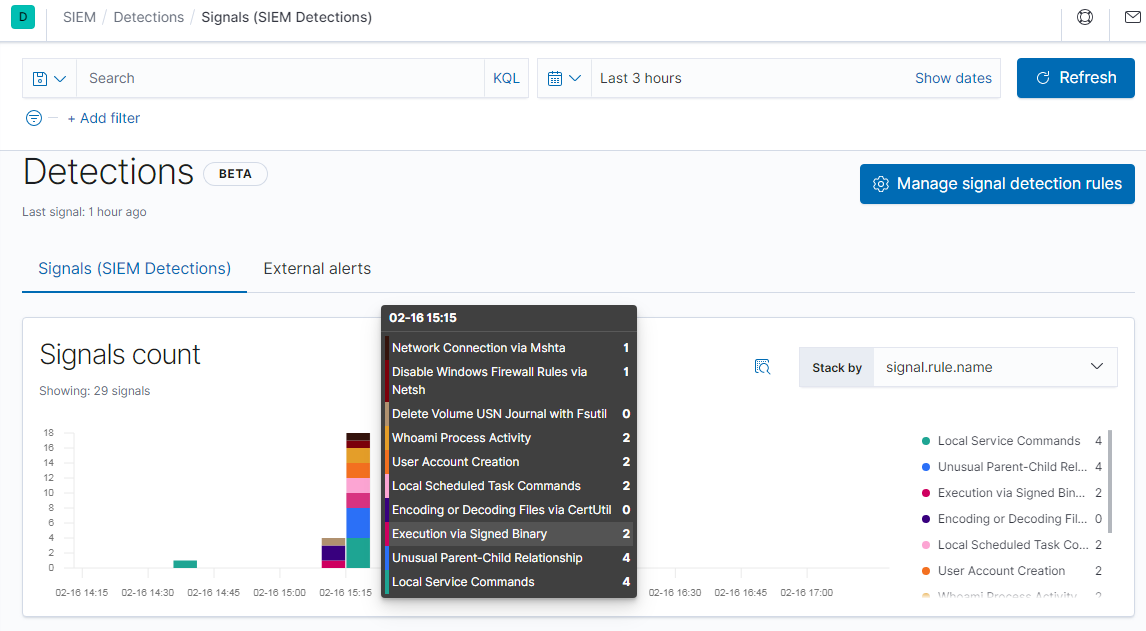
Within five minutes (the signal rules run every five minutes) you should see a number of signals appear in the Detections page. The histogram chart can be sorted by many fields, including by ATT&CK tactics as seen above, or by rule name as seen here:
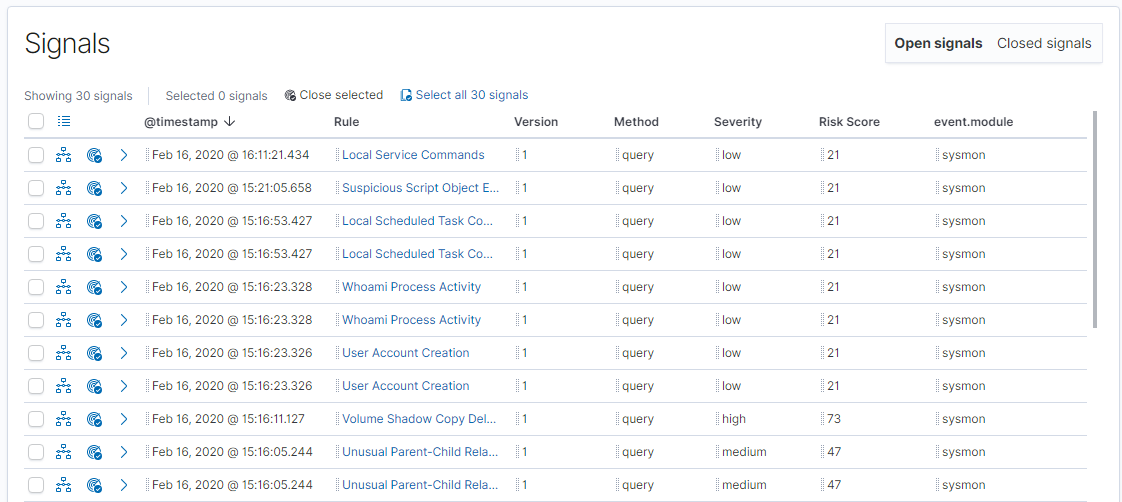
A bit further down the page, you can see the signals listed by name. This last can be expanded and searched via the query input at the top. After a search, you have the option to select and close a set of signals as a group.
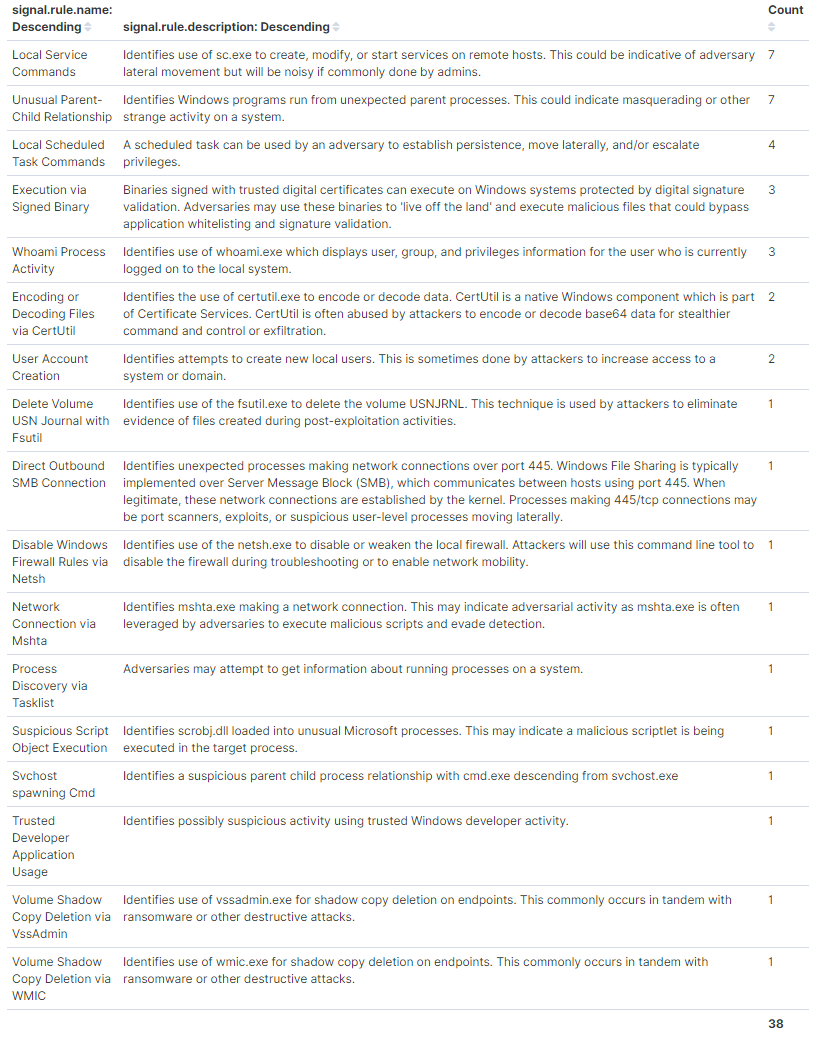
After running the test suite, if everything worked, you should see at least 38 instances of these 17 signals below. If you do not see all 17, the rules may not all be enabled. If all of the Windows rules are enabled, some tests may have been blocked; Sysmon events may not be getting successfully produced or shipped by the Windows instance; or they may not have been sent in ECS format.
Conclusion
This concludes our overview on generating signals in the SIEM using Sysmon data. In this post we considered the advantages of end-to-end testing with live data. We covered setting up a Sysmon data pipeline and running testing frameworks to generate simulated threat activity in order to cause Elastic SIEM rules to evaluate true and create signals. The processes covered here should enable most any user to quickly and easily populate an Elastic SIEM instance with example threat hunting signals with no specialized knowledge required.
Try Elastic SIEM for free today.