Ruby on Rails application monitoring with the Elastic Stack
Ruby on Rails application monitoring with the Elastic Stack
Recently, at the Tochigi Ruby Conference, I gave a presentation on monitoring Ruby on Rails applications.
Here’s a quick overview. The slides (in Japanese) are here. The application used in the demo is published on GitHub.
Points to keep in mind for application monitoring
I introduced the following monitoring areas:
- Uptime monitoring
- Host and application metrics
- Monitoring logs
- Application performance monitoring (APM)
The app created for this demo posts questions from participants. During a session, participants post any questions they have, and at the end of the session there is a Q&A session based on the posted questions.
Some details about the application:
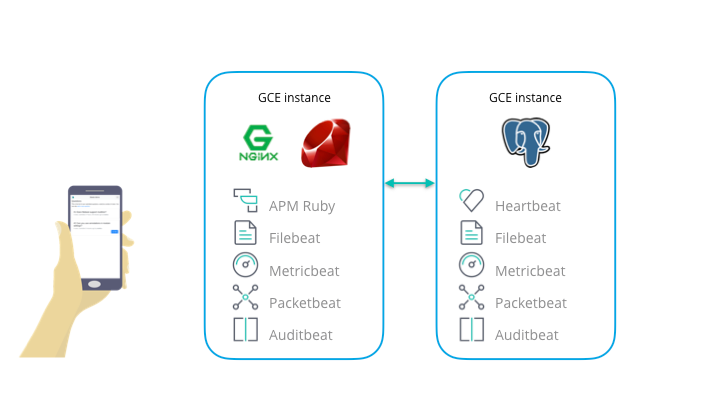
It is composed of a frontend (NGINX + Rails) and backend (PostgreSQL). On each server, Metricbeat, Filebeat, Auditbeat, and Packetbeat were installed, along with Heartbeat on the backend and the Elastic APM Ruby Agent on the frontend. Then, logs and metrics for each type of monitoring explained below were collected. Also, setup was minimized by using Elasticsearch Service for data storage and visualization. Elasticsearch Service allows you to set up Elastic APM Server, Elasticsearch, and Kibana in a cloud environment. There’s also a 14-day trial, so if you’re interested in monitoring you can get started right away.
Monitoring the various areas
Uptime monitoring
The most important thing in monitoring is whether or not the application status as seen from outside the application is normal. The Elastic Stack enables easy monitoring of HTTP, TCP, and ICMP using Heartbeat. For this demo, I used the following monitoring settings:
- ICMP: each server
- HTTP: Rails application page, NGINX server status page
- TCP: PostgreSQL port 5432
heartbeat.monitors:
  - type: icmp
    schedule: '@every 5s'
    hosts:
      - frontend.{{ domain }}
      - backend.{{ domain }}

  - type: http
    urls: ["https://www.{{ domain }}/about/about"]
    schedule: "@every 10s"
    timeout: 3s
    check.response.status: 200

  - type: http
    urls: ["https://www.{{ domain }}/server-status"]
    schedule: "@every 10s"
    timeout: 3s
    check.response.status: 200

  - type: tcp
    hosts: ["tcp://backend.{{ domain }}:5432"]
    schedule: "@every 10s"
    timeout: 3s
    name: postgresql
You can view this data in the Uptime app in Kibana. The Uptime app allows you to easily monitor the availability of servers or apps.
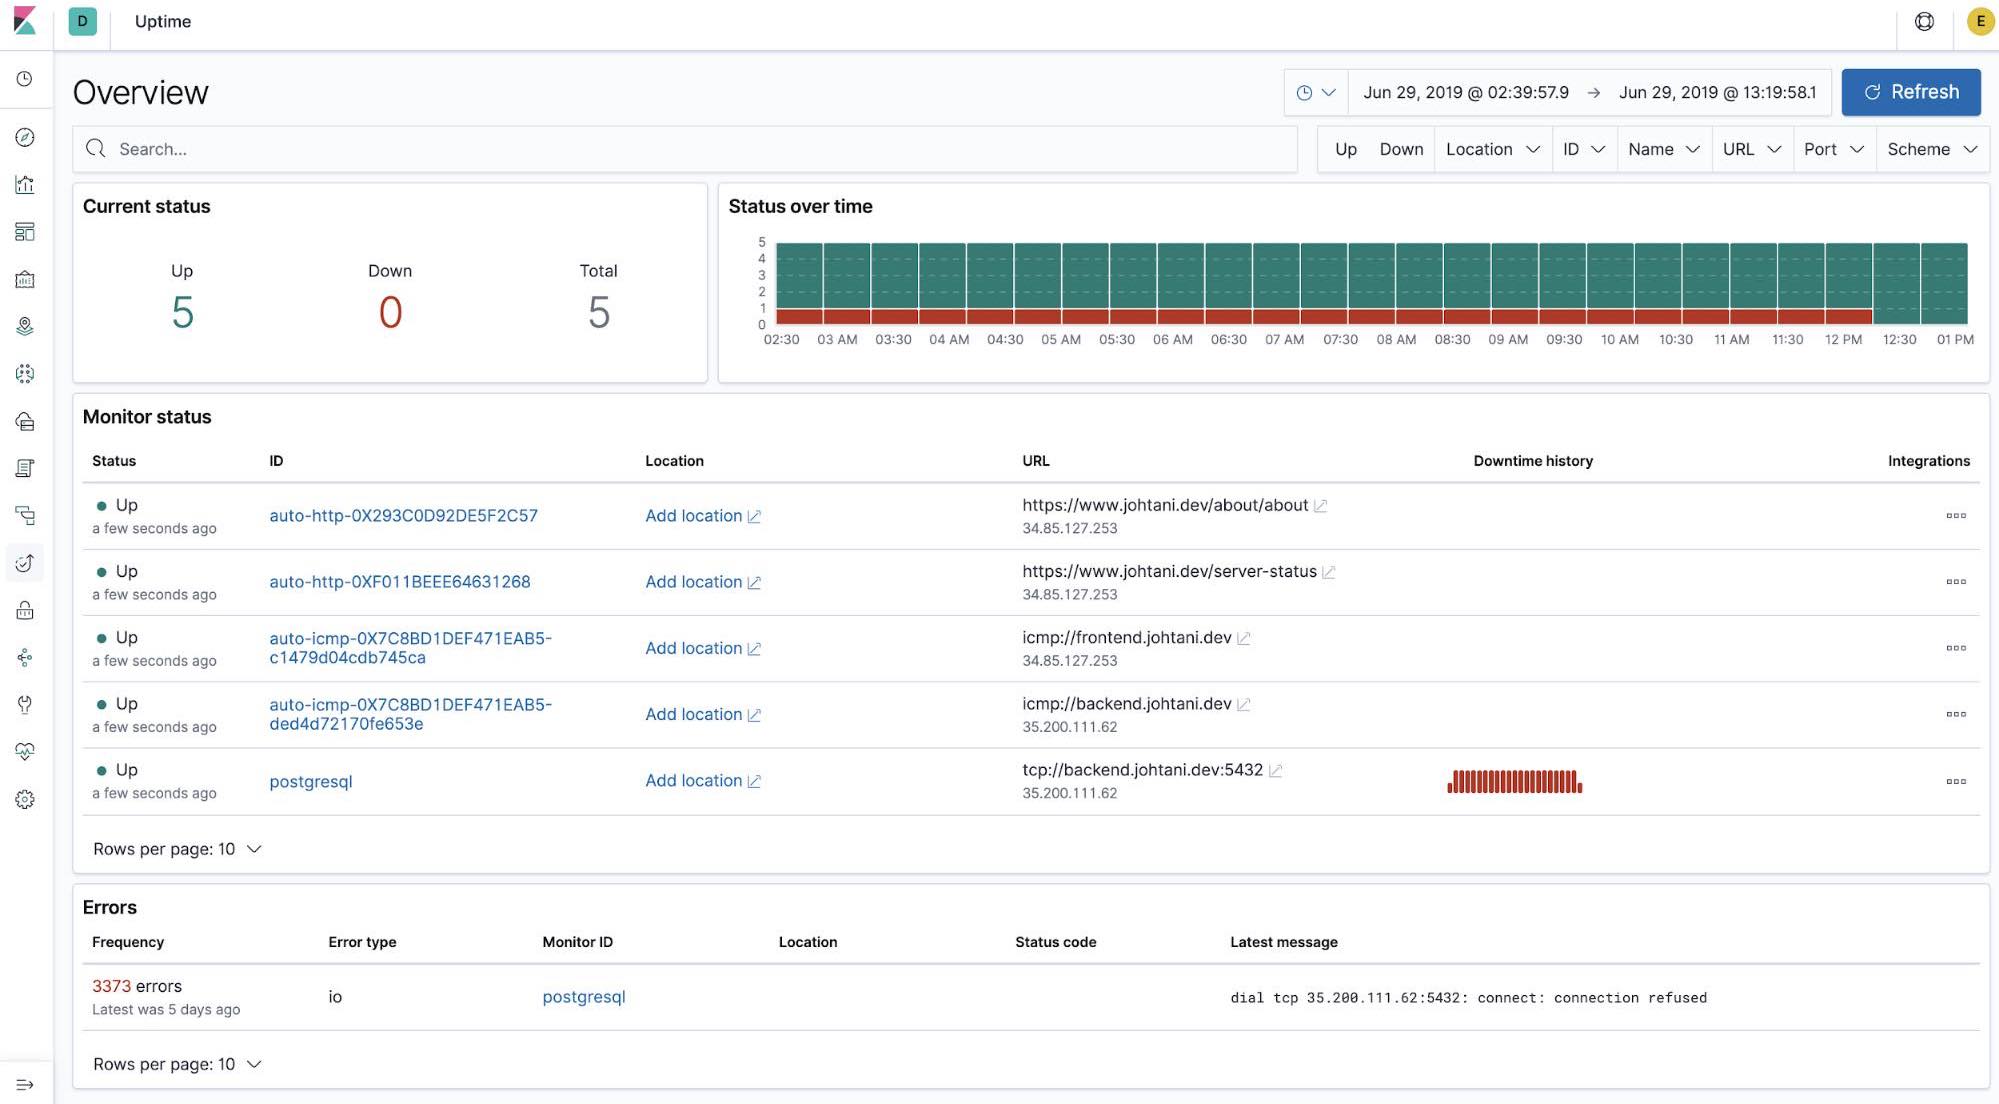
With the release of 7.2 came the ability to move from the Uptime app to our other observability apps (Logs, Infrastructure, and APM) with one click.
Host and application metrics
Once you have found the issue with your server or application, the next step is often to check metrics — the state of resources such as CPU and memory.
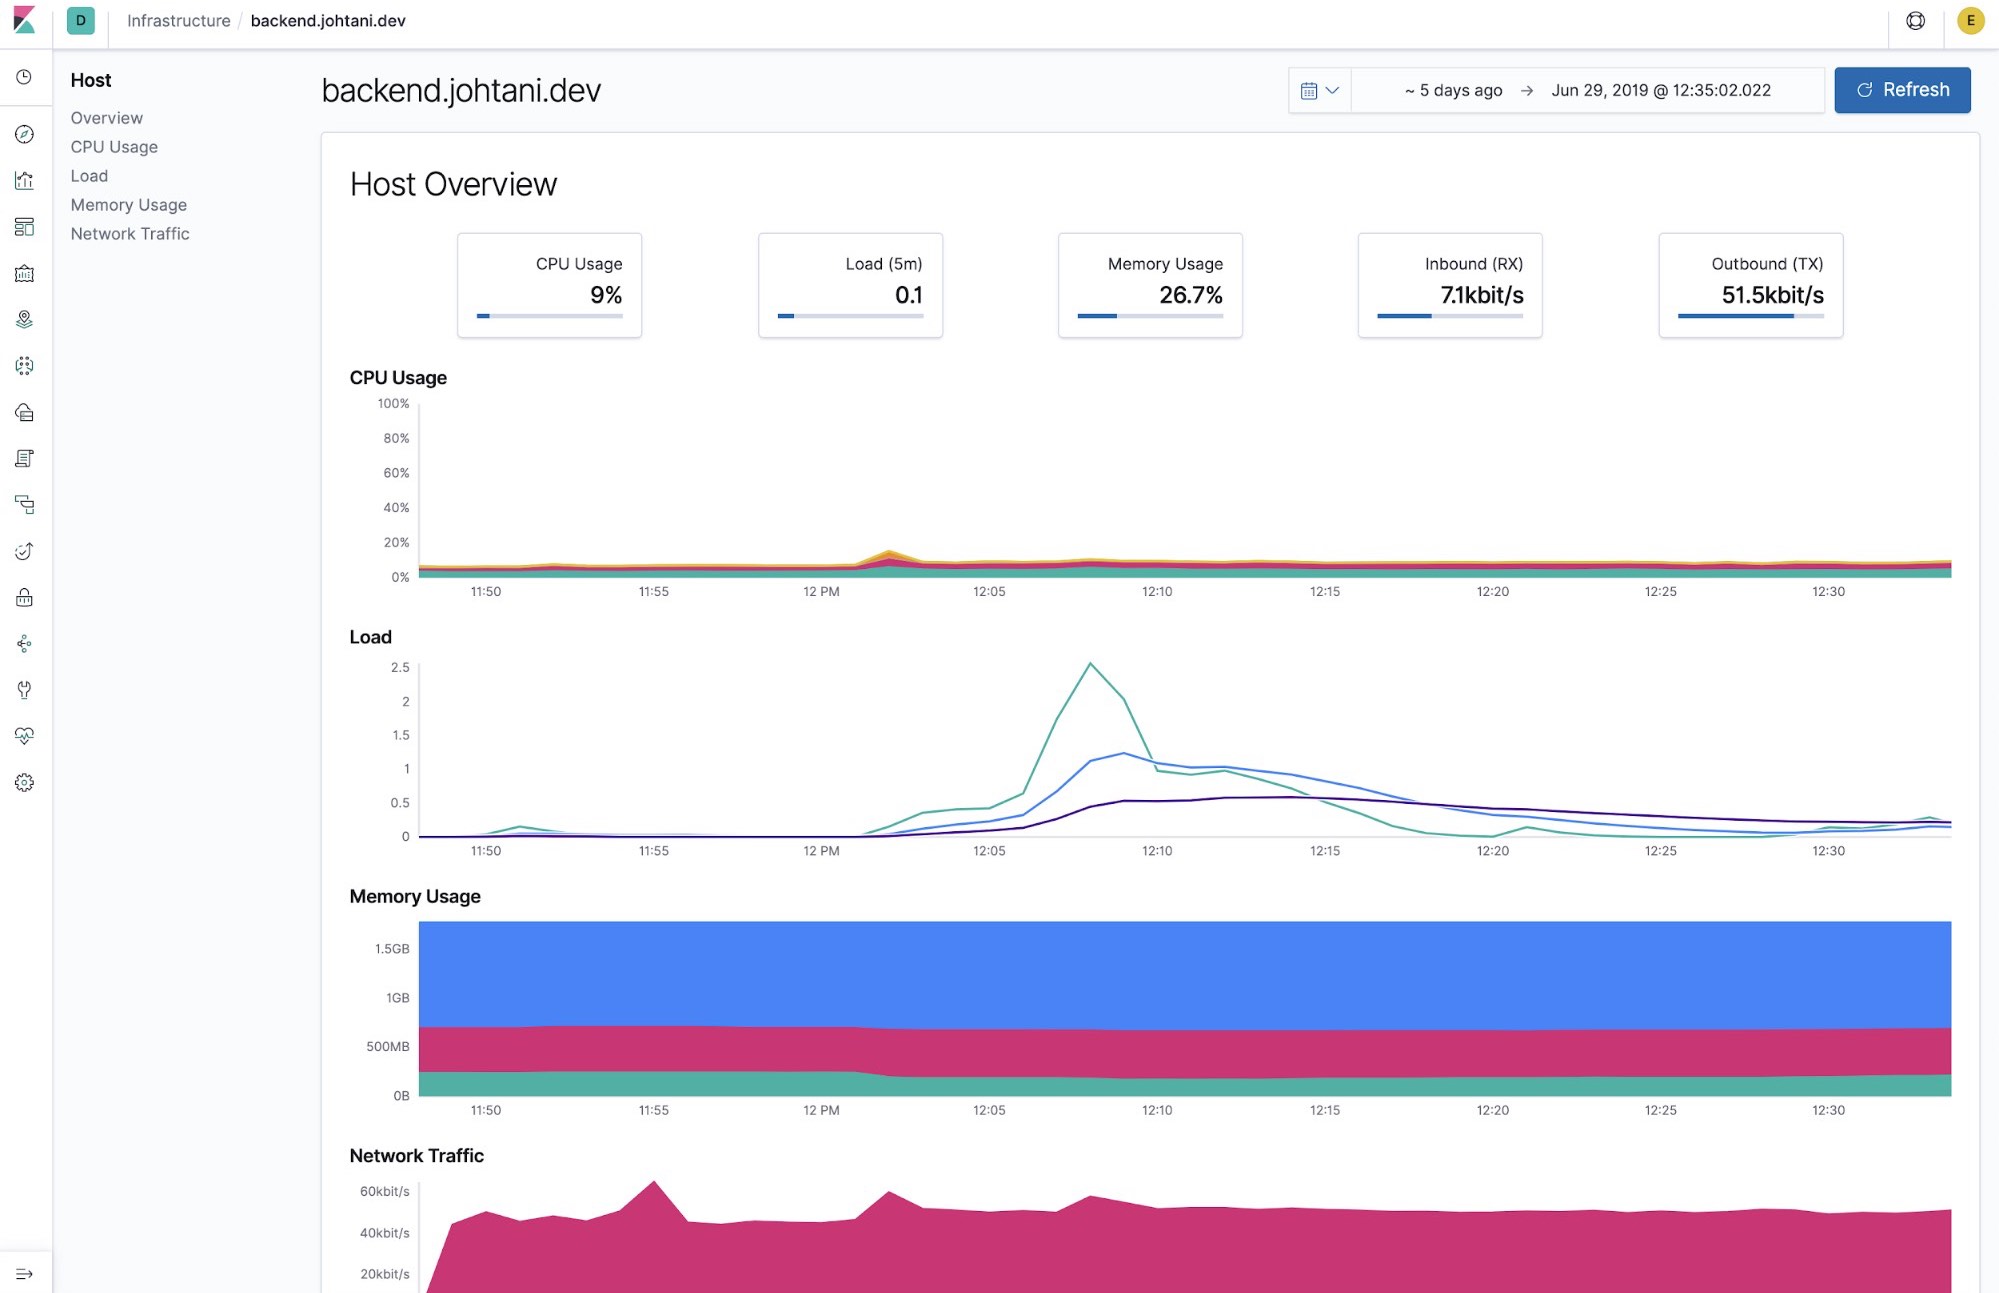
Metricbeat is a part of the Elastic Stack that is used to collect host information (CPU usage, memory, files, disk I/O, etc.) for monitoring. In addition, it can also collect statistical information (metrics) about NGINX and PostgreSQL. Check out the Metricbeat modules documentation for more information.
Host information can be viewed on the following screen using the Infrastructure app in Kibana.
Monitoring logs
Logs are useful when you want to get detailed information about a problem. This demo operated under the assumption that PostgreSQL database server processes had stopped. Also, the PostgreSQL port number was specified as a target for uptime monitoring by Heartbeat, but the demo proceeded without displaying it.
In such cases, the problem often becomes clear when you look at the application server logs (the connection error was output to the logs even in this demo).
However, for application server logs, depending on the type of server or application, it may not be a good idea to ingest the text logs directly into the Elastic Stack.
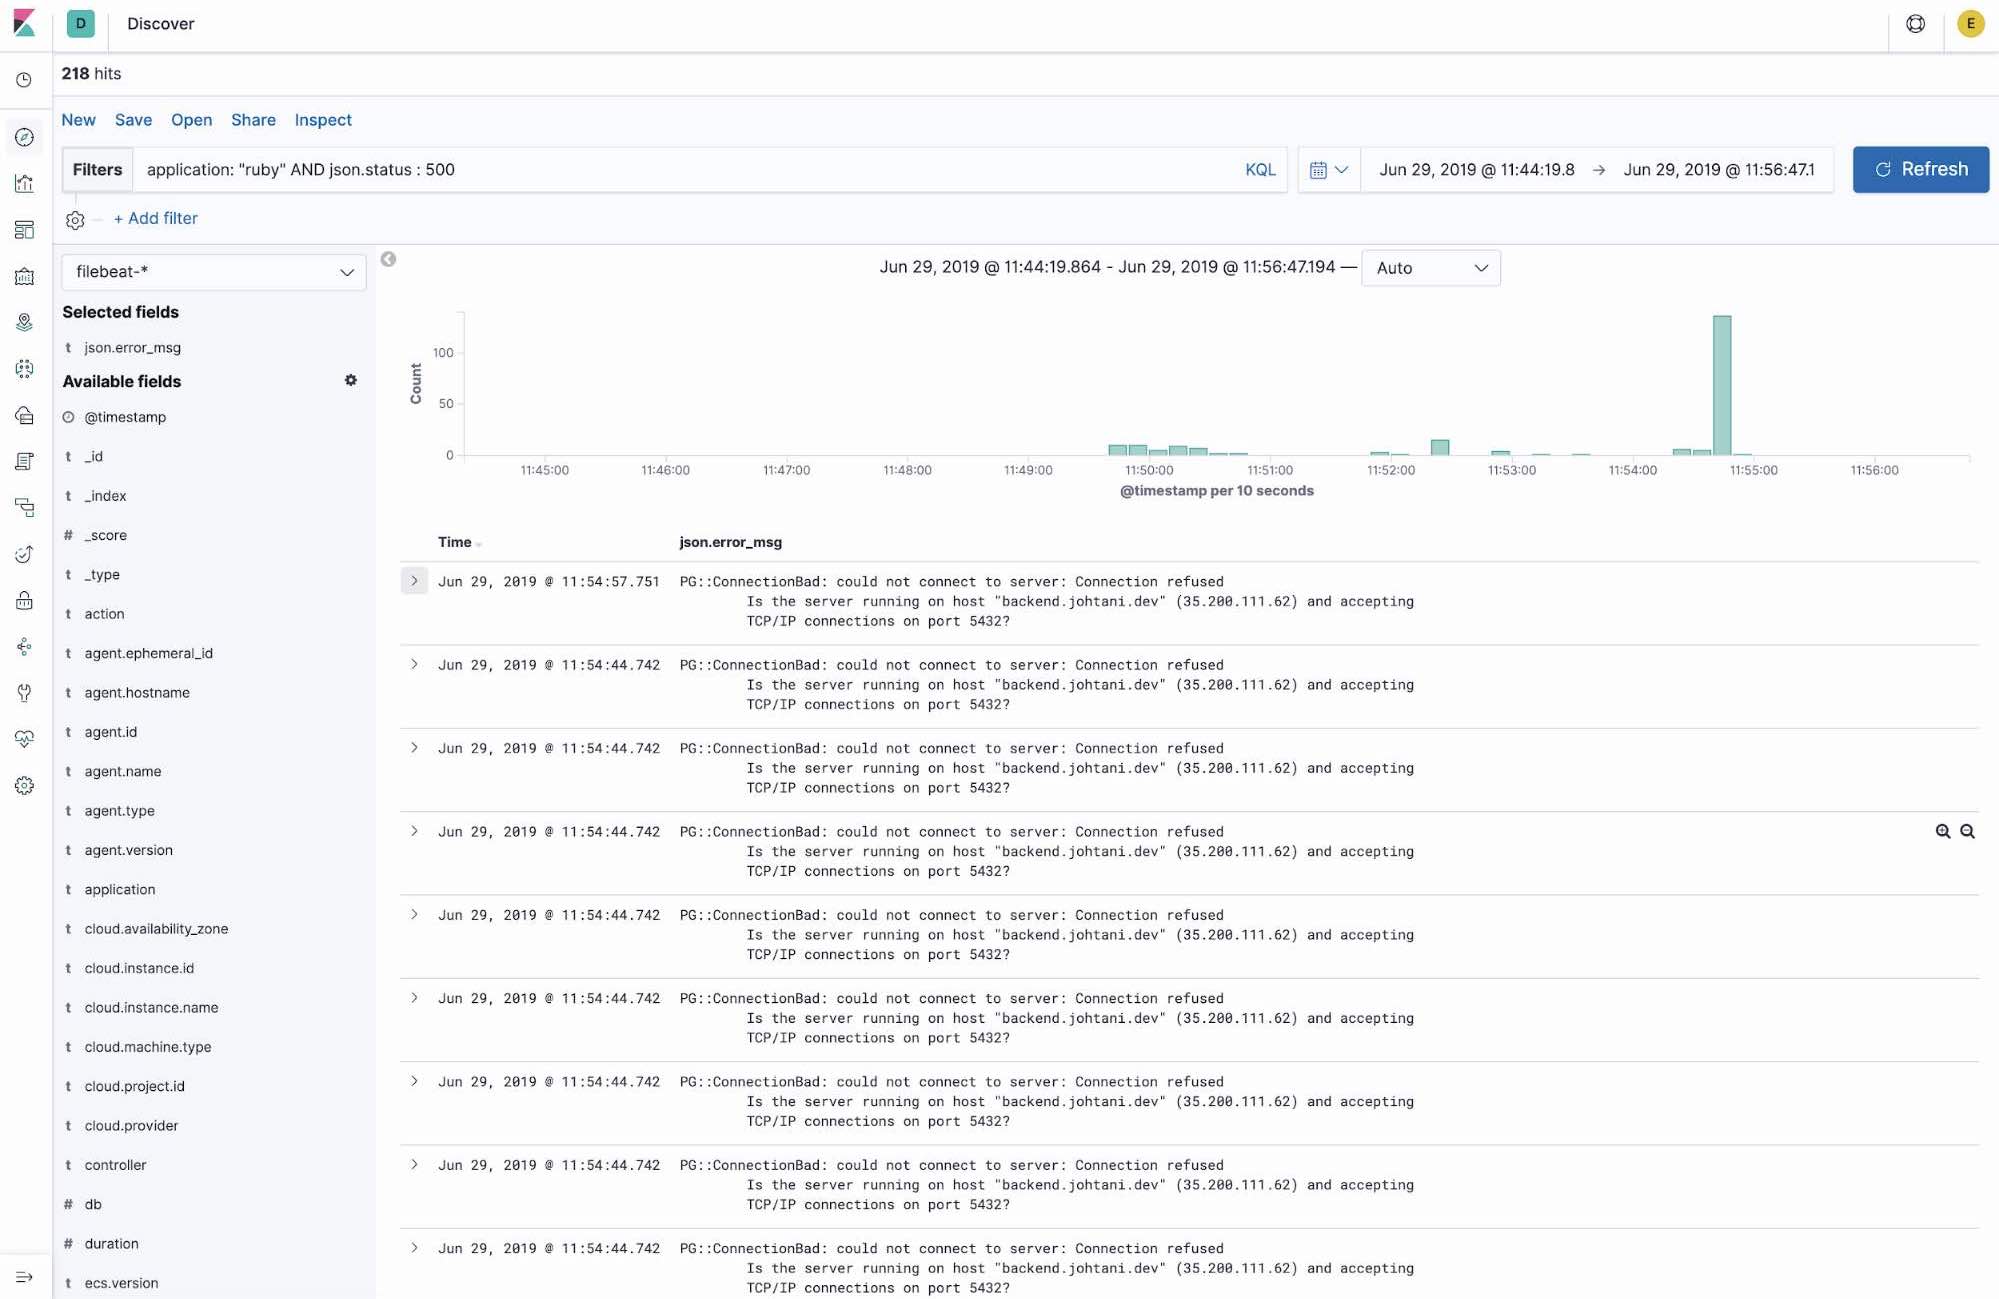
This demo used a library called Lograge, and logs were output as one JSON per request to Rails and then ingested.
It is also possible to use the multiline function to ingest logs. However, if you are considering ingesting logs from the application development stage, output in JSON format, as in this case, will make ingest easier.
In the demo, the filter “application: ruby” was added on the Discover screen, returning the actual application logs and demonstrating the flow for identifying problems. This application field is a tag added in the Filebeat settings. By adding information such as where the target log file was obtained, it is possible to further narrow down the information more easily.
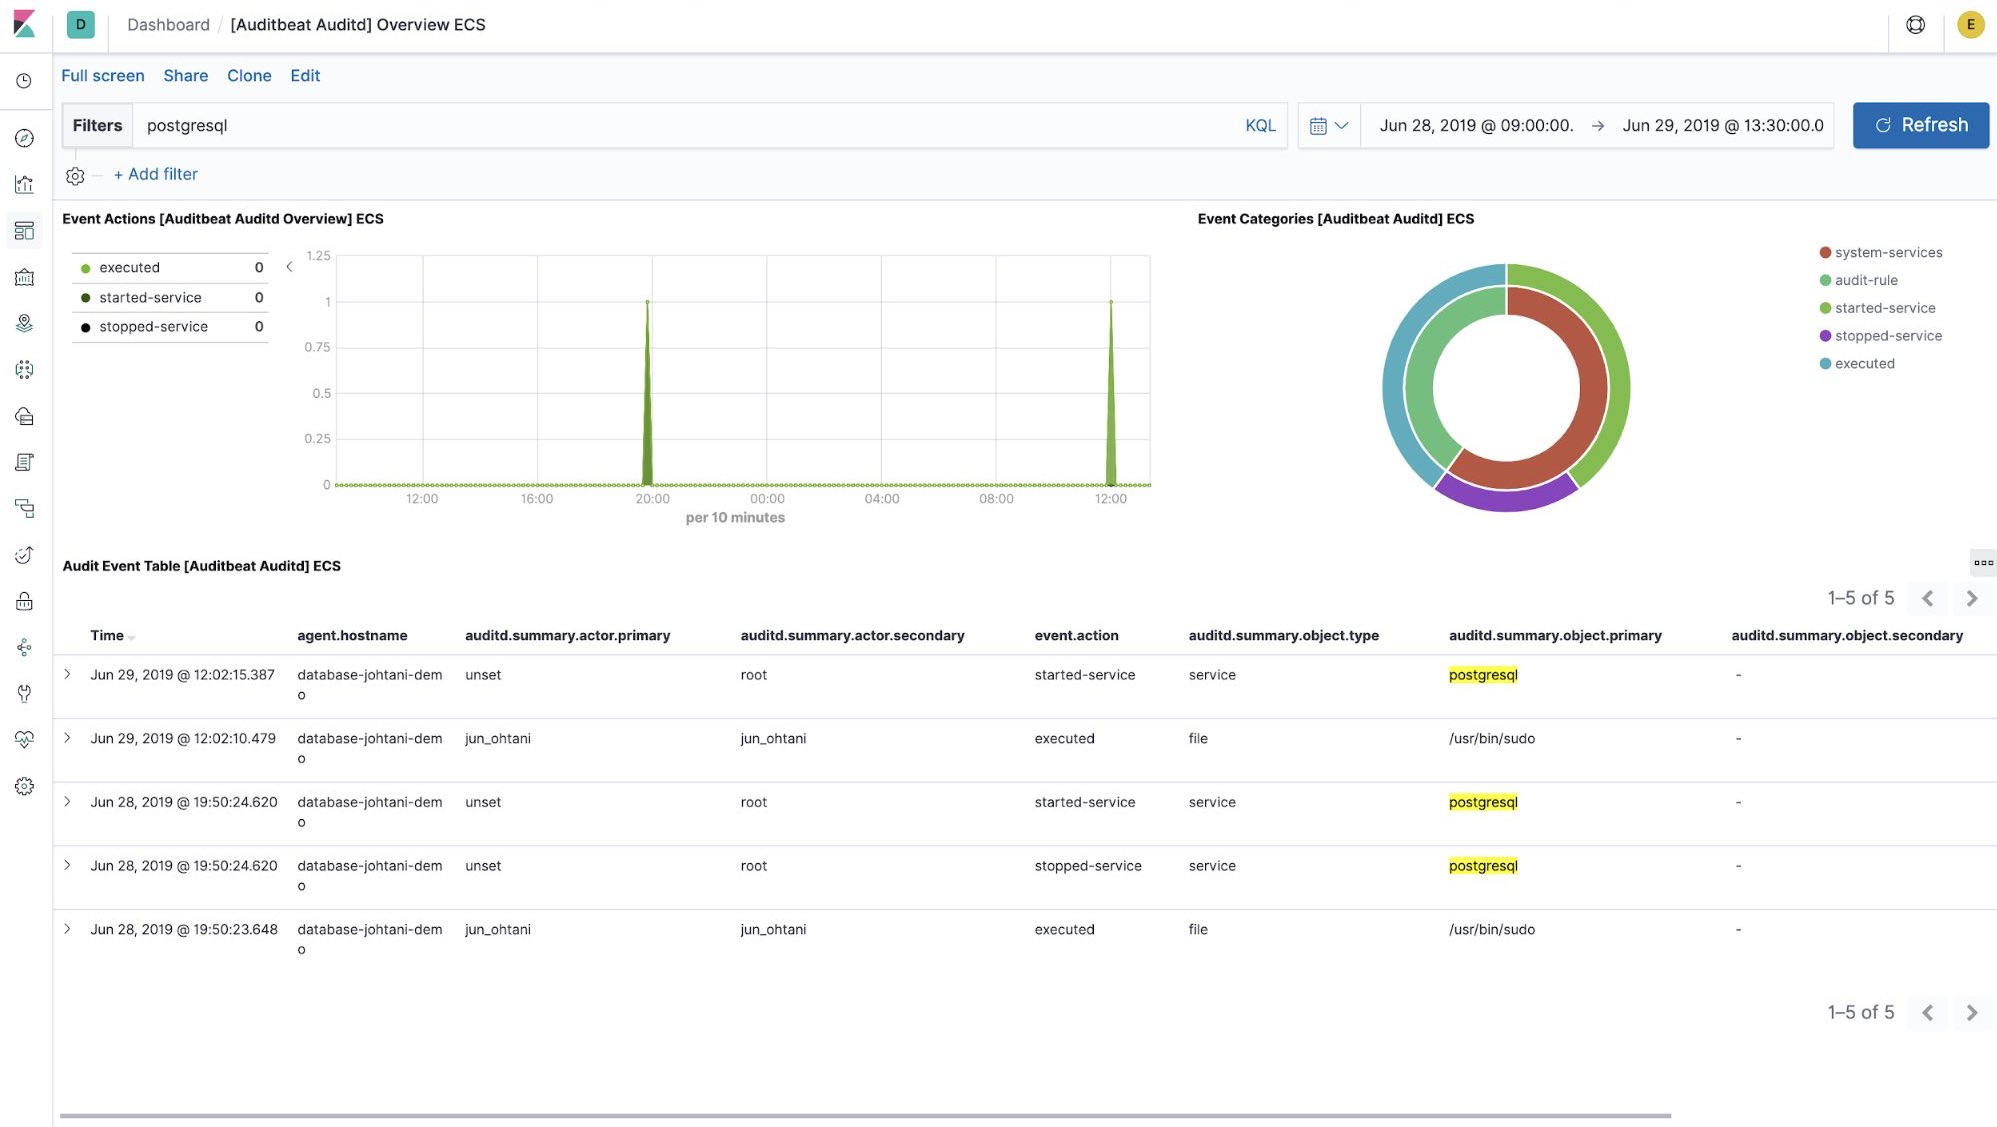
Other logs may also be important. Auditbeat collects audit logs such as those for process stops/starts, file tampering detection, and logins. If the process has stopped, who stopped it, and when? It is possible to find out by looking at audit logs. The screen below shows an Auditbeat dashboard of logs related to the starting and stopping of PostgreSQL processes.
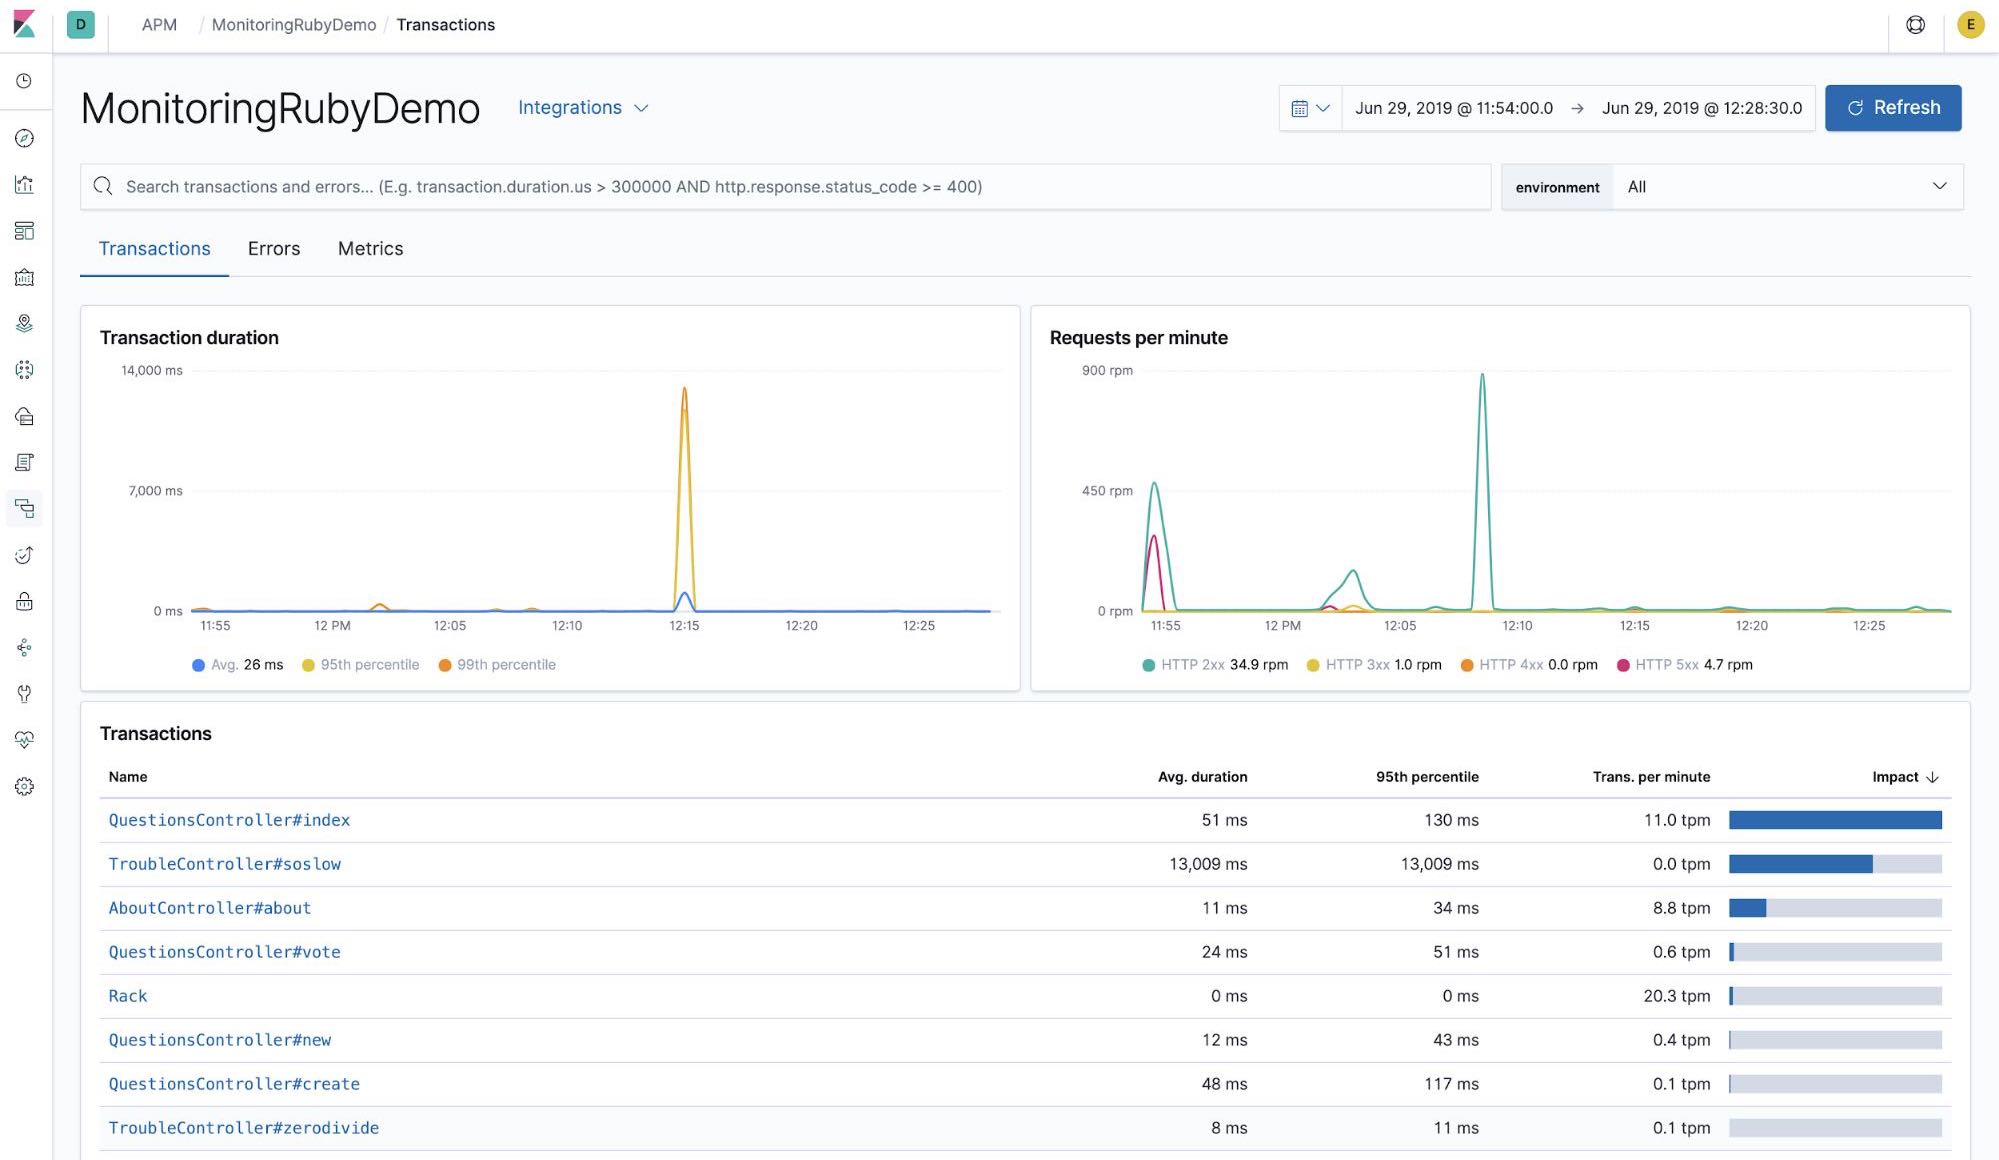
APM
Finally, there’s APM. Information on the inside of the application is also important for quickly finding problems inside the application. The uptime monitoring, metrics, and logs that we have discussed so far all observe the application or system from the outside. However, in order to analyze information such as which application processes are slow, it is necessary to add debug and measurement logs and deploy your application.
That’s where Elastic APM comes in. You just load an APM agent into the application you are developing and the agent measures the application and sends the measurement data to Elasticsearch.
When using Elastic APM with Ruby on Rails, configure the agent as follows. First, add the gem for the agent that you’d like to use to the Gemfile.
# For Elastic APM
gem 'elastic-apm'
Then, create a file called elastic_apm.yml in the config directory, and add your server URL and secret token.
server_url: <%= ENV['ELASTIC_APM_SERVER_URL'] %>
secret_token: <%= ENV['ELASTIC_APM_SECRET_TOKEN'] %>
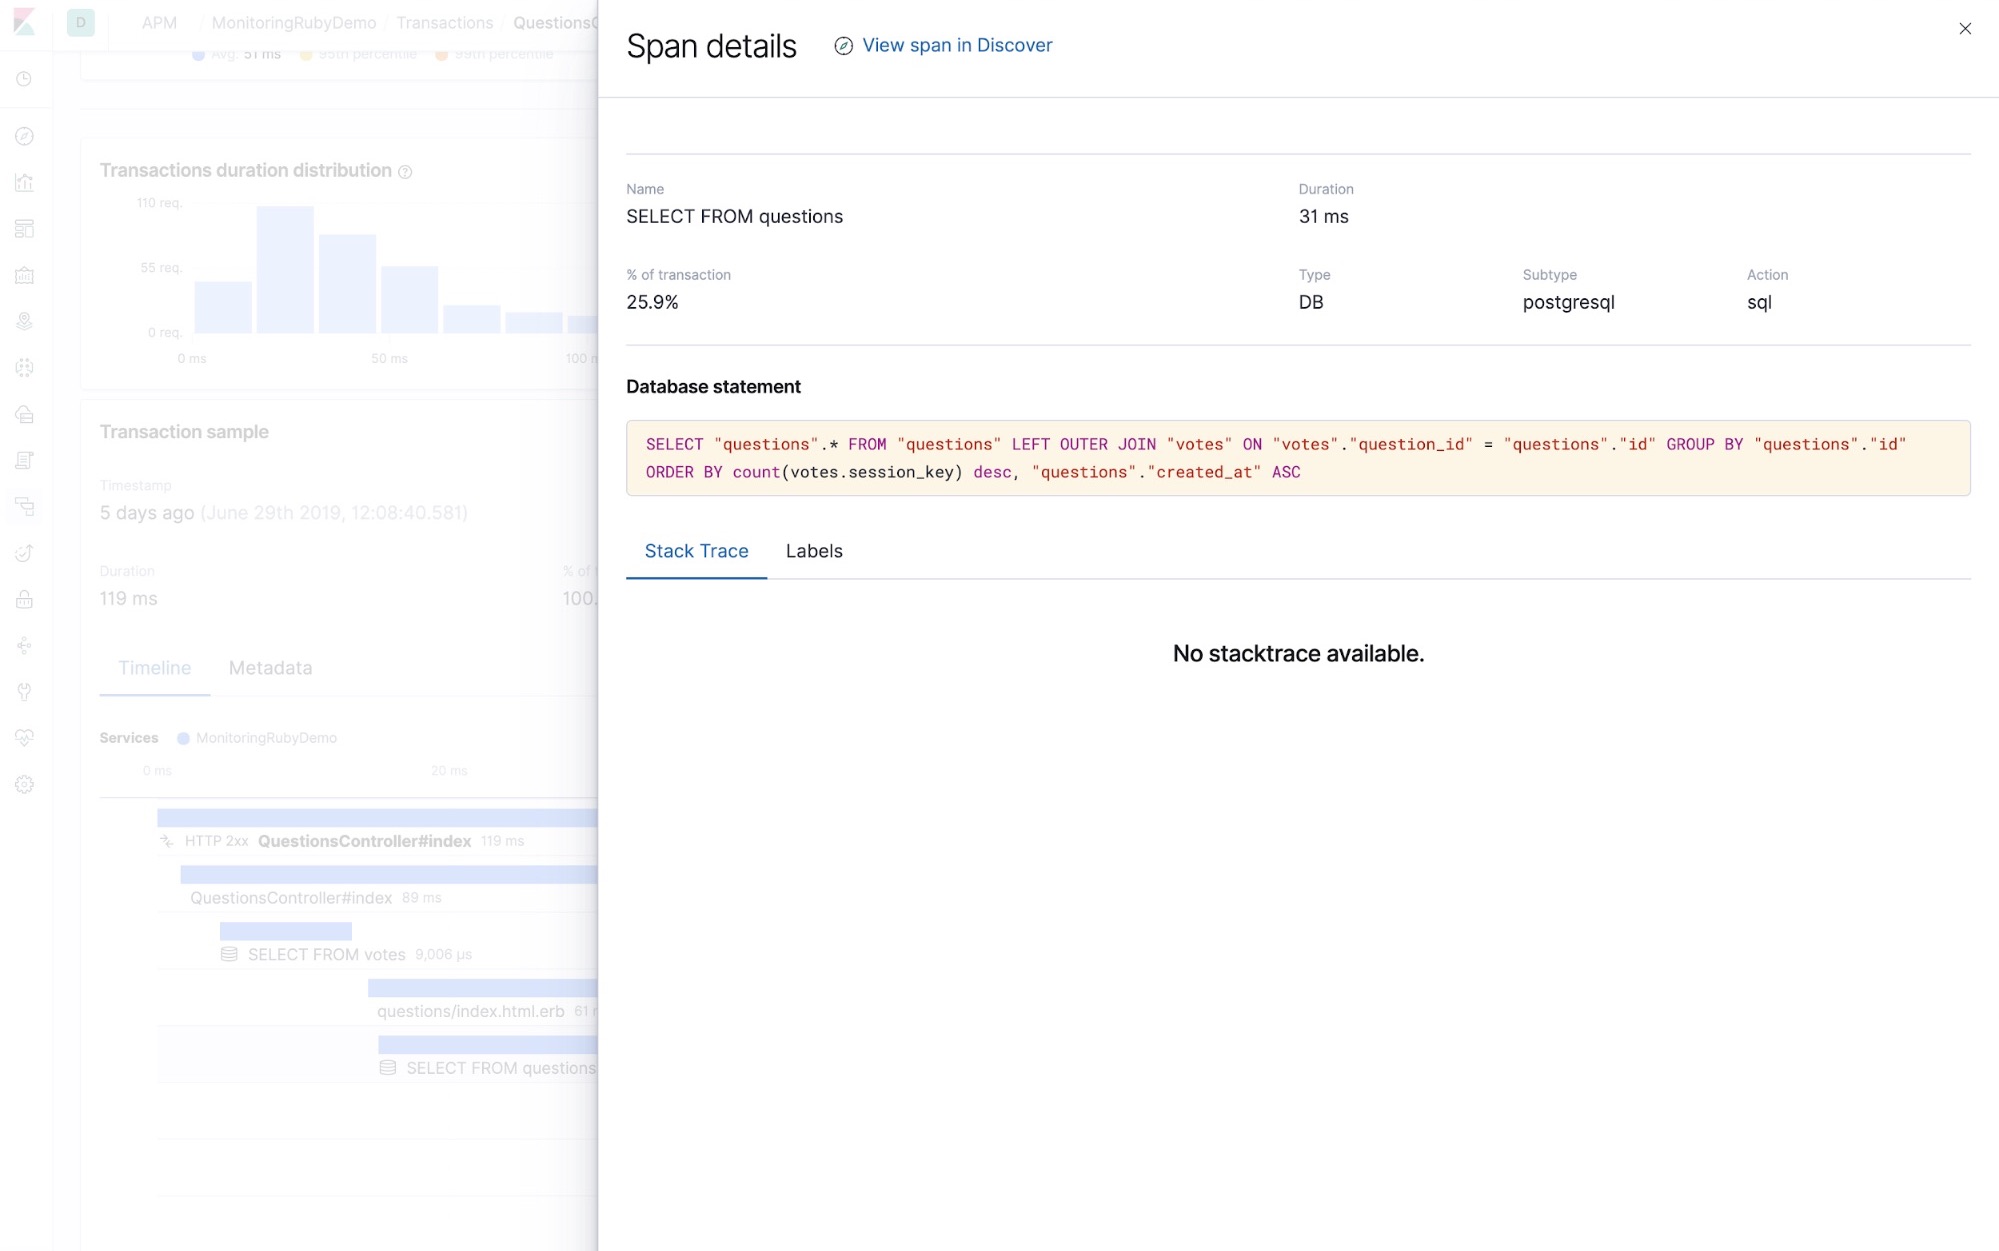
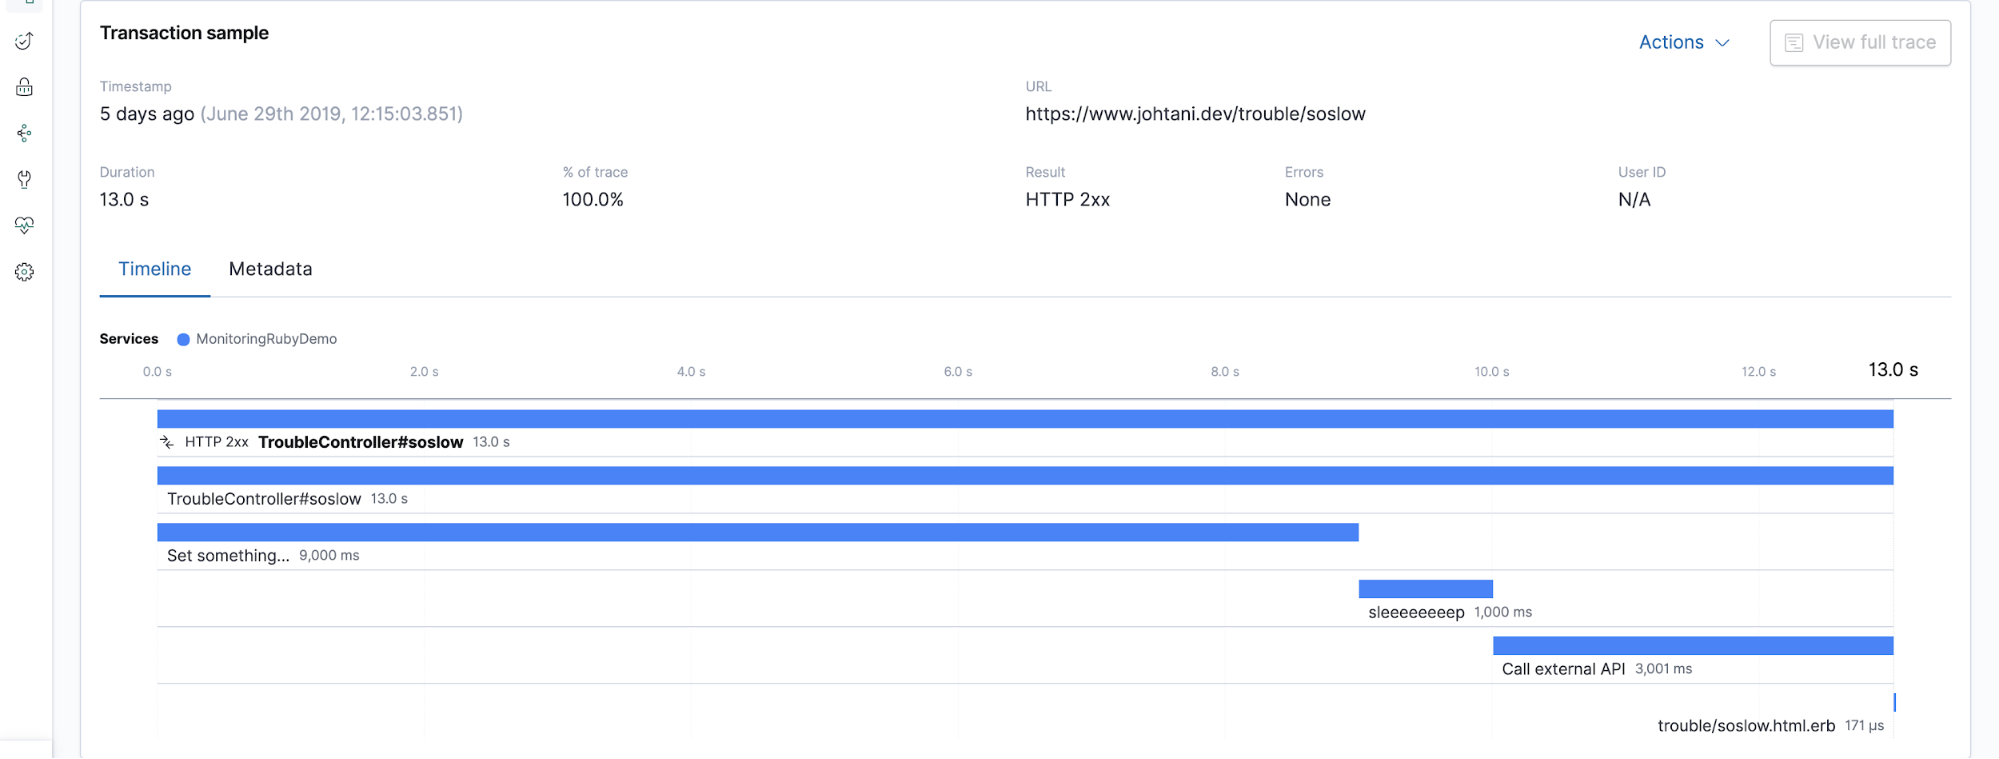
That’s it! The agent will automatically measure the processing time of actions and SQL calls within the Rails framework.
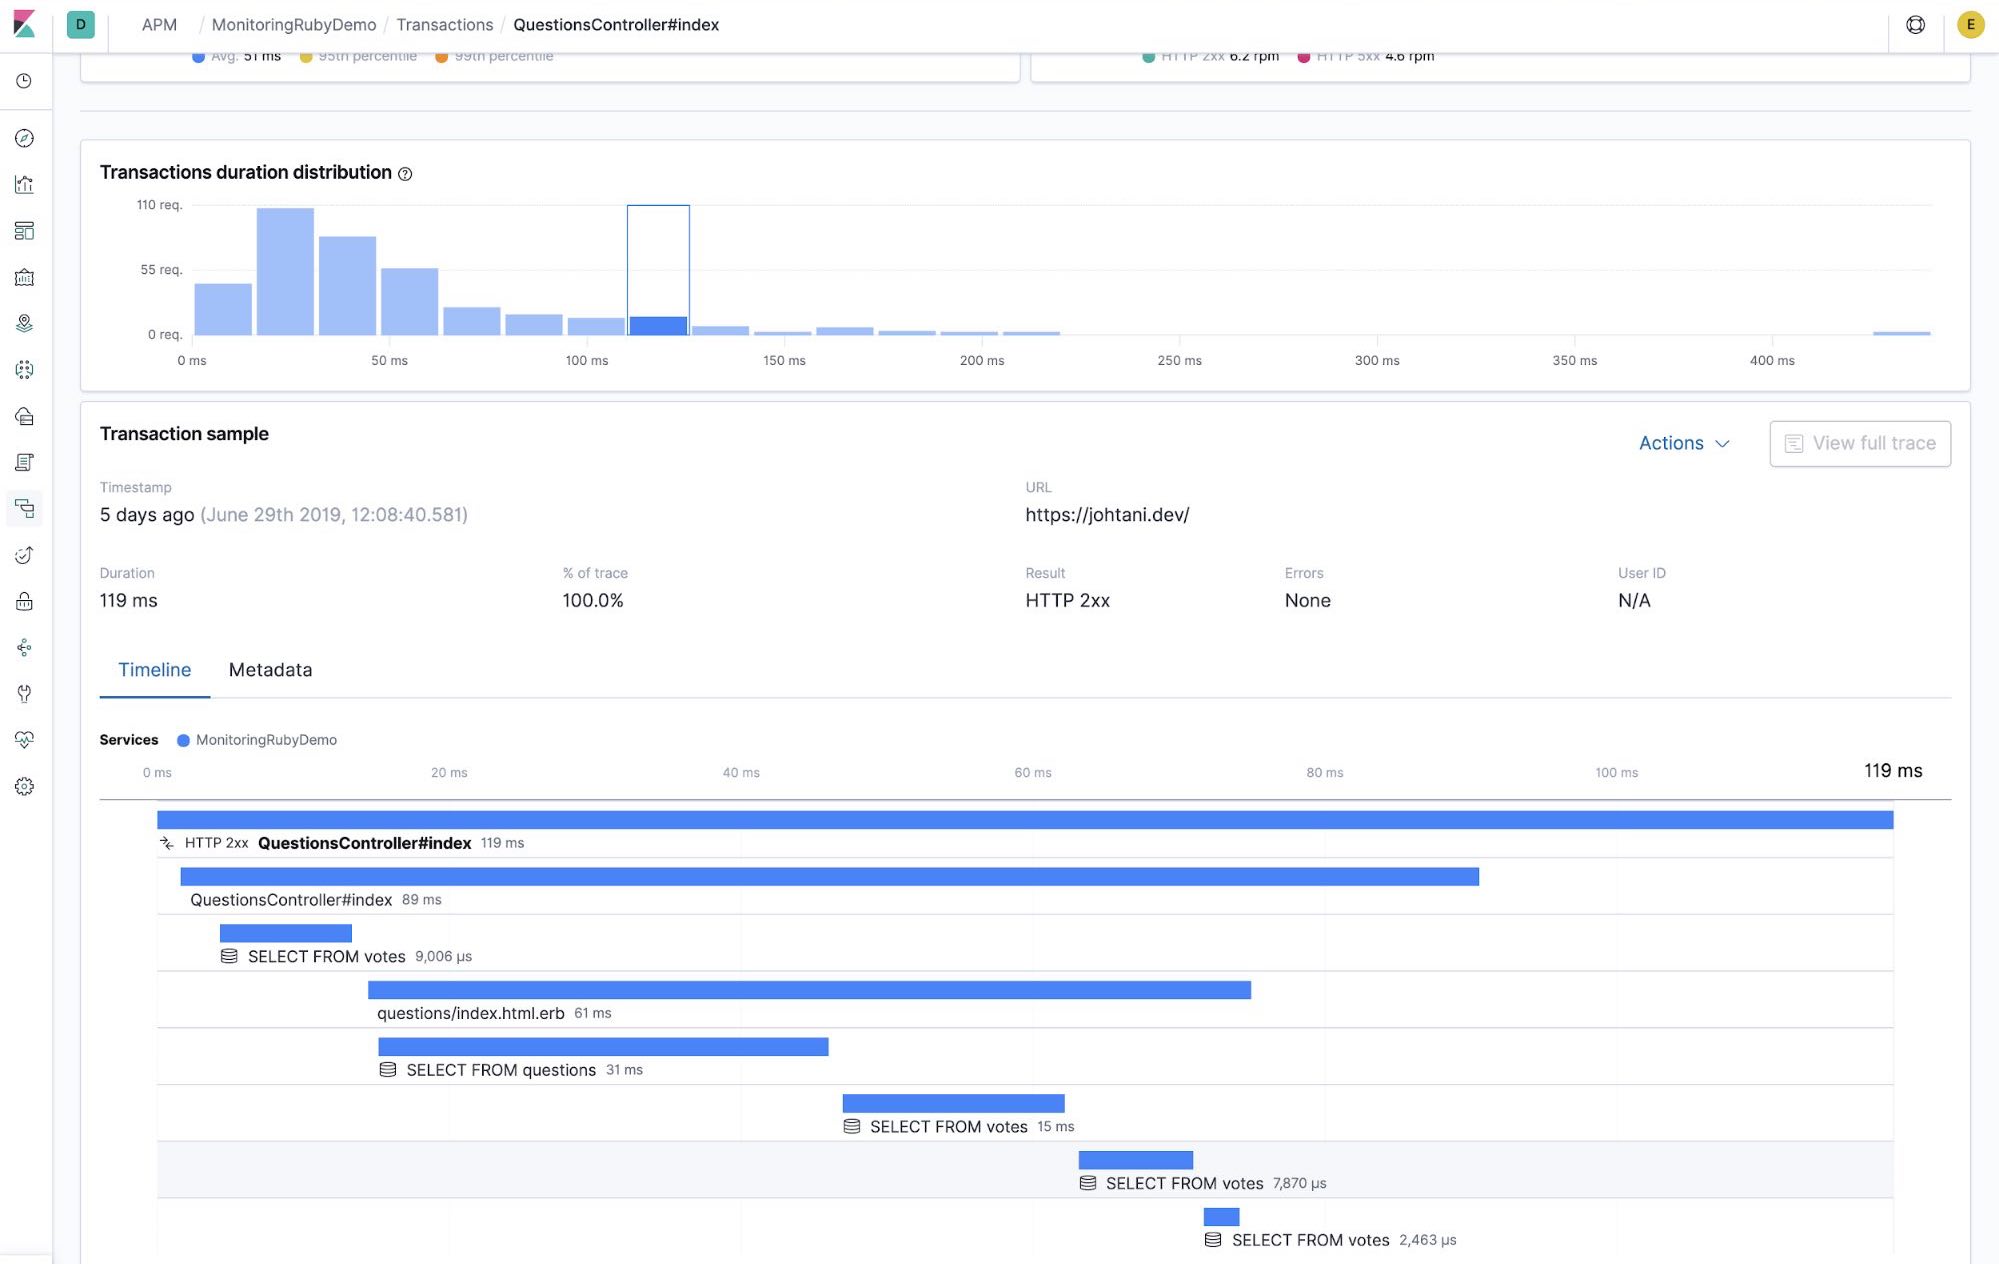
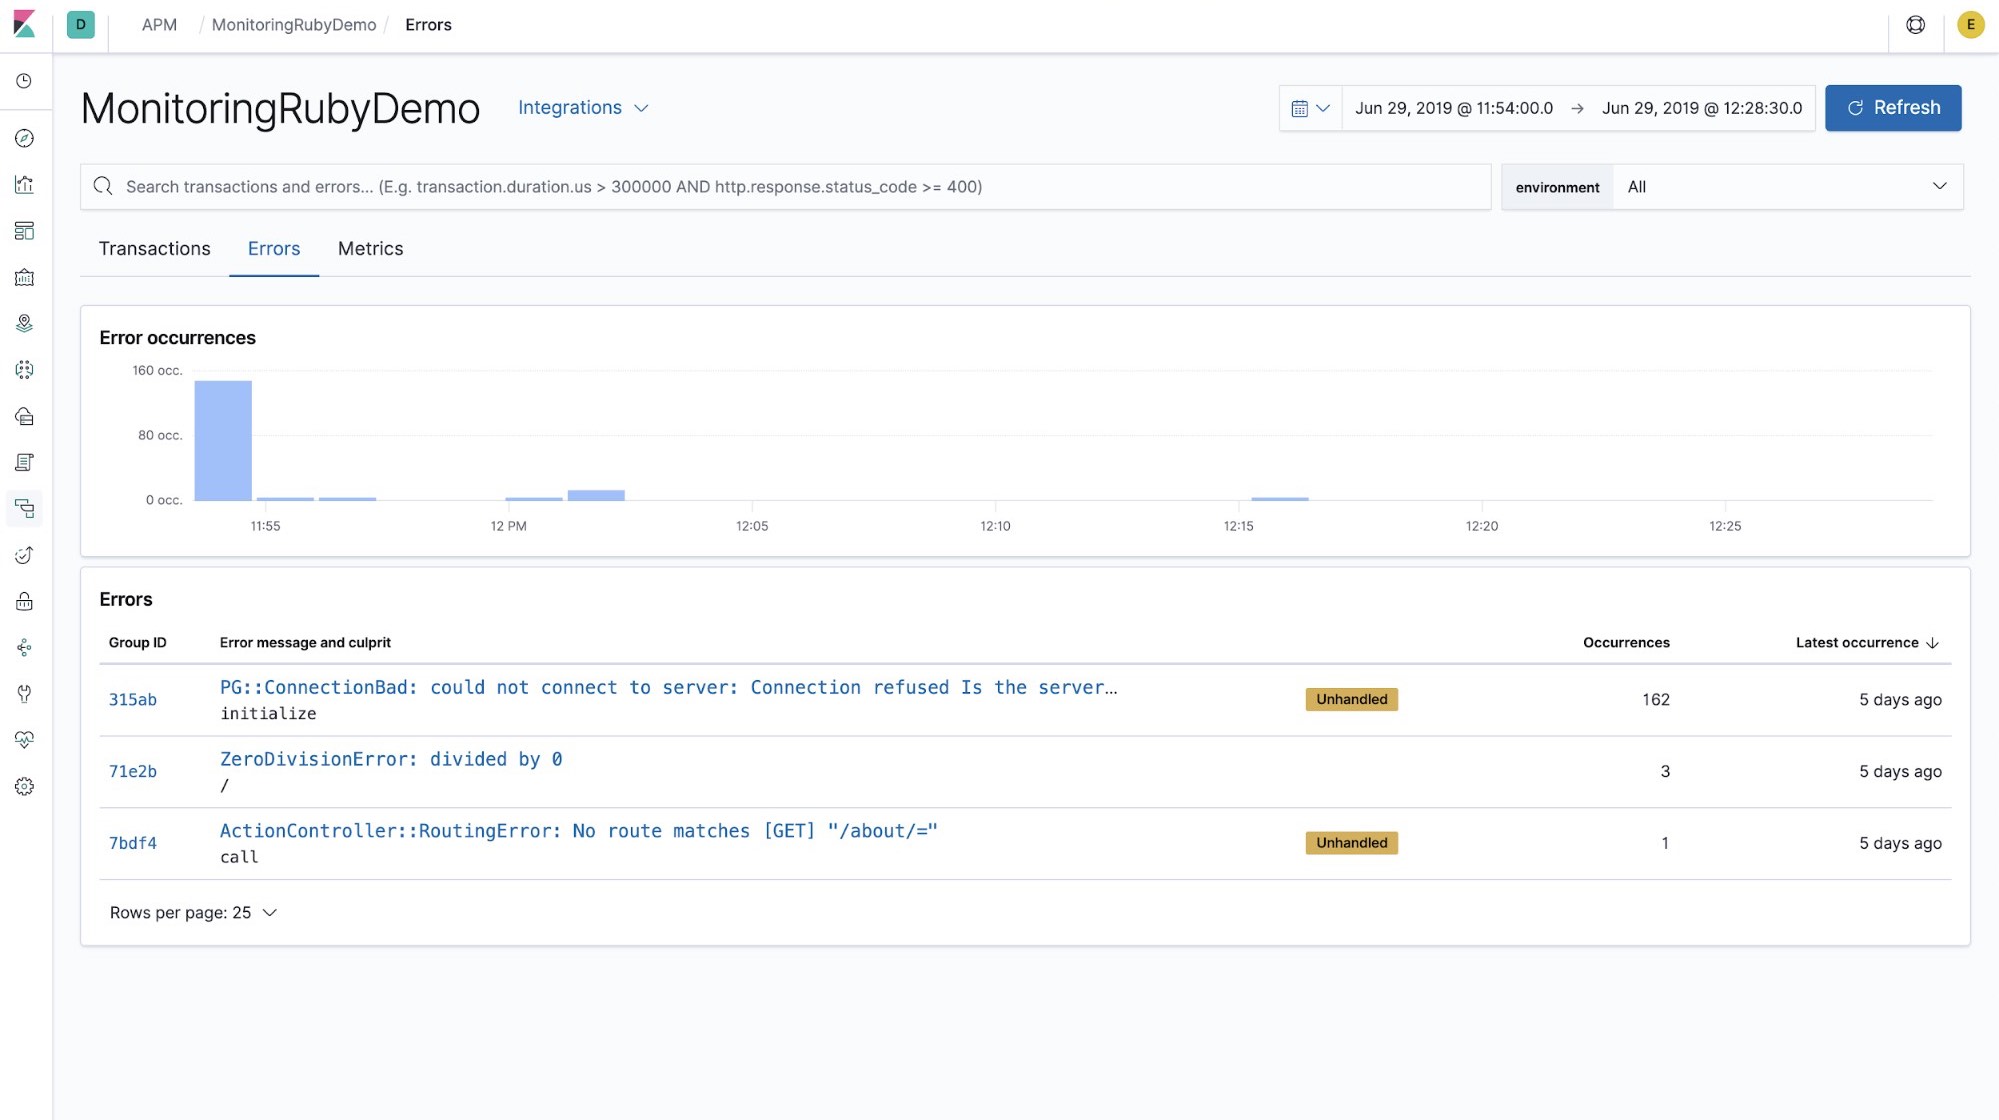
You also get data about errors, so you can use these instead of logs to find problems.
Some developers may want to include not only framework methods but also their own instrumentation. In that case, you can create your own custom instrumentation.
In this way, by observing systems and applications from multiple vantage points, it is possible to solve problems quickly. The new term Observability is being used more frequently to refer to this phenomenon — check out our related blog post on observability with the Elastic Stack. By collecting measurement data in one place with the Elastic Stack, you can easily correlate metrics, logs, and APM data from the same time period. I hope you’ll take advantage of it!
If you’d like to see a demo in person, there are plenty of opportunities at conferences or meetups, so please feel free to let us know!
Or, you can instrument your own applications and visualize your logs, metrics, and uptime data with a free trial of the Elasticsearch Service, or download the default distribution and run locally.