JVM essentials for Elasticsearch: Metrics, memory, and monitoring


 Share on Twitter
Share on Twitter

 Share on LinkedIn
Share on LinkedIn

 Share on Facebook
Share on Facebook

 Share by Email
Share by Email

 Print this page
Print
Elasticsearch is a Java-based search and analytics engine and vector database built on Apache Lucene, and it is the core of the Elasticsearch Platform. To run Elasticsearch on its supported platforms, you need a Java virtual machine (JVM). JVM provides a platform-independent runtime environment, and you can run Elasticsearch in a virtual environment on top of the existing operating system. The JVM abstracts the underlying OS and hardware, so Java applications can run on any platform.
Understanding JVM’s memory management and object reaping via garbage collection (GC) is the key to troubleshooting issues like java.lang.OutOfMemoryError (Exit code 127). These issues occur when JVM runs out of memory or when there’s an Exit code 137, which typically indicates that the host’s out-of-memory (OOM) killer terminated the JVM process due to excessive memory usage. This blog will guide you on how to examine the memory usage patterns and troubleshoot these JVM issues.
I will also explain the role of JVM and how to correlate this with the help of existing Elasticsearch APIs, providing valuable insights into the state of the Elasticsearch JVM and helping you decide if you want to tune it further according to your own use case.
As mentioned in Elasticsearch JVM documentation, the default values of the JVM options that are shipped with the product work efficiently in all of the supported production environments; these default values can handle most use cases for search and indexing operations. Changing any values or adding any custom values for the JVM options or settings is not recommended.
If you think any changes would be beneficial for your workload, please contact Elastic Support before doing so.
What is a JVM?
A Java virtual machine is an integral part of Java Runtime Environment (JRE), which comes bundled under a Java Development Kit (JDK).
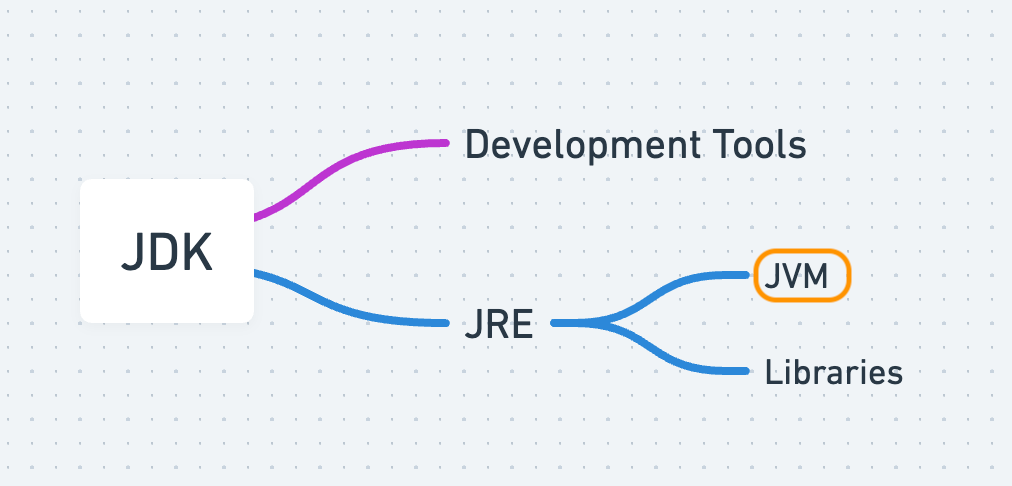
JVM is similar to a computer program that helps run Java applications. It doesn't exist as a physical machine, but it acts like one by translating Java code into instructions that your supported operating system can understand. The JVM also takes care of important tasks like memory management, handling garbage collection, and keeping your applications secure.
Next, let’s focus on JVM memory management and garbage collection — a major point in Elasticsearch that we frequently check when troubleshooting any memory performance or OOM-related issues.
To understand memory management and garbage collection, first you need to understand the logical representation of the heap area (or heap memory) where all of the objects reside when a JVM starts.
Understanding JVM heap memory: Young and old generations
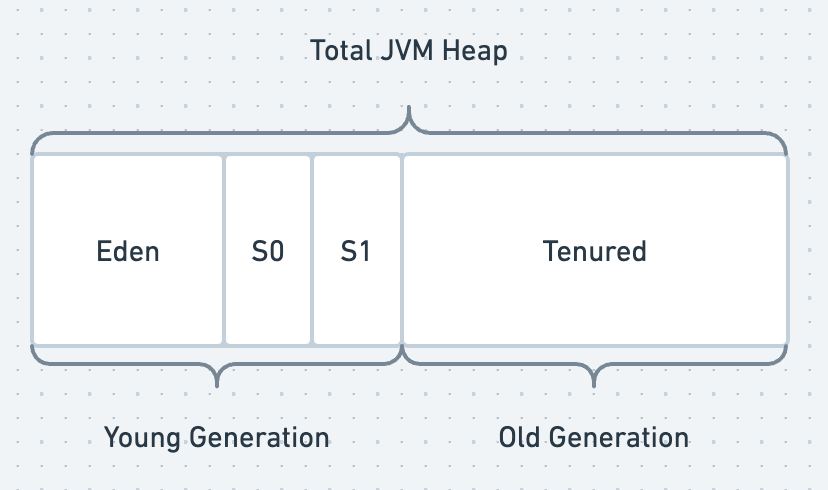
A heap area, or heap memory, is a combination of memory pools where the objects live based on their lifecycle and age. A JVM heap memory mainly consists of a young generation and an old generation. The young generation is further divided into Eden and Survivor regions as illustrated below. The java objects are allocated in these areas based on their age and reference and are then moved from young to old regions.
The majority of heap utilization in the Eden space is quickly reaped. Any heap that isn't released moves to one of the survivor spaces (S0 or S1), where it is typically reclaimed following an exponential decay pattern. If it persists beyond this, it moves to the Tenured space.
Total JVM heap memory = Young generation (Eden and Survivor regions S0 and S1) + Old generation (Tenured)
Young generation area/region
When any Java application starts, it creates new objects and allocates these new objects to the area called heap memory. The young generation’s Eden space is the first place where the application allocates newly created objects. This area is reserved for the allocation of new objects. And when it becomes full, the eligible objects will be either reaped (garbage collected) or promoted to other regions.
When a minor garbage collection happens, the referenced objects will be moved to another subsection which is Survivor region S0. And the unreferenced objects will be deleted to free up the space in Eden. This region contains the objects that survived the garbage collection process, hence the name Survivor region.
The same cycle repeats when the Eden space is full again. This time, the objects that survived both Eden and S0 will be moved to the S1 region, and this process continues.
The objects that survived the garbage collections in Eden, S0, and S1 will be promoted to the old generation based on the age calculator.
Old generation area/region
The old generation (also known as the tenured generation) is a collection of long-lived objects that survived the multiple garbage collection events in the young generation (minor GCs). Objects that have survived a certain number of cycles in the survivor space are moved by the algorithm to the old generation, also known as object promotion.
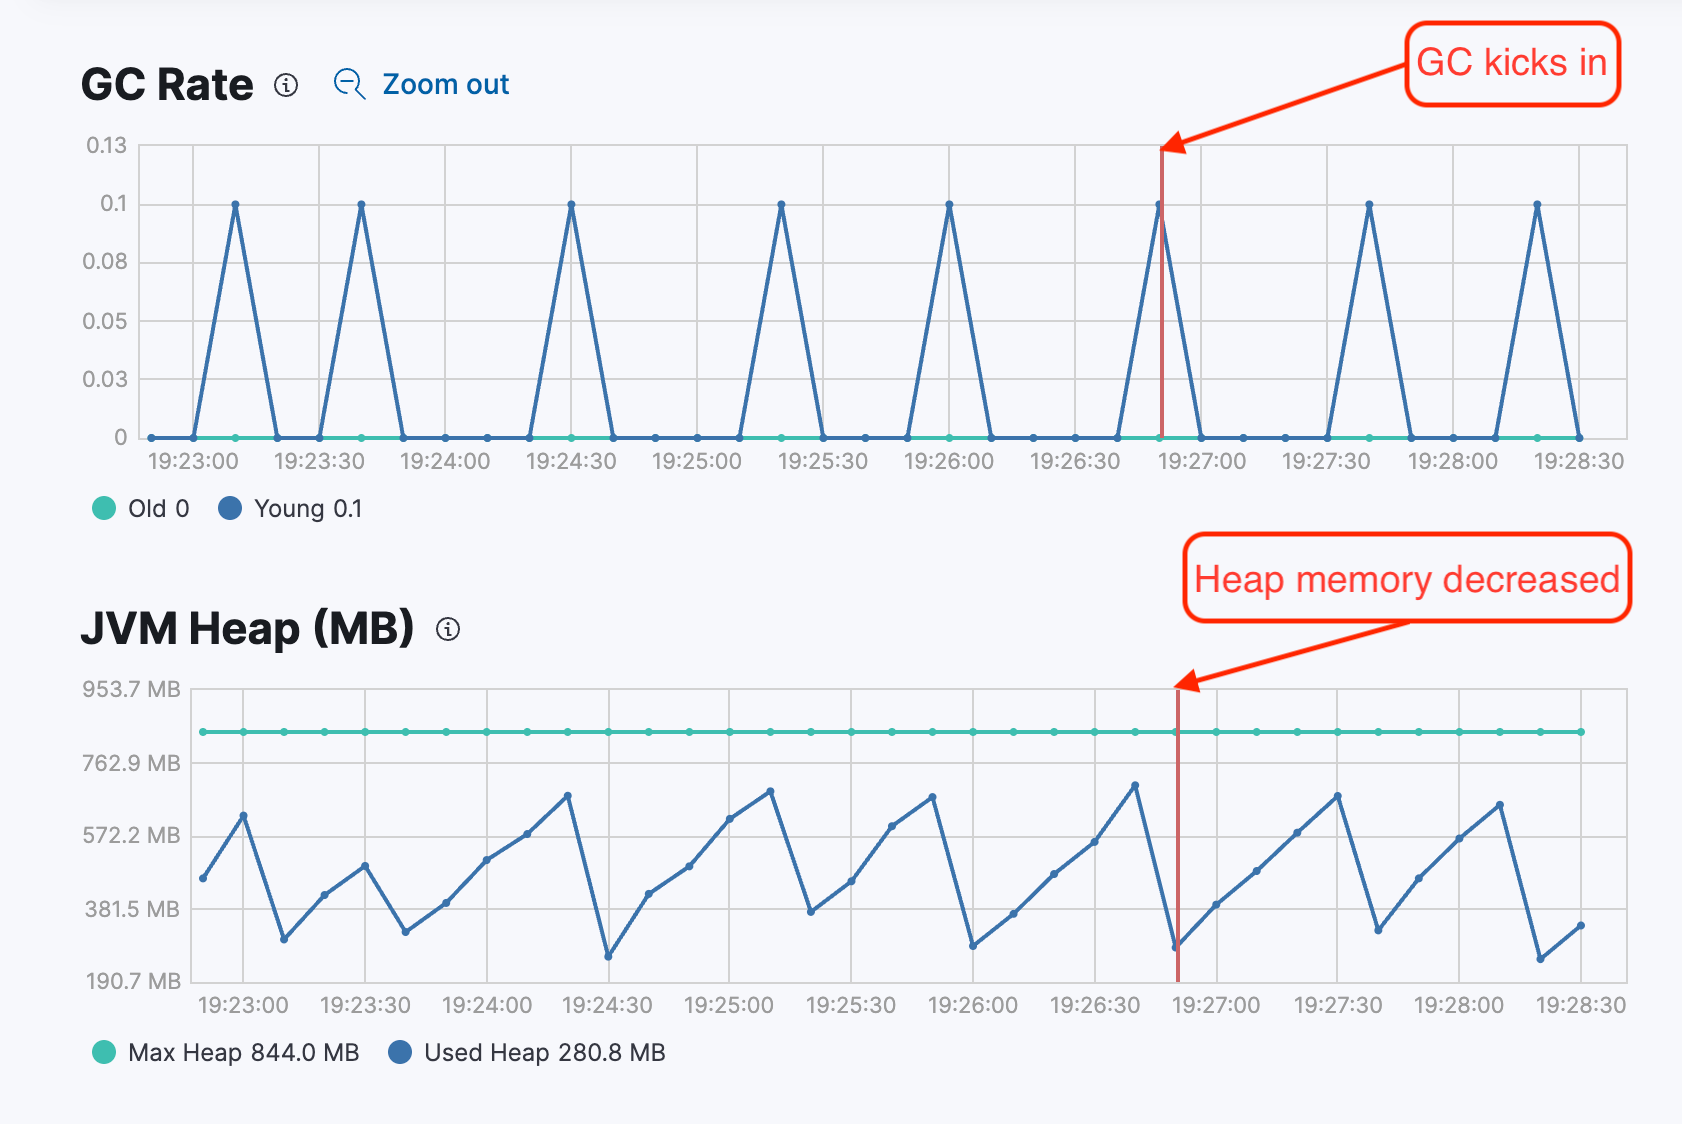
The above saw tooth GC pattern from stack monitoring shows that when minor garbage collection is happening, the JVM heap memory is getting reduced because GC is removing the unwanted objects from the memory. After some cycles, objects accumulate and GC kicks in again to clear the objects.
Garbage collection method
Elasticsearch ships with a supported bundled JDK version, and the details are documented in the release notes. Up until v6.4, Elasticsearch was using the concurrent mark sweep (CMS) garbage collector, which was deprecated in JDK9. Elasticsearch now uses the Garbage-First (G1) garbage collector as the default GC method. It also has better performance when compared with the CMS GC method. The internal mechanism of G1GC is complex and involves many phases, but let’s break down the basics of it.
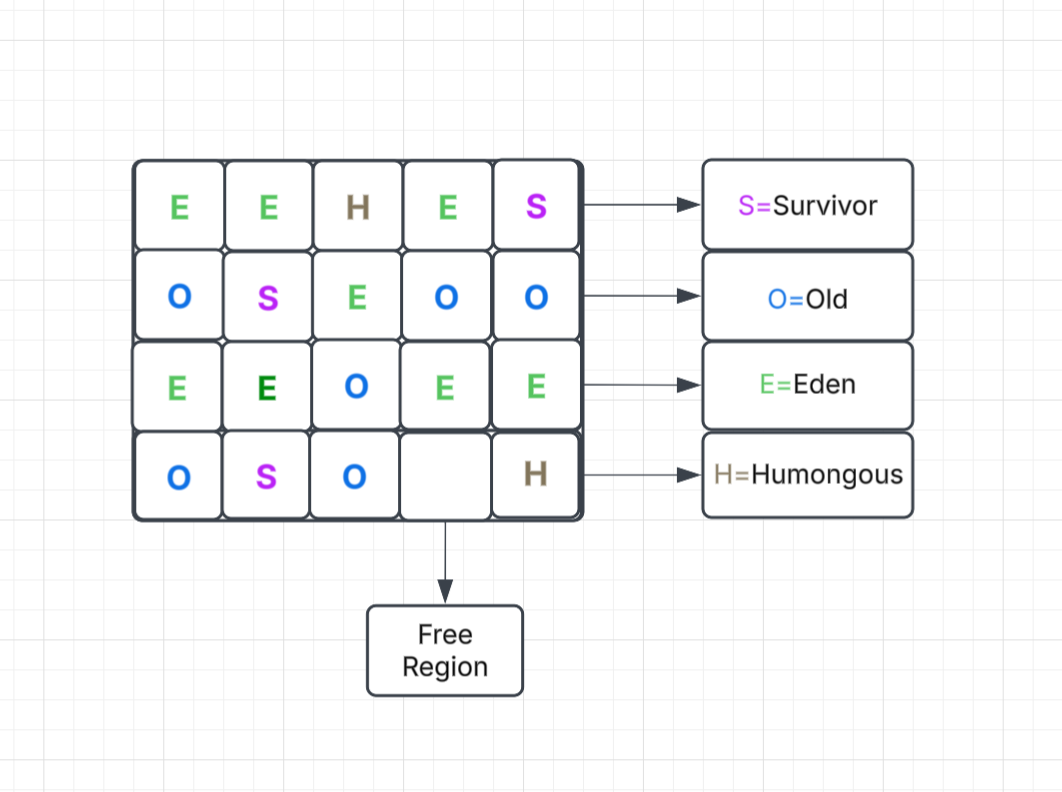
To use G1GC, use the JVM flag -XX:+UseG1GC in the Elasticsearch JVM option. In G1GC, the total heap area will be divided into the equally sized regions -XX:G1HeapRegionSize=1m which can vary from 1MB to 32MB depending on the heap size. The Eden, Survivor, and old generations are logical sets of these regions and are not contiguous. Apart from this, there is a humongous and free/available region inside the heap area. The humongous region is used to allocate objects that are more than half of the region size.
The G1GC has a pause-time target (-XX:MaxGCPauseMillis=200) that it tries to meet during the garbage collection. This means during the garbage collection, it ensures that JVM does not experience a pause more than this value, making it better than CMS or other collectors where this is not an option. Overall, it is recommended to keep the GC settings as default values, which will keep the GC pause within the limits for enhanced performance.
Elasticsearch APIs for JVM state
Any task that Elasticsearch wants to perform is going to need to ask the JVM to allocate some memory in order to execute it. Per above, JVM handles the memory management on behalf of Elasticsearch so that it doesn't have to worry about it. However, admins may be interested in checking on the JVM status via the Elasticsearch APIs in order to ensure things are progressing as expected.
To check all the settings that have been specified or provided as input arguments for the Elasticsearch JVM, use the node info API with the JVM attribute (also described in the documentation).
GET _nodes/_all/jvm This API will provide the details of the node configuration, including JVM input arguments, memory pools, and heap size.
Additionally, if you want to check the metrics of the Elasticsearch JVM for a particular node’s uptime, heap used in all the memory pools, or statistics about the garbage collection, you can use the node statistics API. It will provide detailed metrics about each of the mentioned metrics.
GET _nodes/stats/jvm
or
GET _nodes/stats/jvm?filter_path=nodes.*.jvmNote: Elasticsearch does not recommend making decisions based on heap_percent value obtained from nodes stats API. Our UI does calculate the memory pressure, and the user should take necessary action based on the calculation described in this blog.
Checking JVM metrics using built-in JDK tool
If you are an advanced user and want to check real-time stats about a running JVM without using Elasticsearch APIs, then you can use the bundled java and run jstat to check the live statistics. To do this, first find the Java home directory or bin directory and the PID of the Elasticsearch process. From the bin directory, use the jstat tool:
./jstat -gcutil <PID> 2000Here, 2000 is the interval in milliseconds after which the stats will be fetched and printed on the CLI. This command is helpful to identify how frequently GC is happening in all the areas and how fast memory pools are getting filled by the objects (object creation and promotion rates).
This is not an alternative to the APIs mentioned above, but it is more for developer-level debugging.
That’s a wrap!
In this blog, we covered the basic concepts of Java virtual machines, various memory pools, the importance of garbage collection, and how to check Elasticsearch JVM statistics. In the next blog, we will discuss the important JVM settings and how to poll its current metrics inside Elasticsearch.
If you have any questions or would like further support, please don’t hesitate to reach out to us. We're always here and happy to help!
The release and timing of any features or functionality described in this post remain at Elastic's sole discretion. Any features or functionality not currently available may not be delivered on time or at all.
Share
- Share on Twitter
Share on Twitter
- Share on LinkedIn
Share on LinkedIn
- Share on Facebook
Share on Facebook
- Share by Email
Share by Email
- Print this page
Print