Using AIOps effectively with Elastic Observability


 Share on Twitter
Share on Twitter

 Share on LinkedIn
Share on LinkedIn

 Share on Facebook
Share on Facebook

 Share by Email
Share by Email

 Print this page
Print
Over the past several years, one topic that has become of increasing importance for DevOps and site reliability engineering (SRE) teams is AIOps. Artificial intelligence for IT Operations (AIOps) is the application of artificial intelligence (AI), machine learning (ML), and analytics to improve the day-to-day operational work for IT operations teams. With the move toward distributed applications along with the adoption of cloud-native technologies, teams have been dealing with three major changes in the application environments they observe and manage.
First, the increasing complexity of applications with workloads and services that are connected across on-premises and cloud along with ephemeral components (Kubernetes) means that traditional IT monitoring tools are too limited. More modern observability solutions are needed — specifically, a unified full stack observability platform that consolidates all of your telemetry data for both real-time monitoring and historical analysis.
Second, the volume of performance data (telemetry data including metrics, logs, traces, and events) being generated has increased substantially. Cloud-native technologies like microservices, serverless, and Kubernetes are regularly spinning up thousands of services, components, and functions, which need to be monitored for performance.
Third, the increasing pace of change across software development lifecycles is impacting applications and the infrastructure dynamically. The days of one or two major software releases per year is no longer the case and a huge challenge from an application performance perspective. More frequent, incremental releases are oftentimes the origins of performance issues as new code is being pushed into production regularly.
All in all, the amount of data generated and used to monitor cloud applications and infrastructure and observe its performance has increased dramatically on a day-to-day basis. The reality is that in today’s modern application world, potential performance issues and application errors have become much harder for operations teams and SREs to diagnose and determine root cause.
So how can operations teams manage and monitor this avalanche of telemetry data and metrics? AIOps, when applied to observability, is about improving real-time monitoring, anomaly detection, alert correlation, and root cause analysis when monitoring application performance. While exact definitions and AIOps terminology may vary a bit across industry experts and by technology vendors, the overarching operational goals are to reduce the time and effort to detect, understand, investigate, determine root cause, and remediate issues and incidents faster. AIOps and machine learning are needed to free up IT operations (ITOps), SRE, and DevOps teams to take on higher-value initiatives.
The impact and benefits to the business through implementing AIOps is all about reducing MTTD and MTTR (mean time to detection and mean time to resolution) resulting in less service downtime, improved SLAs, and better customer experiences. It also allows an organization to manage the ever-increasing IT complexity and the overall pace of change seen today. For many teams and businesses, AIOps is becoming more and more a necessity, versus a nice to have.
Elastic Observability and AIOps in action
Let’s take a look at how AIOps and machine learning can be implemented in real-life scenarios. To start, AI and ML (a subset of AI technologies) need observability data to work with. The more comprehensive and rich the data that’s available to analyze, the more that can be done through the application of AI and ML technologies.
A comprehensive, full-stack observability platform like Elastic Observability is a great foundation given its ability to ingest all your data across metrics, logs, and traces, in a single platform. Elastic Observability utilizes domain-specific machine learning and anomaly detection to reduce labor-intensive troubleshooting. Let’s take a look at three specific use cases where the out-of-the-box AI and ML in Elastic Observability can help.
For the examples and videos in this blog post, we will be using the OpenTelemetry demo. OpenTelemetry's demo application contains a set of 20 microservices that work together to process user interactions. These microservices are responsible for various tasks such as authentication, order processing, inventory management, and more.
In the demo, the observability backend used is our Elastic APM Server, which provides out-of-the-box support for OpenTelemetry. This means that users can easily visualize the data generated by the demo (including metrics, traces, and logs) using the Elastic APM user interface, without having to set up any additional configurations. The OpenTelemetry demo is a great way to get started with the OpenTelemetry project and see how it can be used to collect and analyze observability data in a real-world scenario.
Monitoring and noise reduction with Elastic Observability and AIOps
Monitoring and noise reduction are critical in the context of SRE because they help ensure that systems are reliable, available, and performing optimally.
However, monitoring can also generate a lot of noise and false alerts, especially in complex and dynamic systems. This noise can lead to alert fatigue and make it harder for SRE teams to identify and respond to real issues. Therefore, it is essential to reduce noise by filtering out irrelevant or redundant alerts and focusing on the most critical issues that require immediate attention.
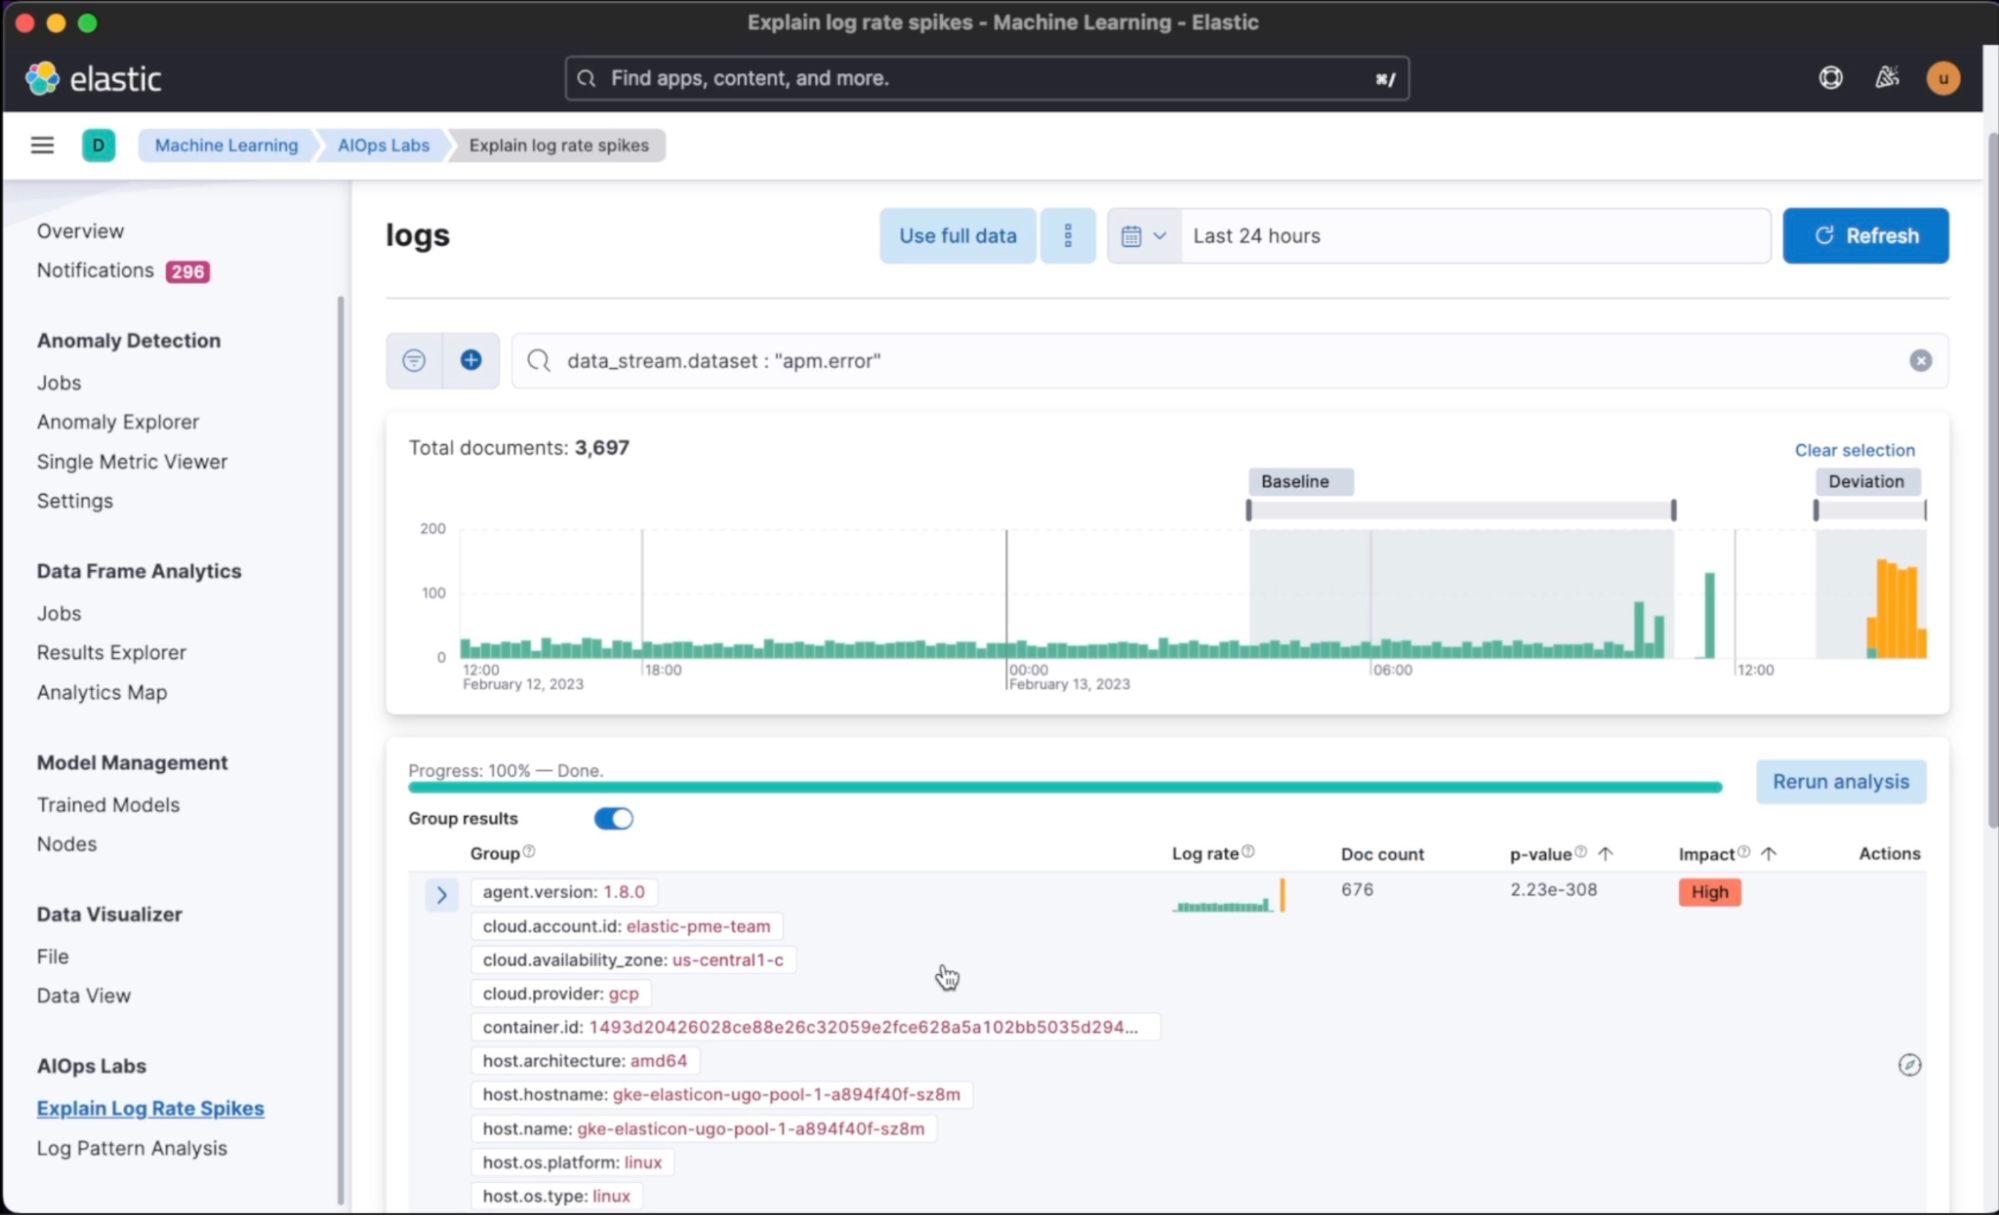
In this video, AIOps Essentials: How to reduce noise in ingested telemetry on Elastic, we see how Elastic can help reduce noise and make monitoring more effective. SREs often have to sift through a large volume of data to identify and resolve issues. Elastic offers various features, such as filtering, grouping, and aggregation, that can help SREs efficiently handle data and identify relevant patterns. Elastic can also help reduce noise by eliminating logs or events that are not relevant, helping SREs to focus only on important issues.
Elastic machine learning offers a feature called Log Rate Spikes that can detect log spikes in real time. When logs spike unexpectedly, it can indicate an issue or anomaly in your system. With Log Rate Spikes, Elastic's machine learning algorithm detects when the log rate significantly deviates from the expected value based on historical log data.
Anomaly and issue detection with Elastic Observability and AIOps
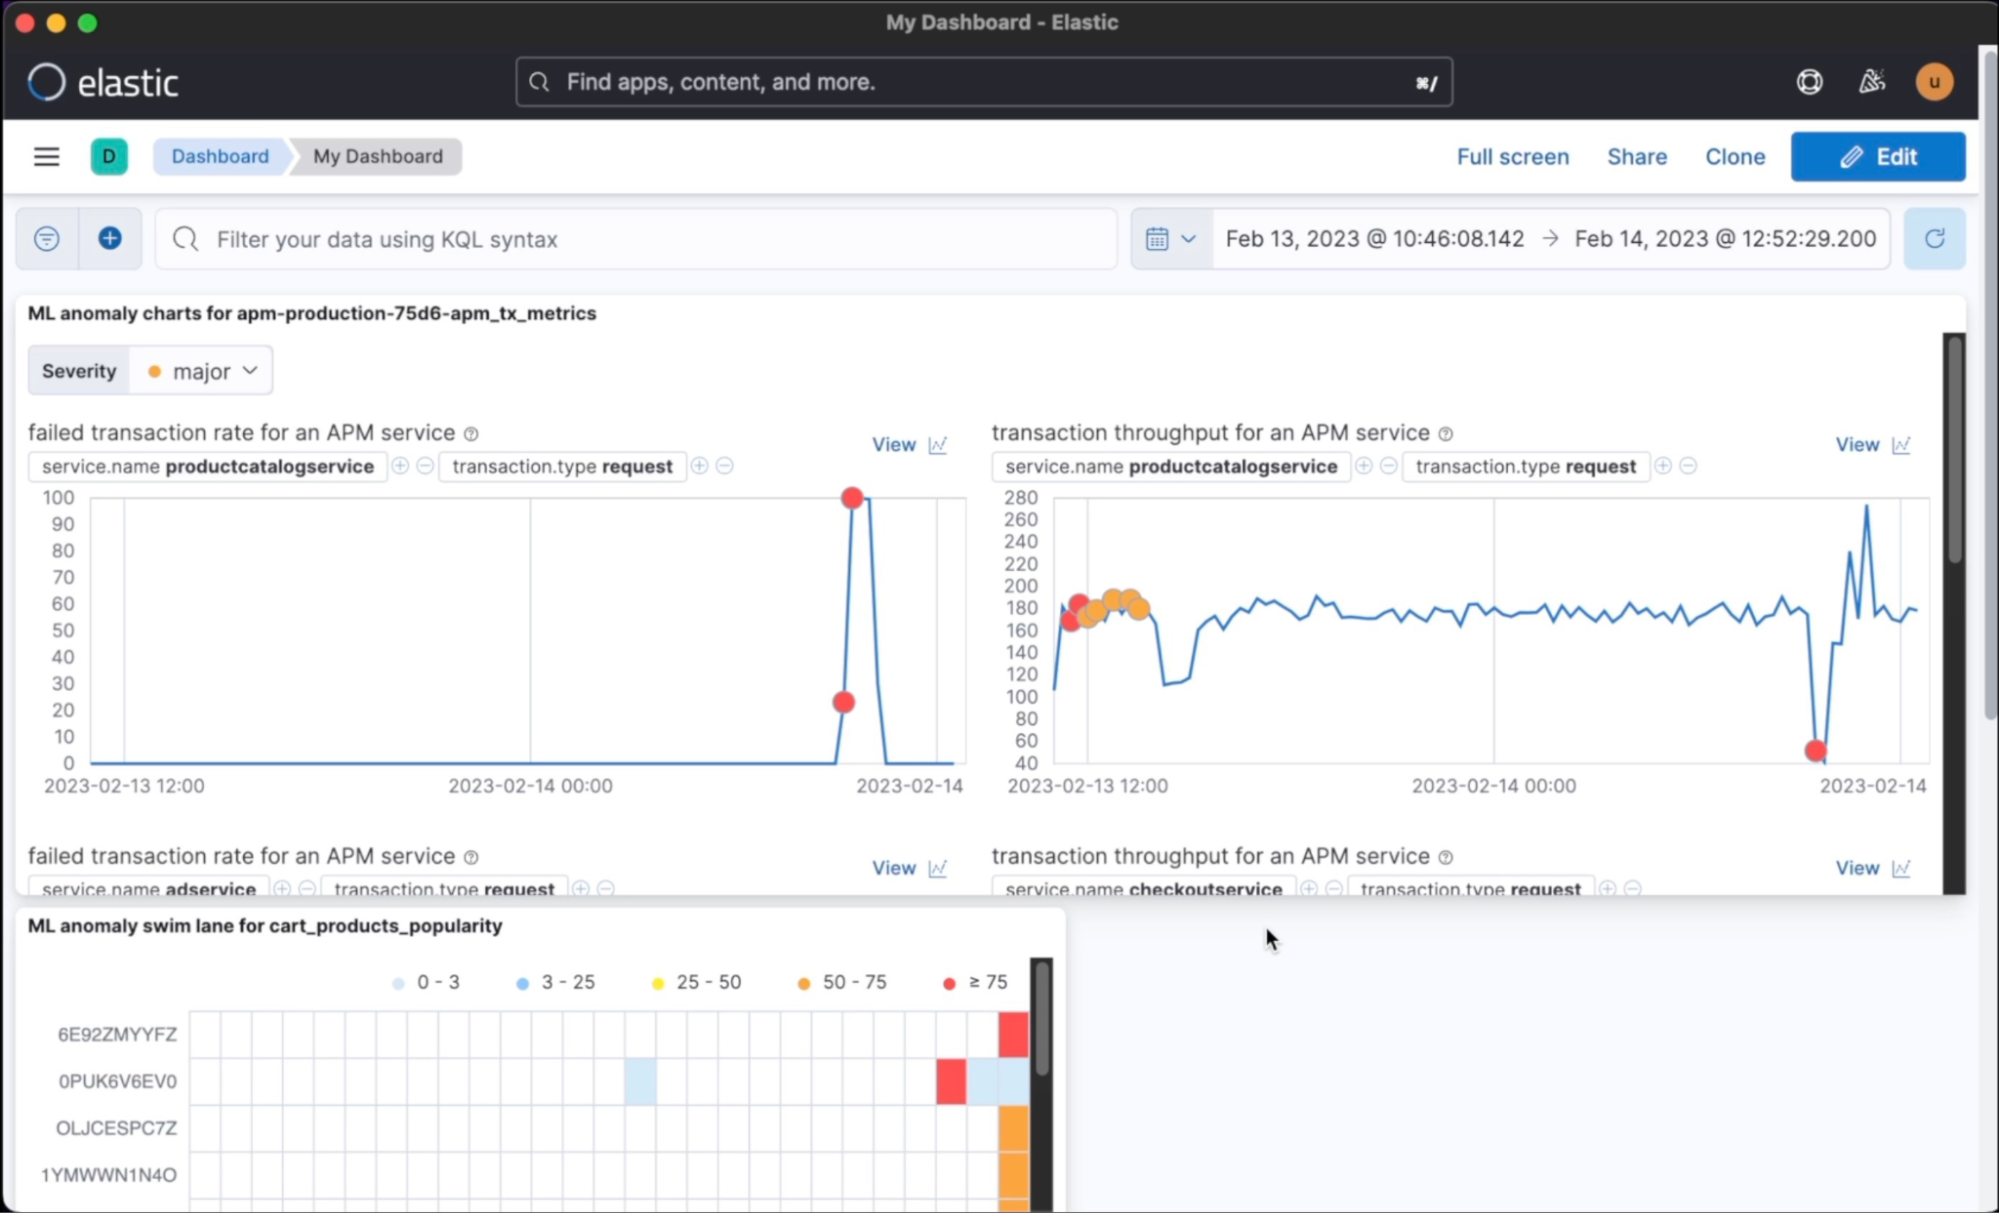
Anomaly detection in Elastic Observability can also be used to extract valuable business metrics from raw logs and detect when those metrics deviate from their normal threshold. For example, you can monitor the rate of processed payments or the average quantity of a certain product in users' carts. By setting up appropriate threshold levels, Elastic can automatically alert you when there's a deviation from the expected behavior, helping you proactively identify and resolve issues before they impact your business. This not only helps you maintain a high level of user satisfaction but also saves you valuable time and resources by enabling you to quickly diagnose and resolve issues.
One of the benefits of Elastic is its resource-based pricing model, which means that you can create as many custom metrics as you want as long as they fit within your cluster size. This allows you to monitor and analyze a wide range of metrics, such as the rate of processed payments or the average quantity of a certain product in users' carts, without incurring additional charges.
The second video, AIOps Essentials: Issue Detection Using Anomaly Detection on Top of APM, demonstrates how Elastic can help detect anomalies and issues by analyzing logs and deriving business metrics.
Root cause analysis with Elastic Observability and AIOps
Elastic offers various features such as search, visualization, and machine learning capabilities to help identify the root cause of an issue. With Elastic Observability, SREs can drill down into the data to get a granular view of what happened and why, helping them make informed decisions and take corrective action quickly.
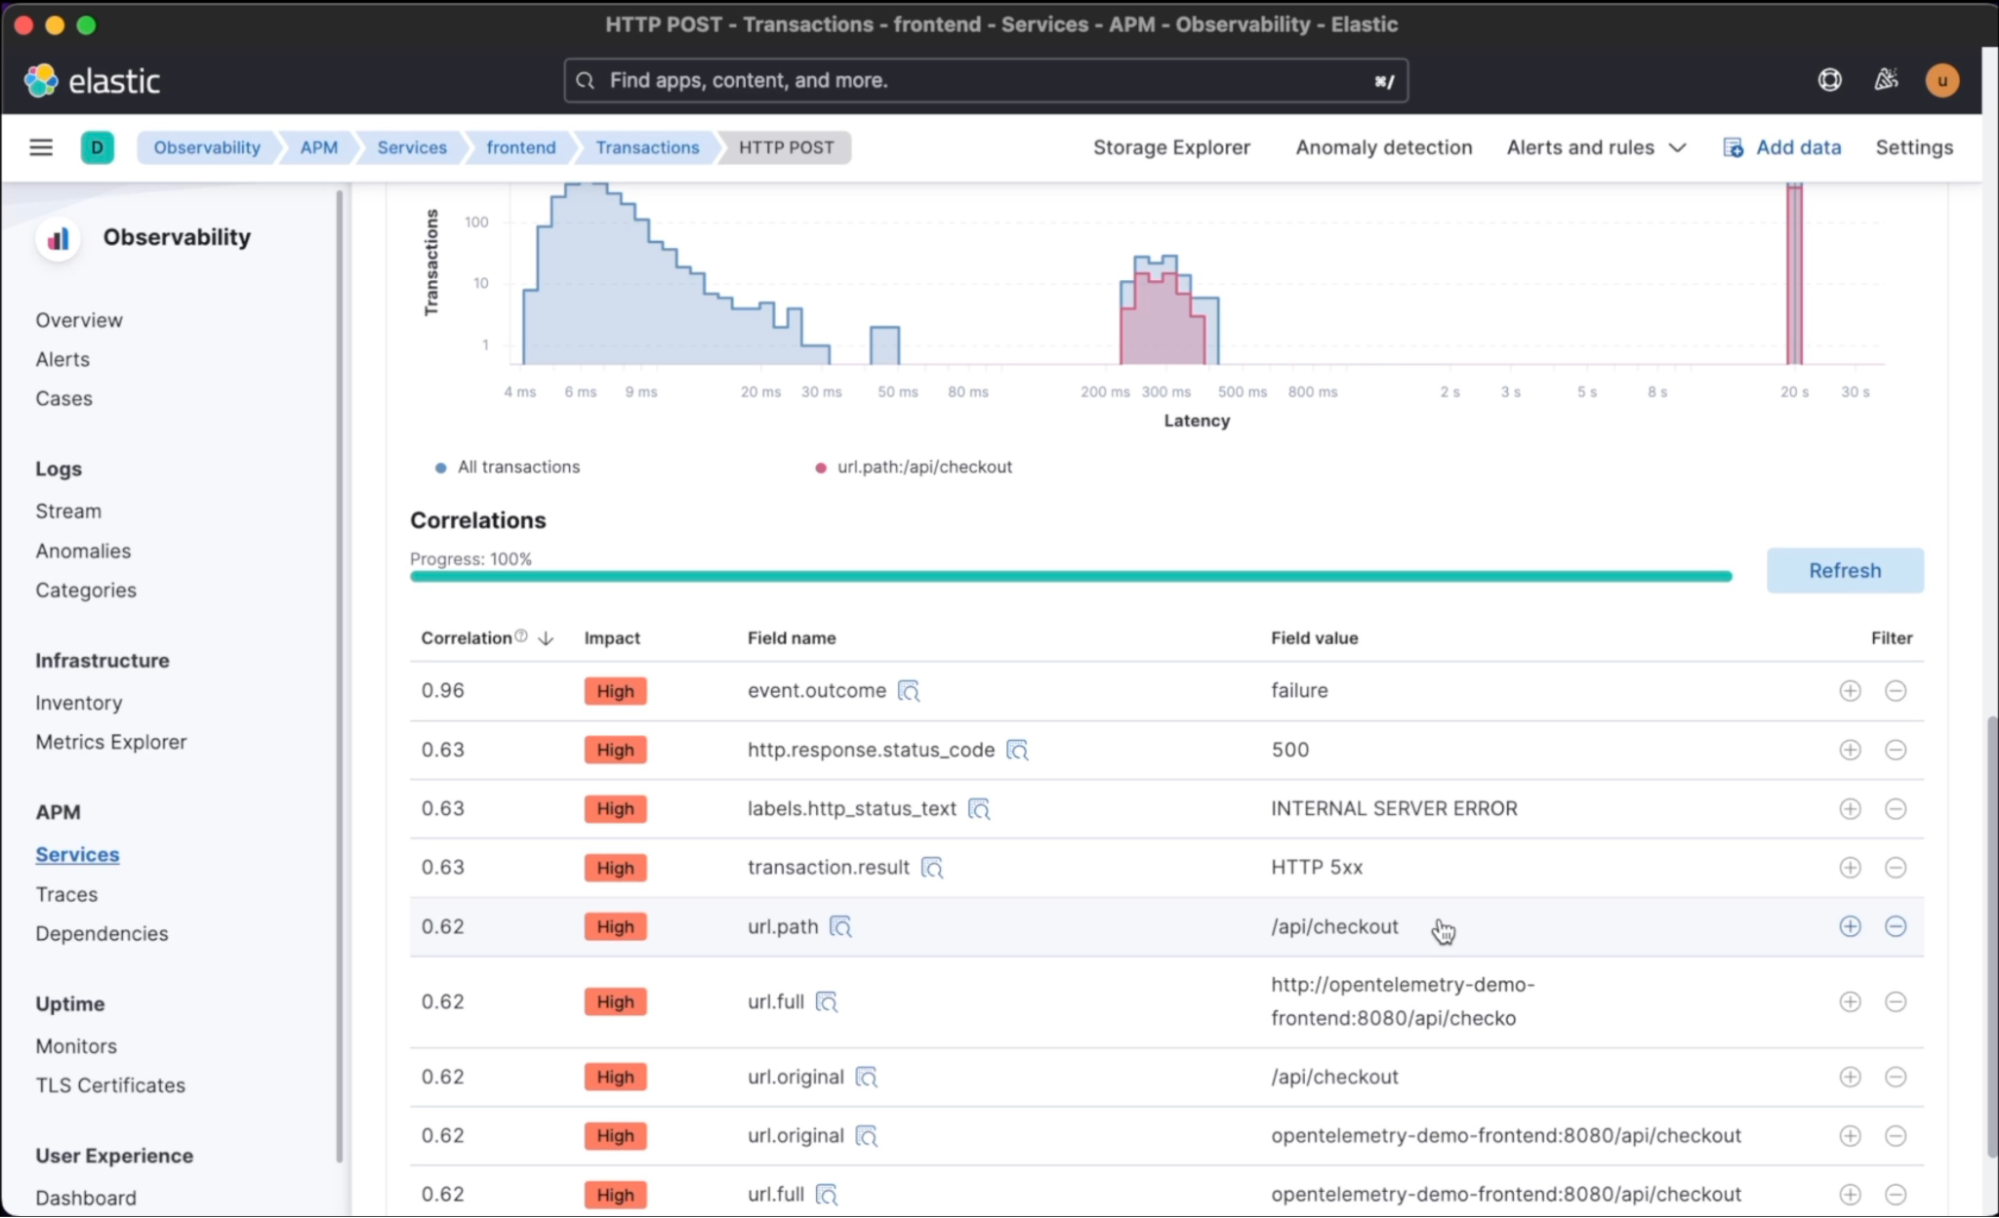
In this third video, AIOps Essentials: How to Use Distributed Tracing for Root Cause Analysis, we demonstrate how Elastic makes it easy to not only make sense of error messages but also identify which transactions have failed and correlate the slowest or failed ones with the most probable culprit. For example, you can quickly identify a new version or a URL of a specific product or service that may be causing issues. This feature helps you pinpoint the root cause of issues and take action to resolve them quickly. Elastic's powerful correlation and visualization tools allow you to drill down into the data and get insights that are critical for keeping your business running smoothly.
The future of AIOps in observability
While AIOps has proven its value in the core observability functions around monitoring, noise reduction, anomaly detection, and root cause analysis, we’ve only scratched the surface of its capabilities.
As data volumes continue to grow, the use of AI-assisted analytics during data collection will become more prevalent. This will help identify the most significant data to collect and analyze. By running AI and ML algorithms at the collection edge, data can be summarized at or near the point of collection, which reduces the need to centralize all analytics and distributes AI intelligence across the infrastructure. Dynamic classification and categorization schemes will automatically determine if incoming data should be stored in warm or cold tiers, optimizing TCO.
AIOps and analytics will independently act on multiple signals and data, detecting anomalous behavior, and then rapidly isolate the root cause. And remediation automation will become autonomous for more use cases and scenarios as customer trust starts to rise in auto remediation. Observability systems will start to form more closed loops, collecting, storing, and analyzing data and detecting and remediating more incidents automatically with increasingly less human intervention — or at least we can certainly hope that AIOps will be able to help!
And as organizations increasingly embrace AIOps and machine learning, they will realize the potential of using them as a competitive advantage. AIOps has already proven its worth beyond its initial hype cycle, providing numerous productive use cases that can truly benefit an organization and teams. It is time for organizations to make the most of this cutting-edge technology and take advantage of the benefits it can bring.
Choosing the right observability platform is crucial in preparing for the future of AIOps-driven observability and remediation that is just around the corner. With the right platform, organizations can stay ahead of the curve and leverage AIOps to optimize their operations, gain valuable insights, and make data-driven decisions that drive growth and success. So don't wait — embrace the power of AIOps today and transform the way you do business.
Share
- Share on Twitter
Share on Twitter
- Share on LinkedIn
Share on LinkedIn
- Share on Facebook
Share on Facebook
- Share by Email
Share by Email
- Print this page
Print