Observe, protect, and search your data with a single solution. From application monitoring to threat detection, Kibana is your versatile platform for critical use cases. Start your free 14-day trial now.
We’re excited to share that variable controls are now available in Kibana dashboards starting from version 8.18 and all the 9.x series! This feature has been one of the most consistently requested additions from dashboard users—and it’s finally here 🎉 Over the past few months, we’ve continued expanding and refining variable controls, making it the perfect moment to give them their own dedicated blog post.
What are variable controls?
If you’ve worked with Kibana dashboards before, you probably know our classic dashboard controls—those handy dropdowns that show values from your data so you can filter things with a couple of clicks.
Variable controls look similar on the surface, but they come with a clever twist: instead of automatically filtering every panel on your dashboard, they can be plugged directly into ES|QL queries inside individual visualizations.
That means you get to decide where each control applies. Even better, you can use them for all sorts of creative tricks—like tweaking time intervals, switching breakdown fields, or changing visualization parameters on the fly. Basically, they give your dashboards a truly interactive experience, allowing you to get your insights faster and more easily.
Use cases for variable controls
Alright, variable controls sound useful —but what can you actually do with them? Here are some examples of how they level up your dashboards:
Filter selected visualizations
Want to filter some visualizations, but leave others untouched? Variable controls let you do exactly that. Pick the panels you want to respond to and wire them up in the ES|QL queries behind your visualizations.

Select different time intervals
Give your users the power to switch between “5 minutes”, “1 hour”, “1 day”, or whatever time buckets make sense. Build a variable control with predefined intervals and connect it to your time series query.

Change functions
Instead of creating multiple charts for each operation, let dashboard users choose if they want to see max, avg, different percentiles, or any other aggregator.

Group by different fields
Sometimes you need to break down the data by different dimensions during an investigation. With variable controls, you can define multiple “group by” fields and let dashboard users pick the one that helps them uncover their insights.

How can you create them?
The easiest (and probably most delightful) way to create a variable control is directly from the ES|QL query editor in your visualization. Just start typing your query, use the autocomplete menu, and Kibana will helpfully scaffold the control for you.
But if you prefer to start from the variable itself, you can also go to: Add panel → Controls → Variable control and add the variable to your visualizations after creating the control.
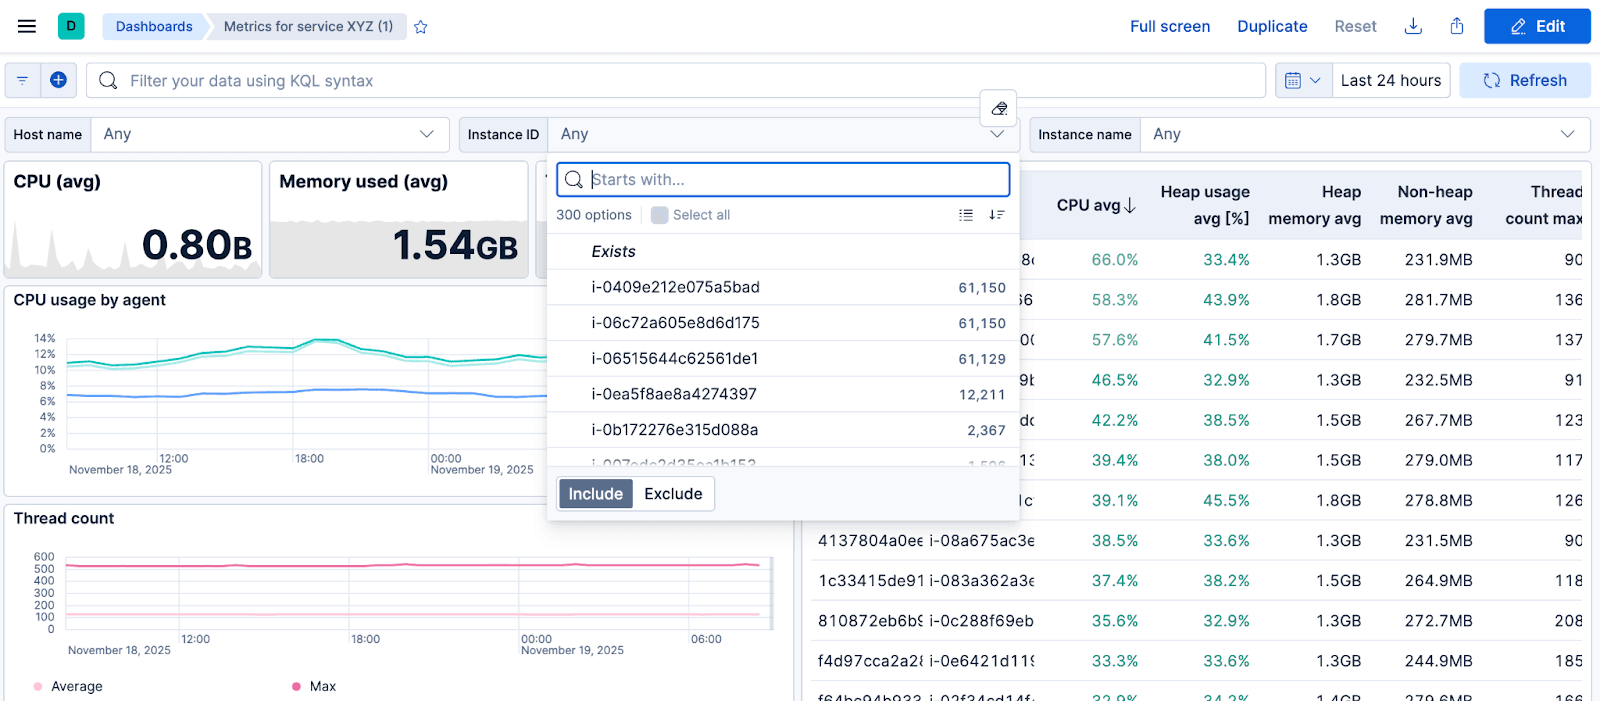
Example 1: Filtering control with multi-value selection
1. Pick a visualization that is powered by a ES|QL query and click “Create control” within the WHERE clause
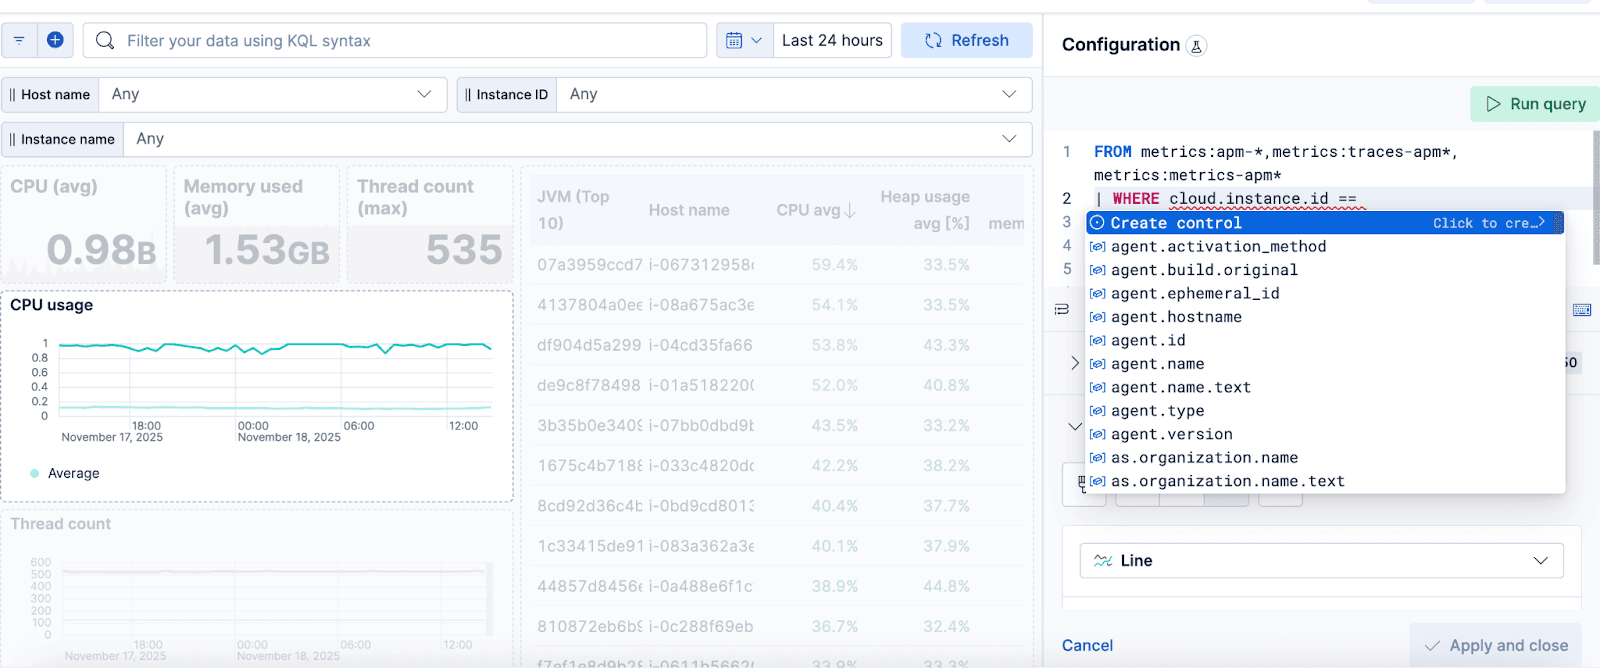
2. You will automatically get redirected to the variable creation flyout, where the “Values from a query” type will be selected for you, and the name of the variable is already pre-populated. Remember that the name of a control always needs to start with “?...” to work in the visualization query.
You will usually need a query like this one to get the values from a field and update them according to the time range selected in the dashboard:

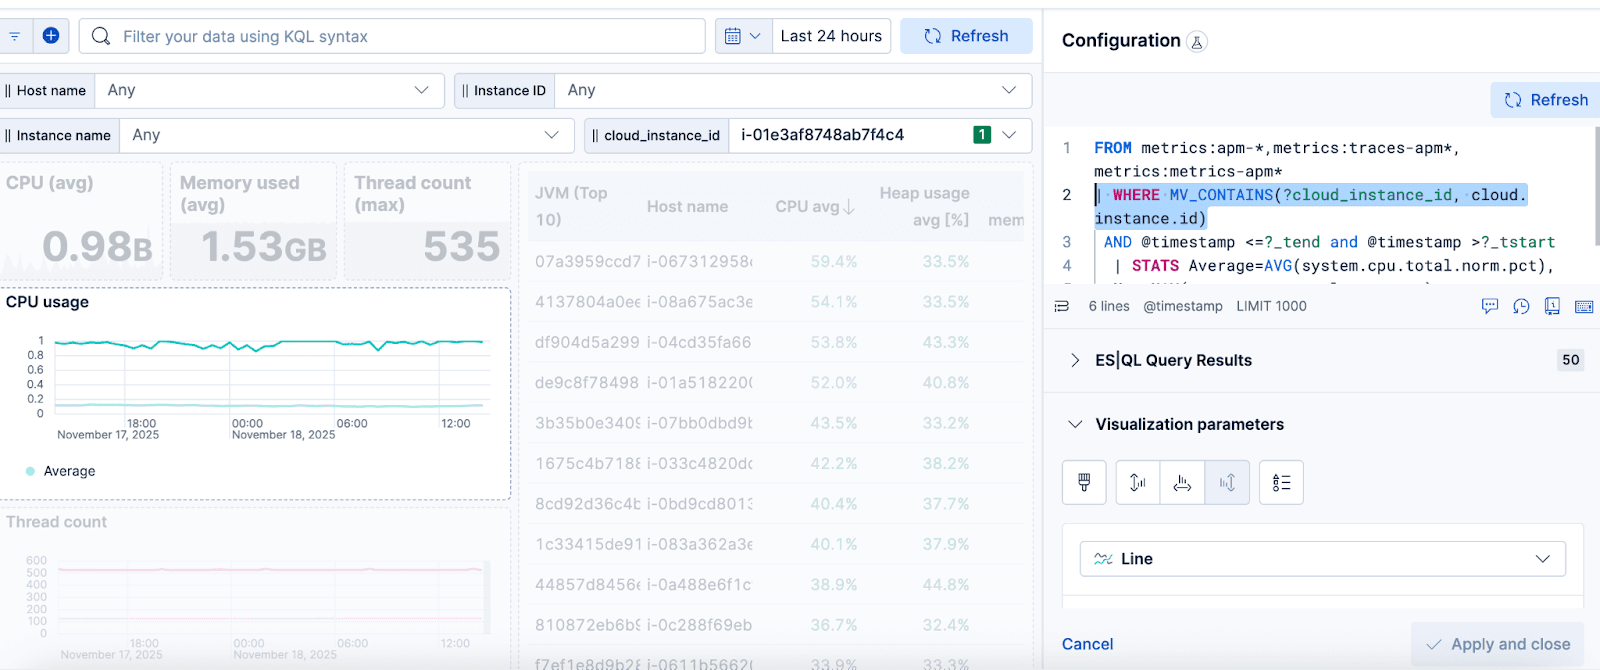
3. When saving the control, you will see it appearing at the top of the dashboard, and your visualization query will be updated with the variable control name.

4. If you want to add multi-value selection to the control, you need to use the MV_CONTAINS function in the query and select “Allow multiple selections” during the control creation in step 2 (available from 9.3).
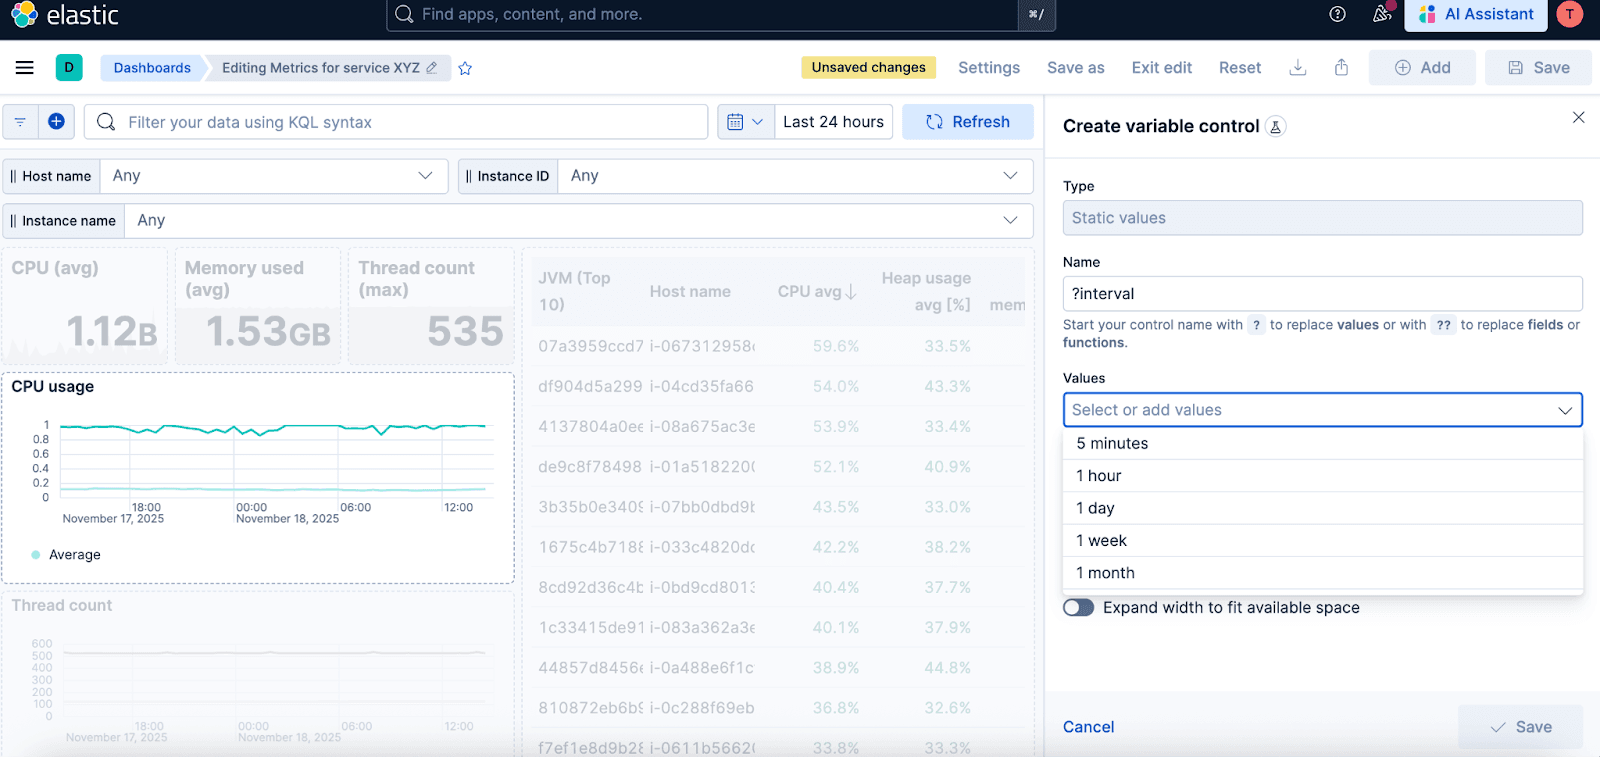
Example 2: Time interval control
If you’re building a time series, you can easily add a variable control for your date histogram interval:
1. When writing an ES|QL query for your time series, click “Create control”. When building a variable for intervals, it’s better to use TBUCKET instead of BUCKET so it accepts more readable intervals like “1 hour”, “1 day”, etc. There will also be an auto option for TBUCKET soon so it can automatically adapt to time ranges.

2. Define the intervals to populate the options in the dropdown menu.
3. Select different intervals in the dropdown menu and see how your visualization changes.

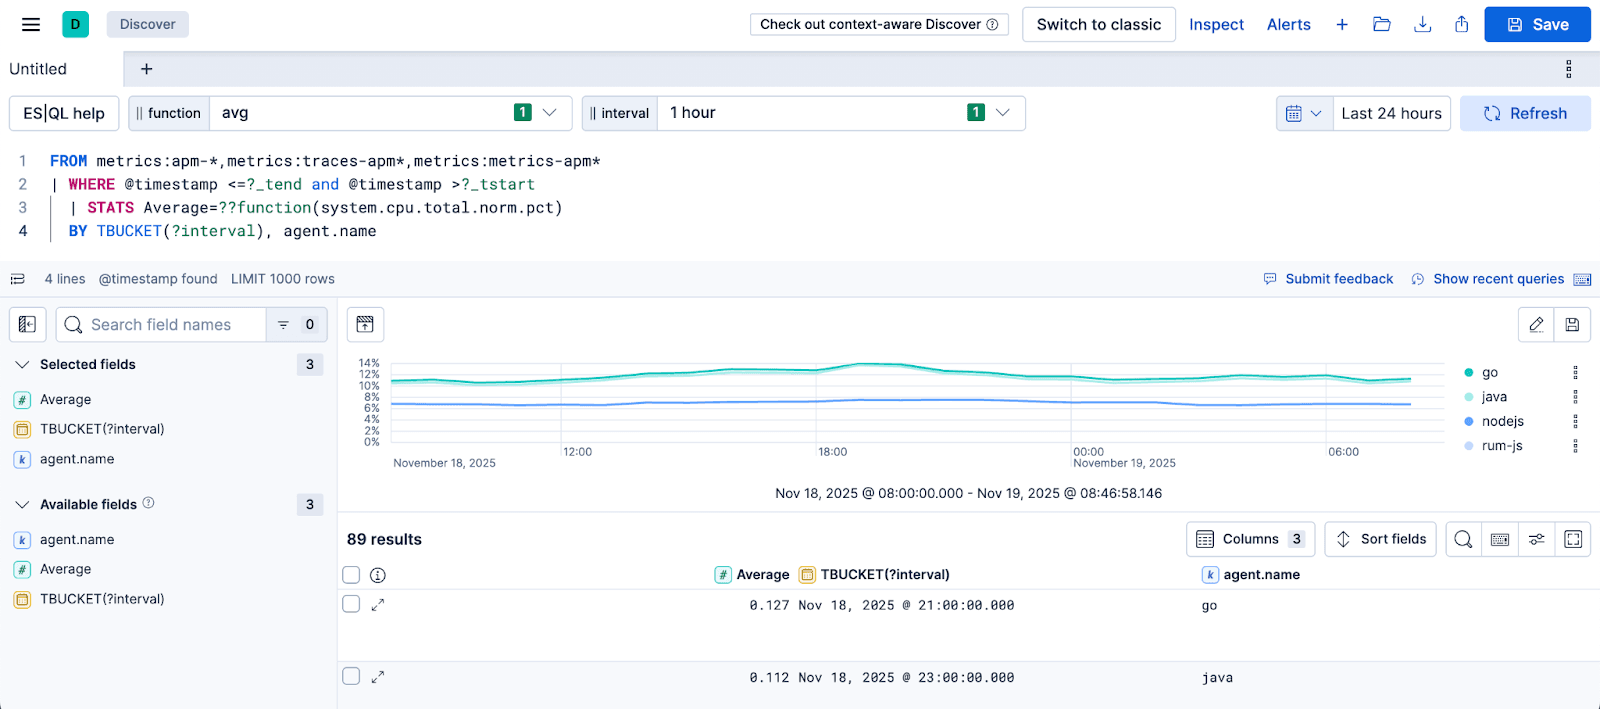
Example 3: variables for functions
- Build a variable using the “Static values” type of control and add function names to your dropdown values. It’s important to use a name for your variable that starts with “??...” to replace functions.
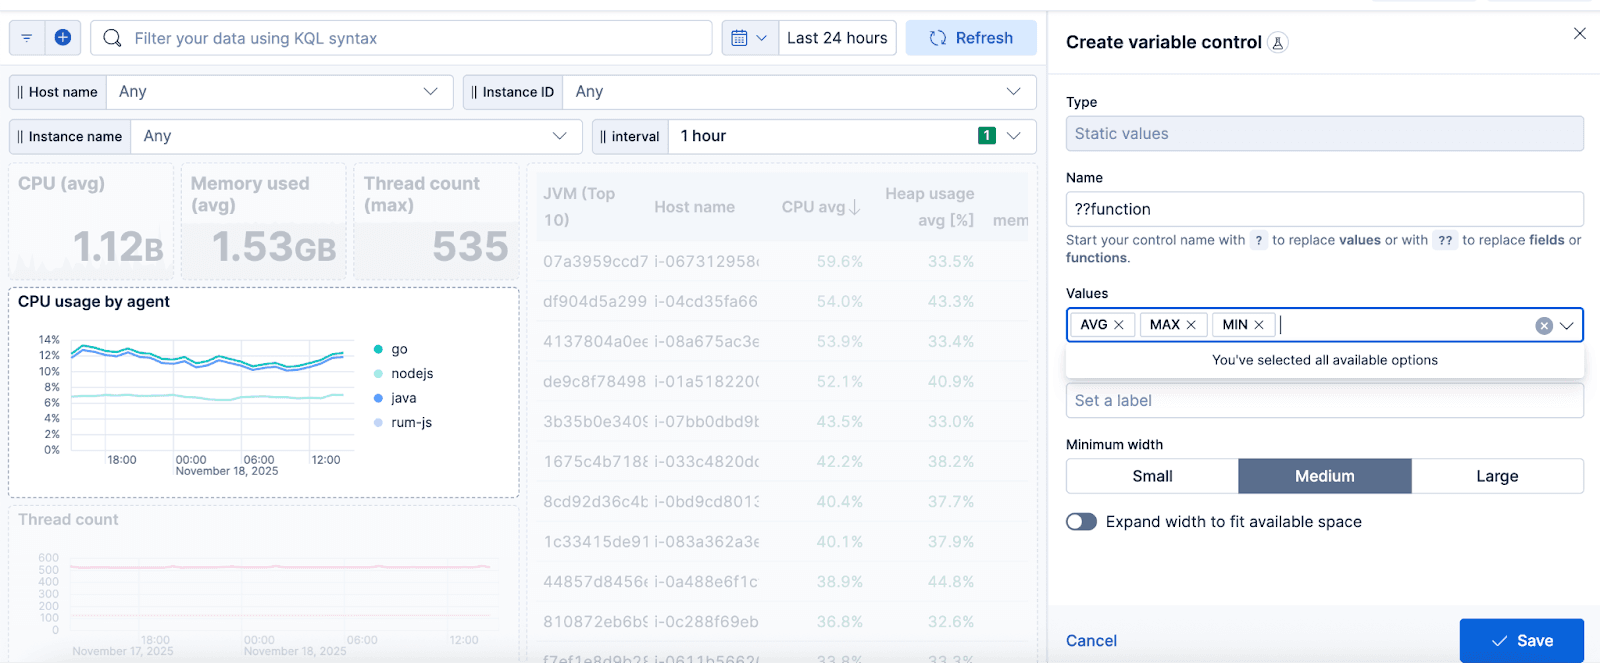
2. Include the variable name in your ES|QL query.

Example 4: variables for fields
- You can use the “Static values” type of control and write down the names of the fields you want. It’s important to use a variable name that starts with “??...” to make it work for fields.

2. Reference the variable where you want in the visualization query.

Variable controls in Discover
Variable controls aren’t just a dashboard feature—they’re also available directly in the ES|QL editor in Discover. You can build controls for a faster data exploration experience in Discover, bring them to the dashboard and vice versa.
Technical details
By now, you’ve probably noticed that variable controls come with a few rules—like which parts of a query they can reference and the naming prefixes you need to use (“?...” for values and “??...” for fields or functions). That’s because variables aren’t just simple string replacements happening on the client. They’re actually first-class citizens in the query language itself (known as parameters in ES|QL).
This design brings some big advantages. For one, Kibana can understand the context of each variable, which allows us to automatically generate and pre-fill its configuration for you. It’s also much more secure: because the language strictly validates variable inputs, it prevents malicious injections and gracefully errors out if something looks off. Plus, it improves performance and stability by shifting complex validation and error handling to the server instead of the client. A note on performance, a best practice is to build variables that include fast queries since they load before the dashboard so, slow queries can affect the whole dashboard performance.
Of course, this architecture also comes with a few limitations—for now. Variables don’t yet support an “Any” option for filtering, and they can’t currently be used with certain operators like LIKE or FROM (for switching data sources). The good news? We’re actively working on adding these capabilities.
What the future holds for controls
We’re not stopping here! Some of the improvements on our radar include:
✨ The ability to place controls anywhere on the dashboard
✨ Chaining your controls—meaning the output of one control becomes the input for the next
✨ Better selection options like “Any” selection for variables
✨ New control types (search-type control and variables for your datasources)
✨ And more quality-of-life improvements you’ve been asking for like pre-filtering normal controls
If you have ideas or feedback, we’d love to hear from you.
Related Content

July 9, 2026
Why Elasticsearch is becoming a columnar database
Elasticsearch is becoming a first-class columnar database. Columnar Mode ships in 9.5, storing data once alongside the existing modes and cutting storage footprints while speeding up analytical queries.
How to build search analytics on Elastic using OpenTelemetry, no extra pipeline required
How to instrument your search application to use modern Open Telemetry standard to drive insights in to your search and users.
Follow the money: tracing laundering networks with ES|QL and cross-cluster search
The data model, cross-cluster architecture and five ES|QL queries that power mule detection and laundering network tracing, built from infrastructure most financial institutions already run.
June 25, 2026
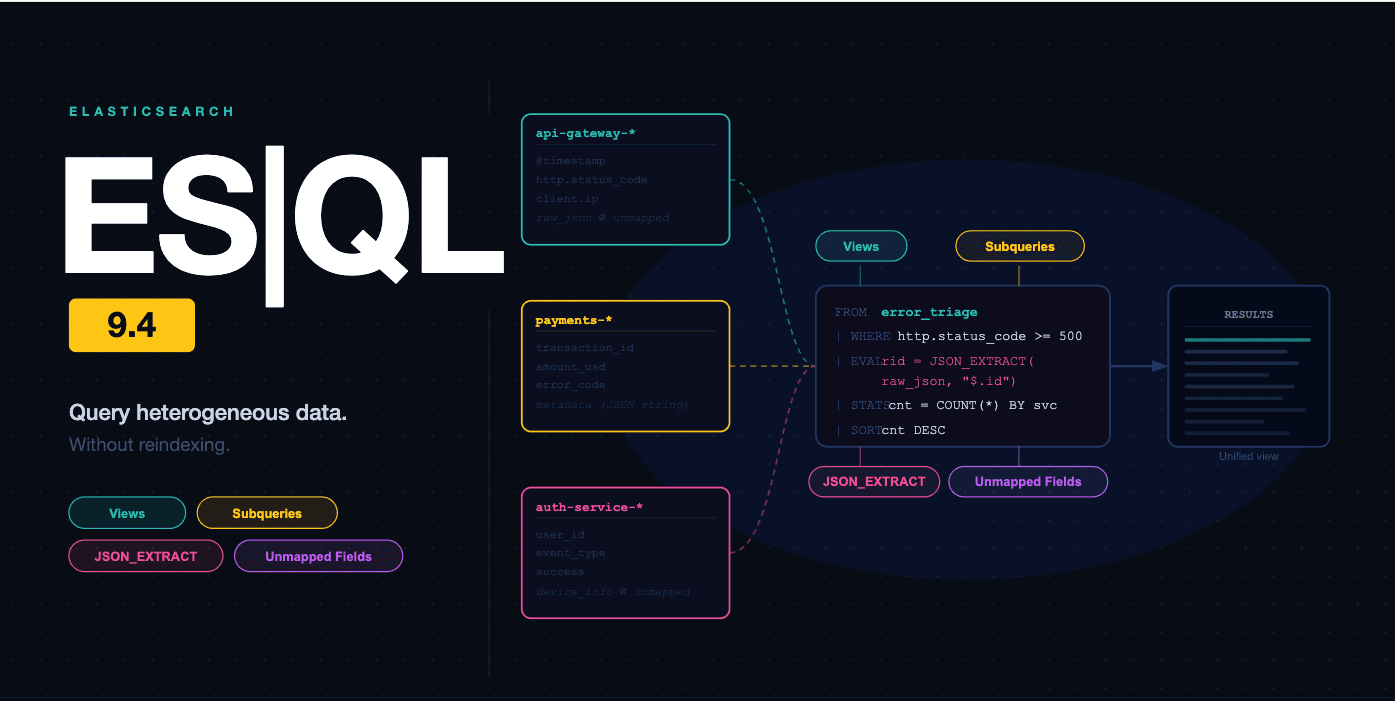
Elasticsearch ES|QL: Now with Views, Subqueries, and Schema-on-Read
Query fields you never mapped, combine indices with different schemas in one pipeline, and reuse query logic as named views. ES|QL's most significant data access expansion yet.

June 4, 2026
137,000 people, zero human decisions: agentic disaster response with Elasticsearch
Find out how a Kibana detection rule, a workflow and an AI agent automatically relocated 137,000 military personnel across seven installations when a hurricane hit, no dispatcher required.