Elastic Observability 7.14: Unified telemetry and accelerated application root cause analysis
Elastic Observability 7.14 introduces the general availability of unified telemetry and centralized agent management with Elastic Agent and Fleet, enabling faster and simpler data onboarding, and reduced security risk, in addition to enhanced correlations for accelerated root cause analysis in Elastic APM.
These new features allow customers to:
- Collect all forms of data from anywhere with a single unified agent per host, with just one agent to install, configure, and scale
- Deploy endpoint security seamlessly across their infrastructure, bringing DevOps and security teams into greater convergence
- Quickly surface factors that have the most significant impact on service performance
Elastic Observability 7.14 is available now on Elastic Cloud — the only hosted Elasticsearch offering to include all of the new features in this latest release. You can also download the Elastic Stack and our cloud orchestration products, Elastic Cloud Enterprise and Elastic Cloud for Kubernetes, for a self-managed experience.
Simpler and faster data onboarding with secure, centralized agent management
In a world where the number of data sources continues to rise exponentially, deploying, managing, and maintaining agents poses a formidable challenge for organizations, especially when the monitored resources can number in the tens of thousands. This complexity exposes organizations to rising costs, increased security risks, and time-consuming upgrades and patch updates.
Elastic’s Fleet application secures and centralizes the management of Elastic Agents. Elastic agents are a unified approach to security and observability data collection via a single agent that make installation and management of data integrations simpler, faster, and more scalable.
Fleet also allows you to deploy endpoint security seamlessly across your infrastructure, integrating security within your release processes without slowing down application development.
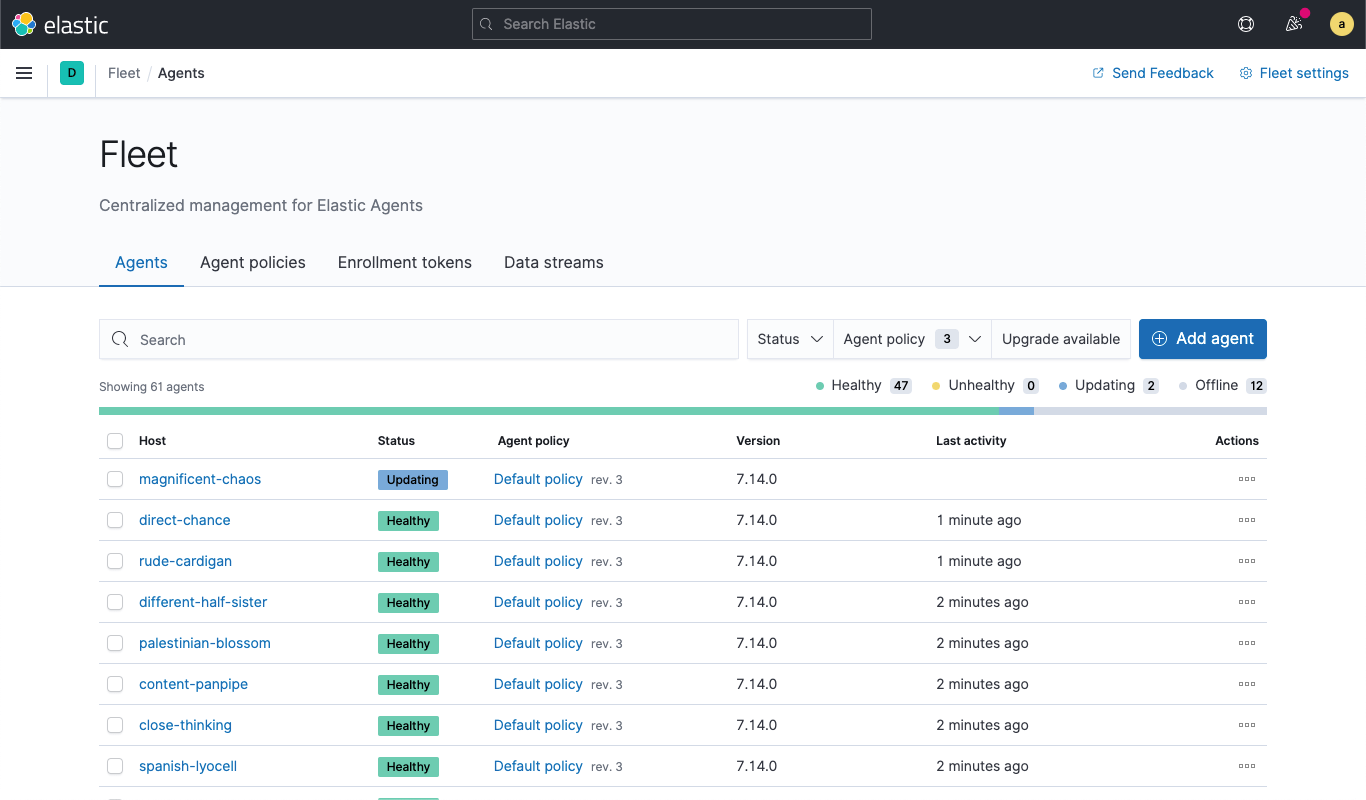
Notable features of Elastic Agent and Fleet include:
- Support for collection of logs, metrics, traces, and endpoint security data
- Ability to deploy agent upgrades and policies across thousands of agents with one-click at runtime via a user-friendly web UI
- Dozens of out-of-the-box Fleet integrations across a wide variety of platforms and services, including cloud, containers, networks, and hosts, with plans to port all 100+ Beats modules over in the next few releases
- A new architecture component (Fleet Server) that can be deployed centrally or at the edge, improving scalability and flexibility of supported ingest architectures
- Ability to get real-time updates on all your agents by tracking the agent status, configuration, overhead, processes, versions, etc.
- Support for OSQuery to easily ask questions for local information about your hosts
- Auto-discover support for Kubernetes, improving ease of deployment in highly dynamic orchestrated environments
- Ability to centrally manage APM server from Fleet
- Support for all the necessary components required to monitor hosts or VMs in a cloud or virtual environment
- Support for uptime and synthetics monitoring enabling users to enable HTTP checks via a graphical interface
- Endpoint security with malware protection and host isolation for containing network security threats
All this functionality is available in both Elastic Cloud and Elastic Cloud Enterprise (ECE), with hosted Fleet Server functionality fully managed as part of your deployment.
Take a deeper dive to see how to easily add integrations with Elastic Agent and Fleet.
Reduce MTTR with automated root cause analysis of application issues
Since it is virtually impossible to manually analyze the overwhelming amount of data and dependencies in modern applications, automation and analytics have become essential components of the troubleshooter’s toolkit. Elastic’s APM correlations feature (beta) accelerates root cause analysis by automatically surfacing attributes of your data set —such as, infrastructure components, versions, and locations — that are correlated with high-latency or erroneous transactions and have the most significant impact on your service performance. You can visualize the latency distribution of any attribute compared to overall latency and use these attributes to filter and isolate the root causes of your performance problems.
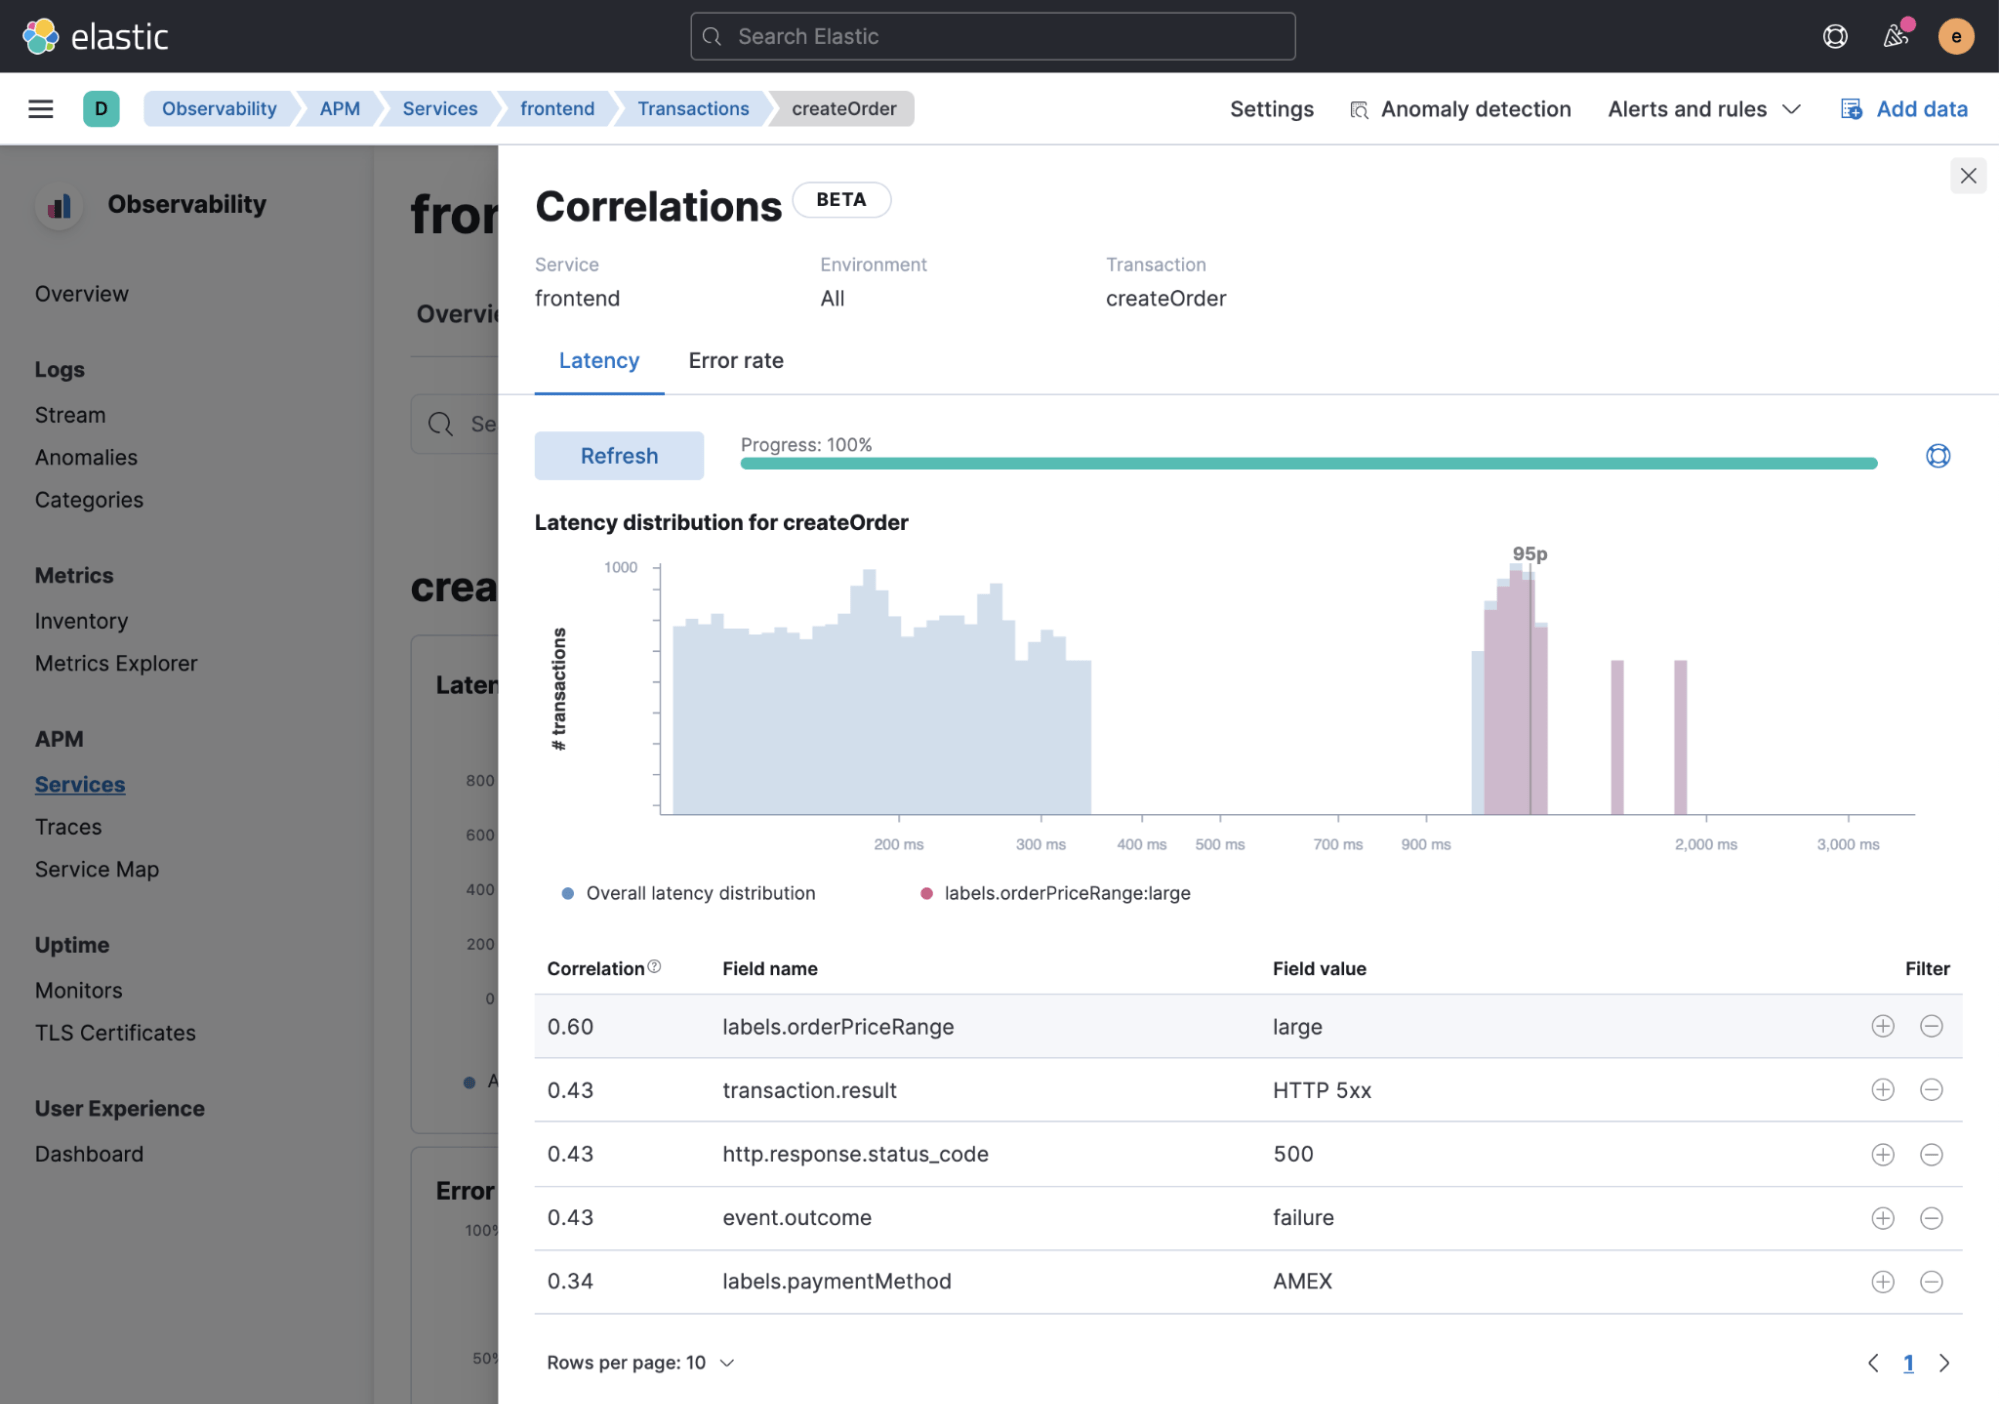
Elastic Observability 7.14 introduces the second beta release of the correlations feature which now offers several improvements based on your feedback.
- We have significantly improved the accuracy with which we detect correlations by introducing a new aggregation in Elasticsearch.
- You no longer need to specify custom fields as new logic automatically scans all available metadata, including versions, locations, and custom labels. This covers all possible variations and helps uncover unknown unknowns.
- The UI visualization now uses a log-log axis, making it easier to spot performance patterns and detect outliers. Other UI improvements include deduplication of correlation results, finer-grained density of the distribution chart, and asynchronous population of results for improved user experience.
Try it out
Existing Elastic Cloud customers can access many of these features directly from the Elastic Cloud console, or, if you'd prefer, you can download the latest version.
If you’re new to Elastic Cloud, take a look at our Quick Start guides (bite-sized training videos to get you started quickly) or our free fundamentals training courses. You can always get started for free with a free 14-day trial of Elastic Cloud.
Read about these capabilities and more in the Elastic Observability 7.14 release notes, and other Elastic Stack highlights in the Elastic 7.14 announcement post.
The release and timing of any features or functionality described in this post remain at Elastic's sole discretion. Any features or functionality not currently available may not be delivered on time or at all.