Find transaction latency and failure correlations
editFind transaction latency and failure correlations
editCorrelations surface attributes of your data that are potentially correlated with high-latency or erroneous transactions. For example, if you are a site reliability engineer who is responsible for keeping production systems up and running, you want to understand what is causing slow transactions. Identifying attributes that are responsible for higher latency transactions can potentially point you toward the root cause. You may find a correlation with a particular piece of hardware, like a host or pod. Or, perhaps a set of users, based on IP address or region, is facing increased latency due to local data center issues.
To find correlations, select a service on the Services page in the APM app and click View correlations.
Queries within the APM app are also applied to the correlations.
Find high transaction latency correlations
editThe correlations on the Latency tab help you discover which attributes are contributing to increased transaction latency.
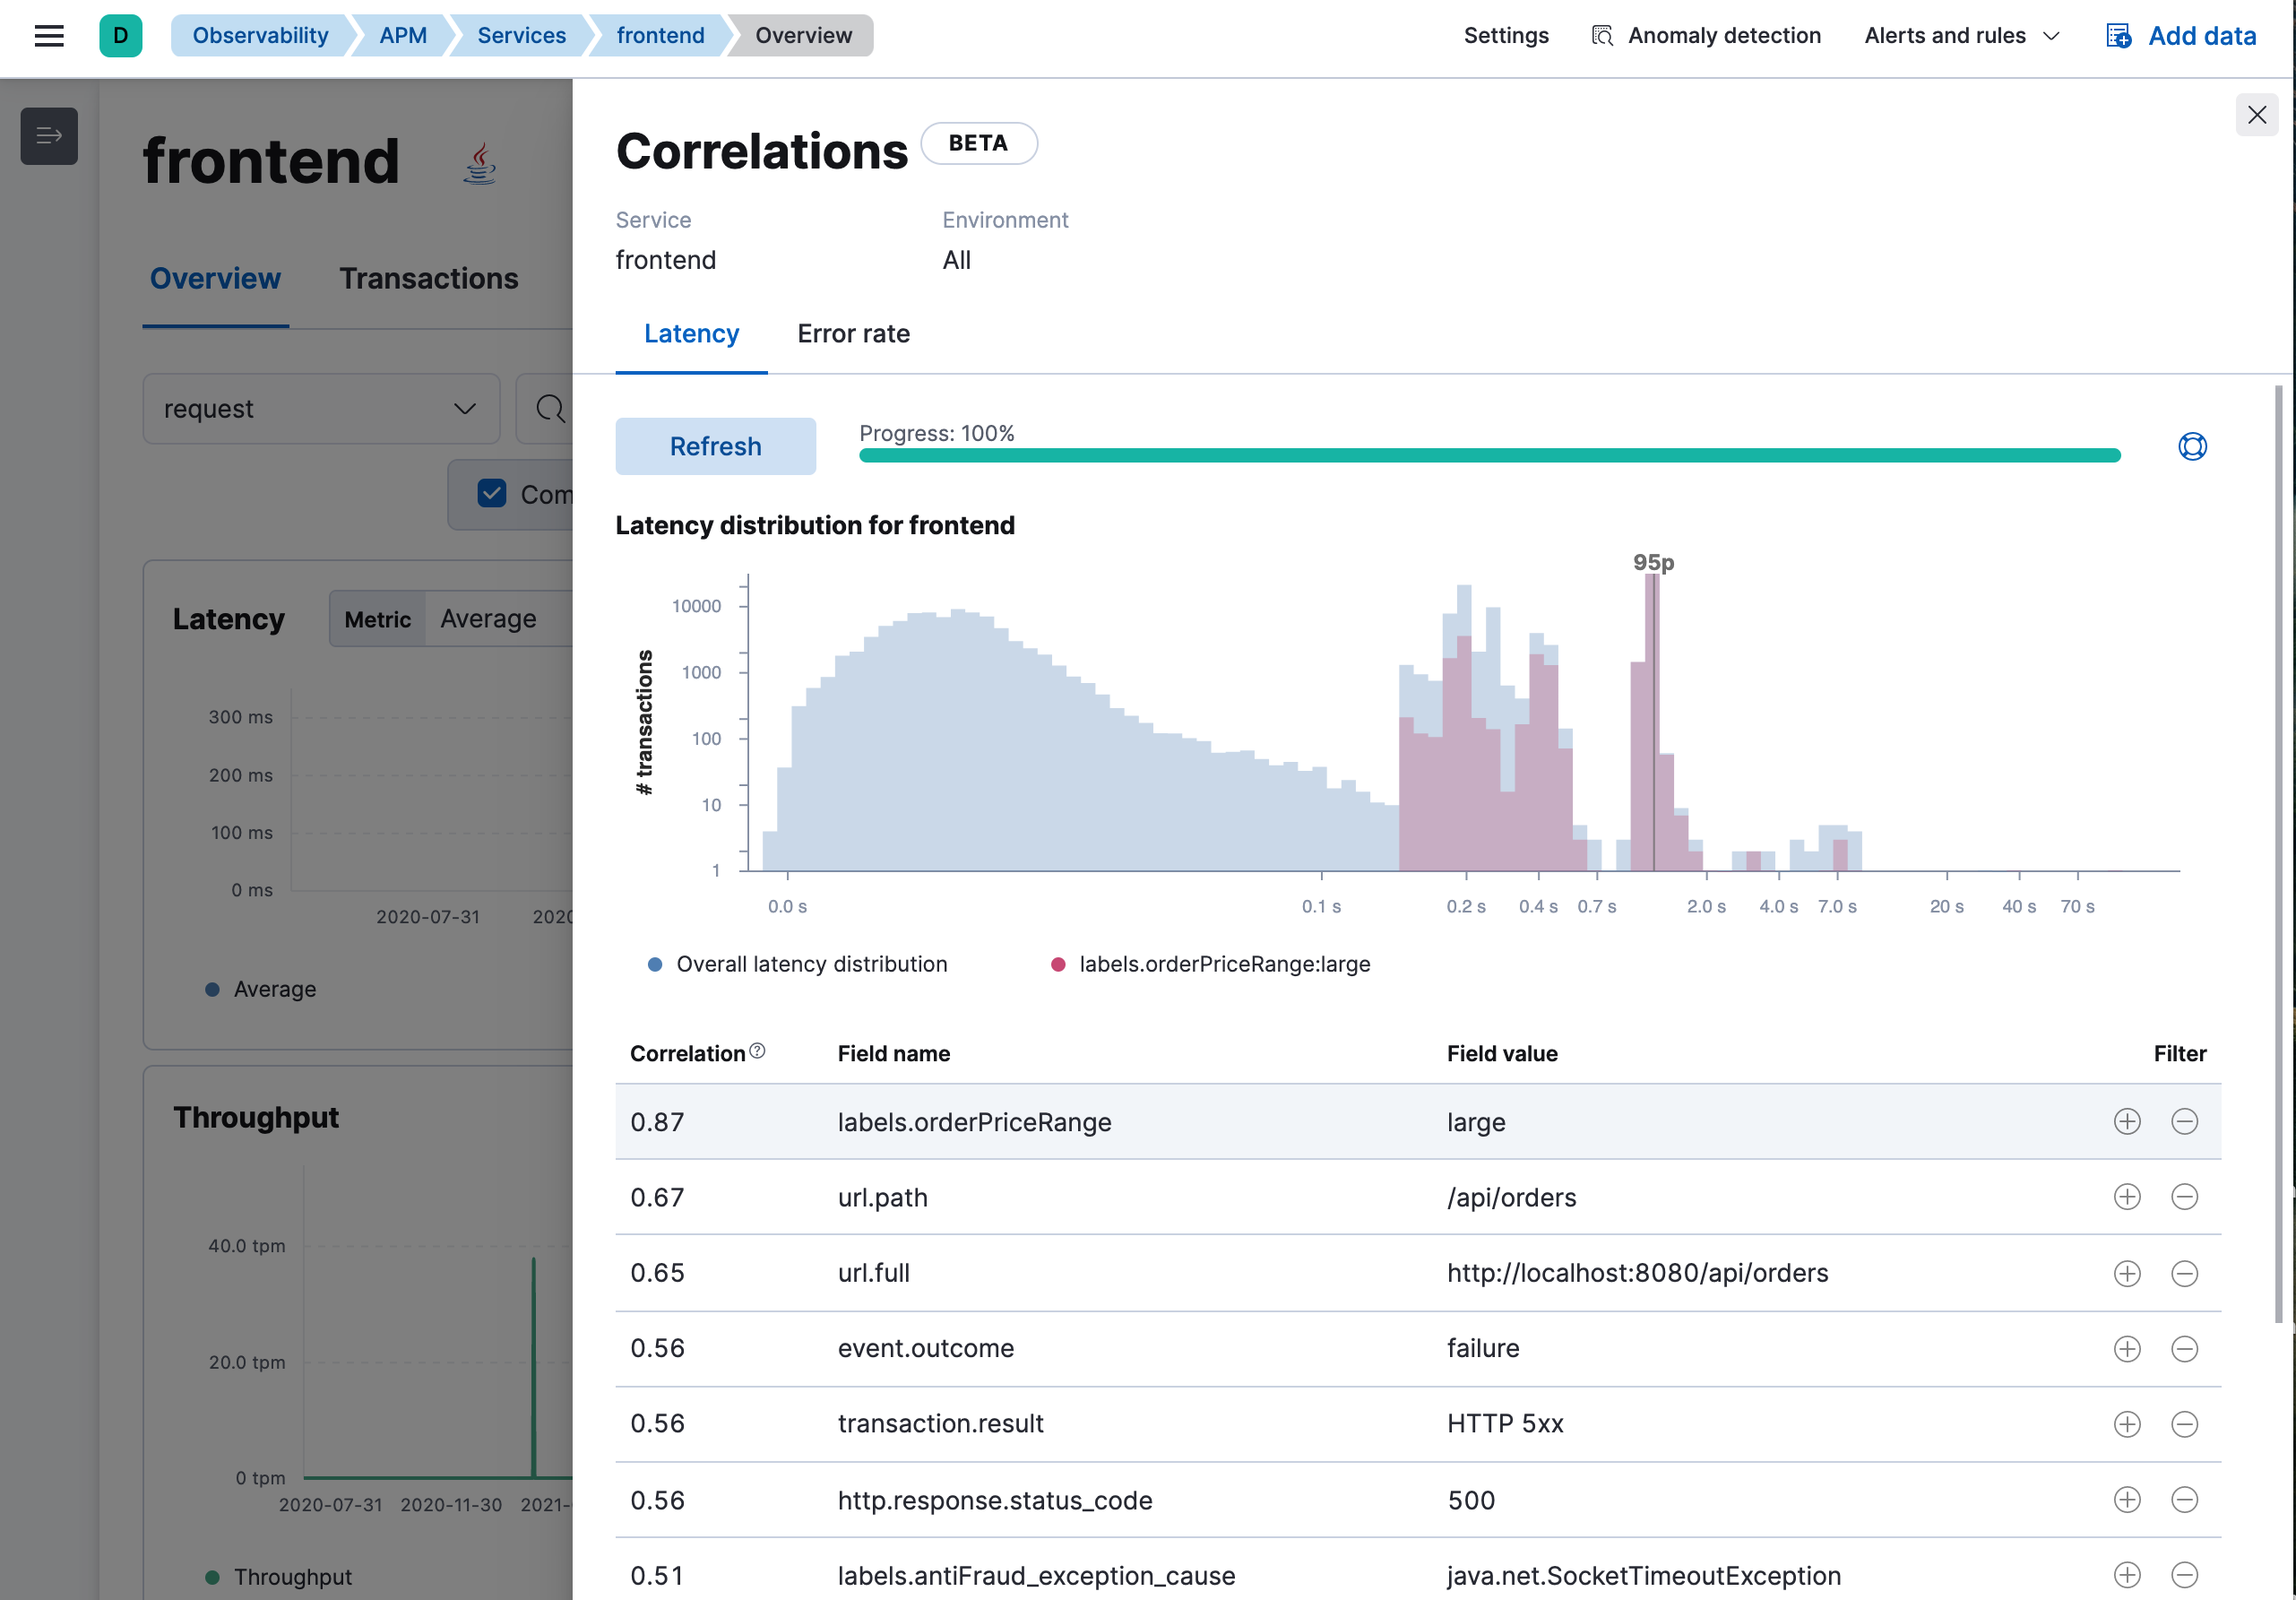
The progress bar indicates the status of the asynchronous analysis, which performs statistical searches across a large number of attributes. For large time ranges and services with high transaction throughput this might take some time. To improve performance, reduce the time range on the service overview page.
The latency distribution chart visualizes the overall latency of the transactions in the service. If there are attributes that have a statistically significant correlation with slow response times, they are listed in a table below the chart. The table is sorted by correlation coefficients that range from 0 to 1. Attributes with higher correlation values are more likely to contribute to high latency transactions. By default, the attribute with the highest correlation value is added to the chart. To see the latency distribution for other attributes, hover over their row in the table.
If a correlated attribute seems noteworthy, use the Filter quick links:
-
+creates a new query in the APM app for filtering transactions containing the selected value. -
-creates a new query in the APM app to filter out transactions containing the selected value.
In this example screenshot, transactions with the field
labels.orderPriceRange and value large are skewed to the right with slower
response times than the overall latency distribution. If you select the +
filter in the appropriate row of the table, it creates a new query in the
APM app for transactions with this attribute. With the "noise" now filtered
out, you can begin viewing sample traces to continue your investigation.
Find failed transaction correlations
editThe correlations on the Error rate tab help you discover which fields are contributing to failed transactions.
By default, a number of attributes commonly known to cause performance issues, like version, infrastructure, and location, are included, but all are completely customizable to your APM data. Find something interesting? A quick click of a button will auto-query your data as you work to resolve the underlying issue.
The error rate over time chart visualizes the change in error rate over the selected time frame. Correlated attributes are sorted by Impact–a visual representation of the significant terms aggregation score that powers correlations. Attributes with a high impact, or attributes present in a large percentage of failed transactions, may contribute to increased error rates.
To find error rate correlations, hover over each potentially correlated attribute to compare the error rate distribution of transactions with and without the selected attribute.
For example, in the screenshot below, the field url.original and value http://localhost:3100...
existed in 100% of failed transactions between 6:00 and 10:30.
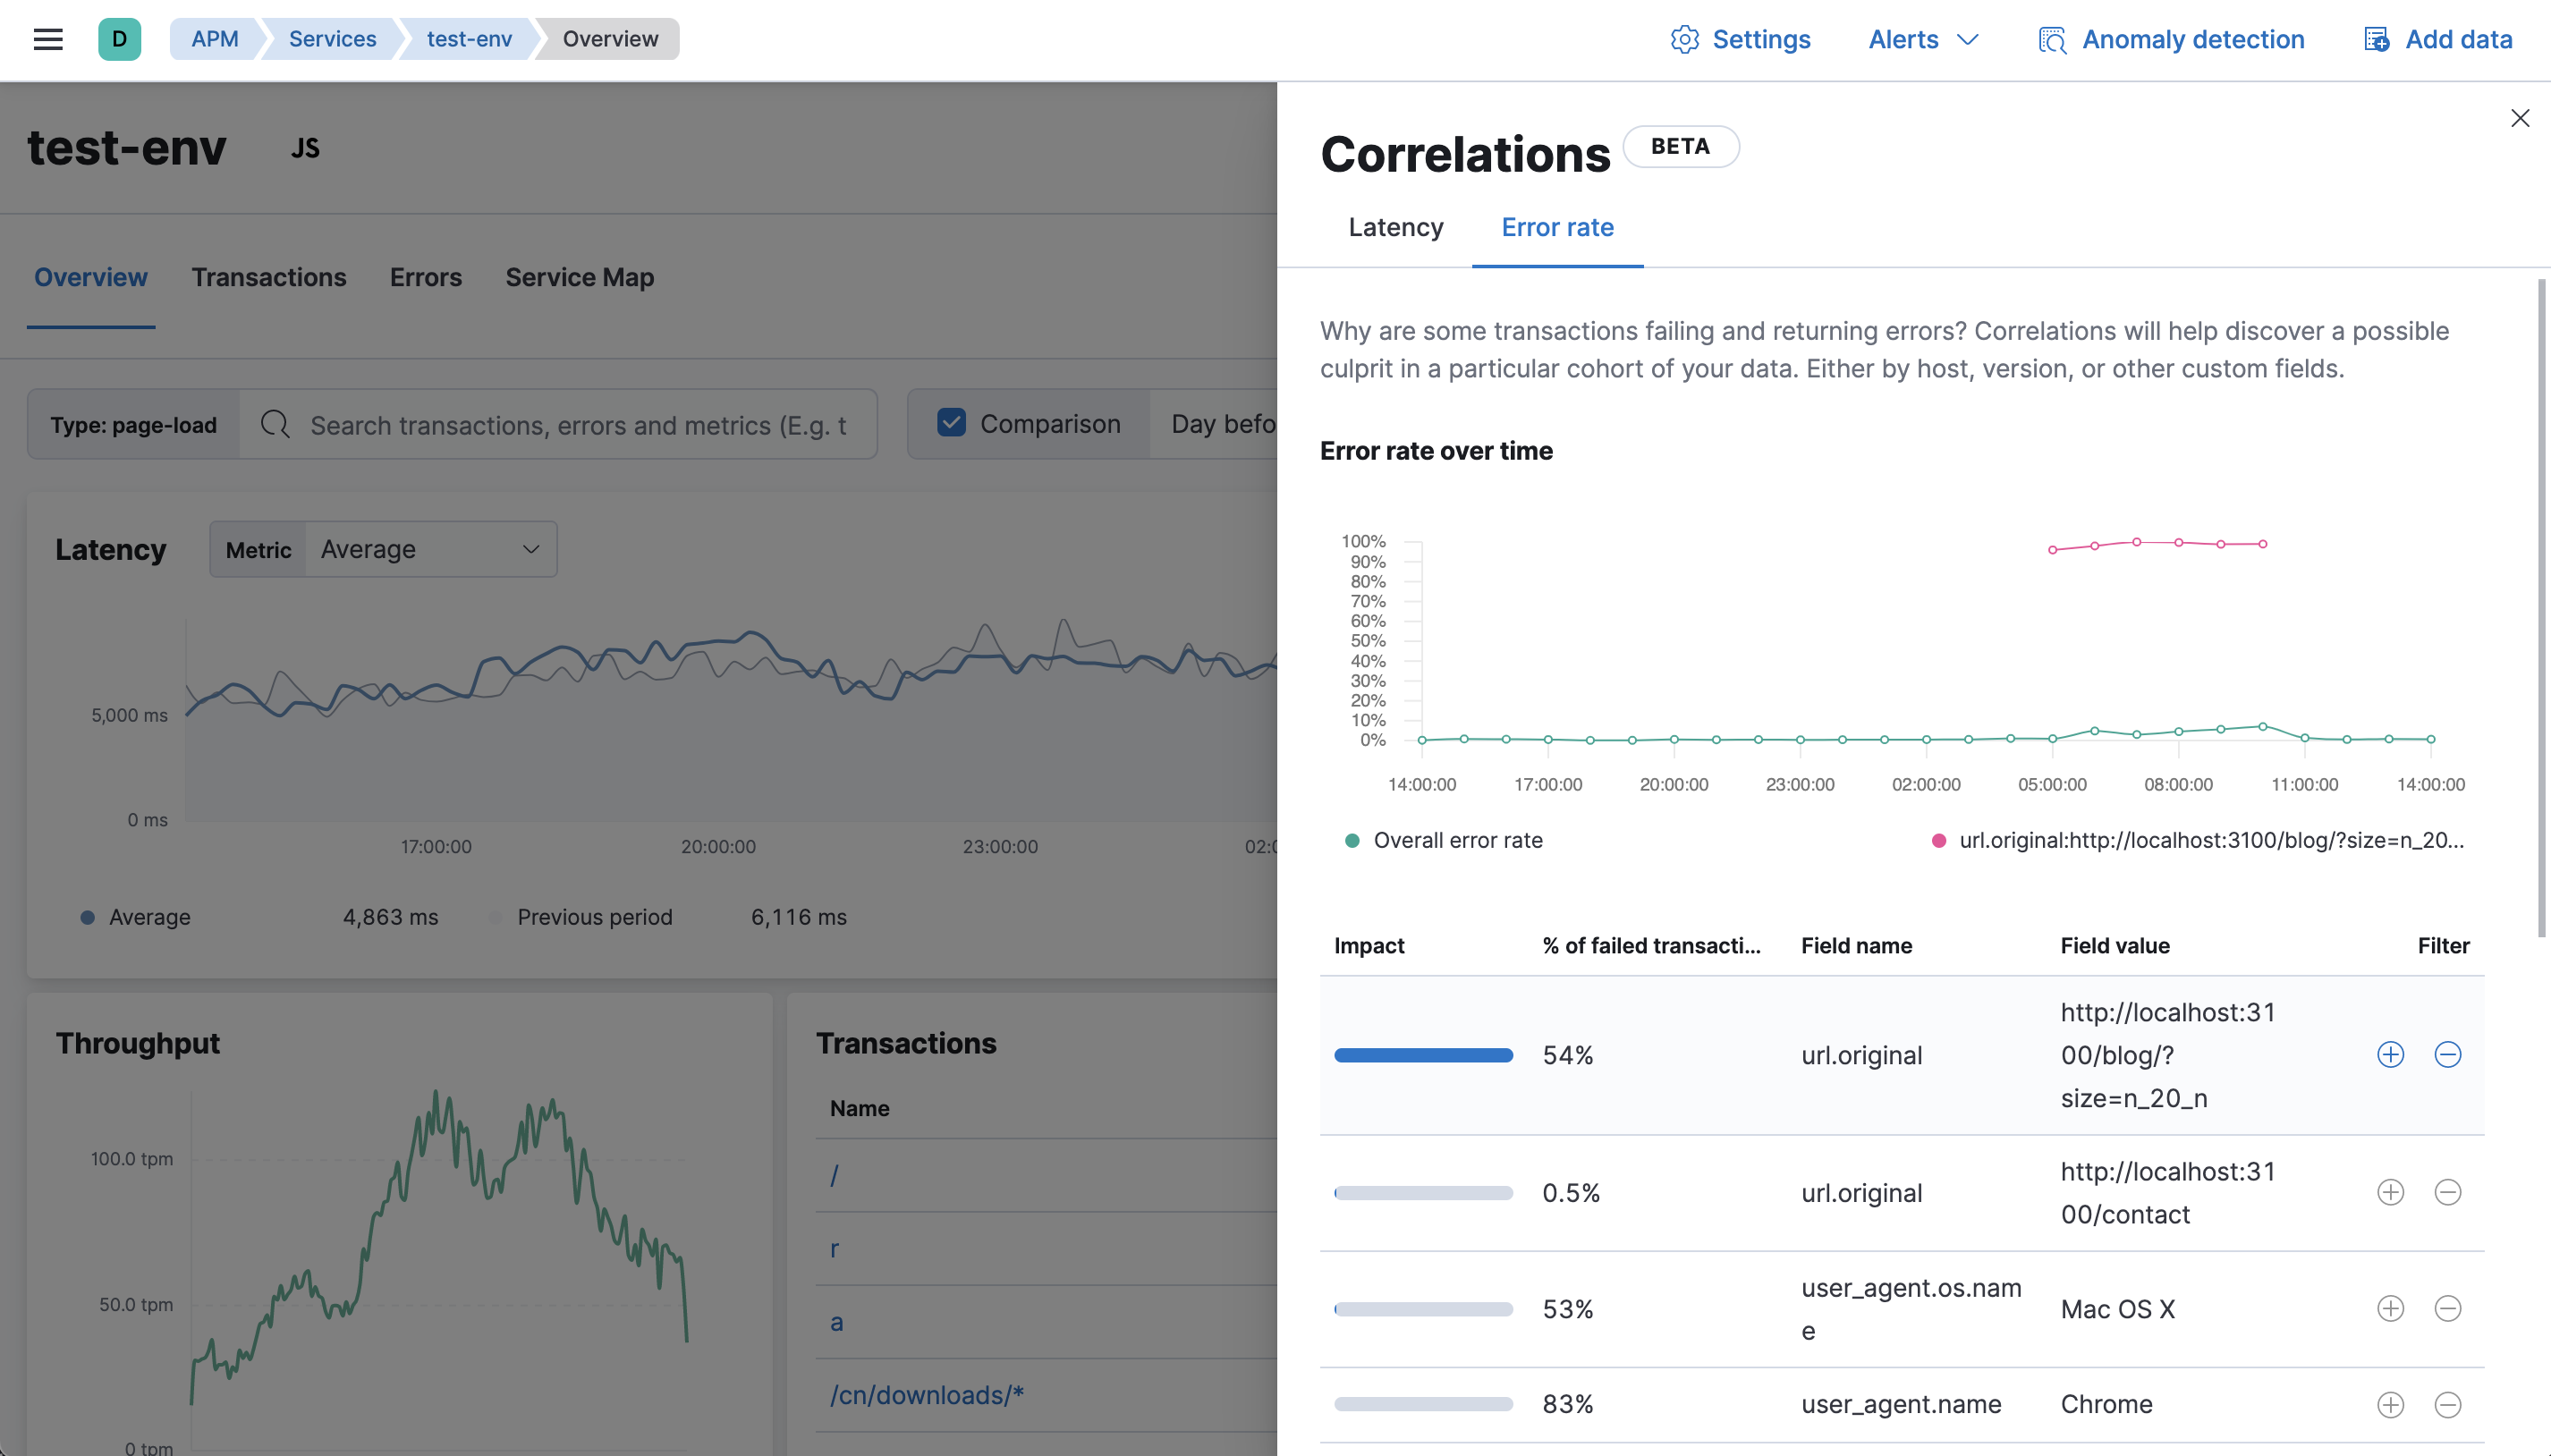
Select the + filter to create a new query in the APM app for transactions with
url.original: http://localhost:3100.... With the "noise" now filtered out,
you can begin viewing sample traces to continue your investigation.
As you sift through erroneous transactions, you’ll likely notice other interesting attributes. Return to the correlations fly-out and select Customize fields to search on these new attributes. You may need to do this a few times–each time filtering out more and more noise and bringing you closer to a diagnosis.
Customize fields
editBy default, a handful of attributes commonly known to cause performance issues are included in the analysis on the Error rate tab. You can add and remove fields under the Customize fields dropdown.
The following fields are selected by default. To keep the default list manageable, only the first six matching fields with wildcards are used.
Frontend (RUM) agent:
-
labels.* -
user.* -
user_agent.name -
user_agent.os.name -
url.original
Backend agents:
-
labels.* -
host.ip -
service.node.name -
service.version
- Want to start over? Select reset to clear your customizations.
- The Latency tab does not have a Customize fields dropdown, since it automatically considers all relevant fields in the transactions.