What can Elastic Synthetics tell us about Kibana Dashboards?

 Share on Twitter
Share on Twitter

 Share on LinkedIn
Share on LinkedIn

 Share on Facebook
Share on Facebook

 Share by Email
Share by Email

 Print this page
Print
I like to leverage our technologies to ensure our products have a pleasant user experience. Elastic Synthetics enables you to configure it in an out-of-the-box experience directly through your Elastic Cloud deployment without the need to install anything! It also works across the globe with multiple locations you can choose from. Ever wondered how fast your web service is when accessed from Japan, Germany, or the eastern U.S.? Now you can do this by simply clicking on a checkbox.
During my time as a system administrator, I often heard complaints from users about our services being slow. If we think of it in terms of Kibana, we often hear stories about slow dashboards. I thought, why not leverage Elastic Syntheticmonitoring to investigate if a dashboard is slow?
We all have different understandings of what “slow” means. With a synthetic monitor, I can prove that this dashboard has a usual loading time and investigate if anything unusual is happening. For example, if our dashboard loading times have doubled, maybe it is due to increased users and different time picker settings used. We can track nearly all of that with our RUM client in Kibana. Thanks to the synthetic monitors running in intervals, I can show the user that this is an average loading time and that the slowness might come from their network connection.
Getting started
First, we need a dashboard to monitor. I had one handy: the Berlin bicycle theft dashboard from this blog post.
Second, it is super easy and quick if you are on Elastic Cloud. Just head over to Uptime within Observability and press the Monitor Management button in the top bar. You can select whatever country you are interested in. Since my Kibana is running in Europe West, I am interested in Japan, Germany, and U.S. West. The frequency is used to determine how often this monitor is executed.
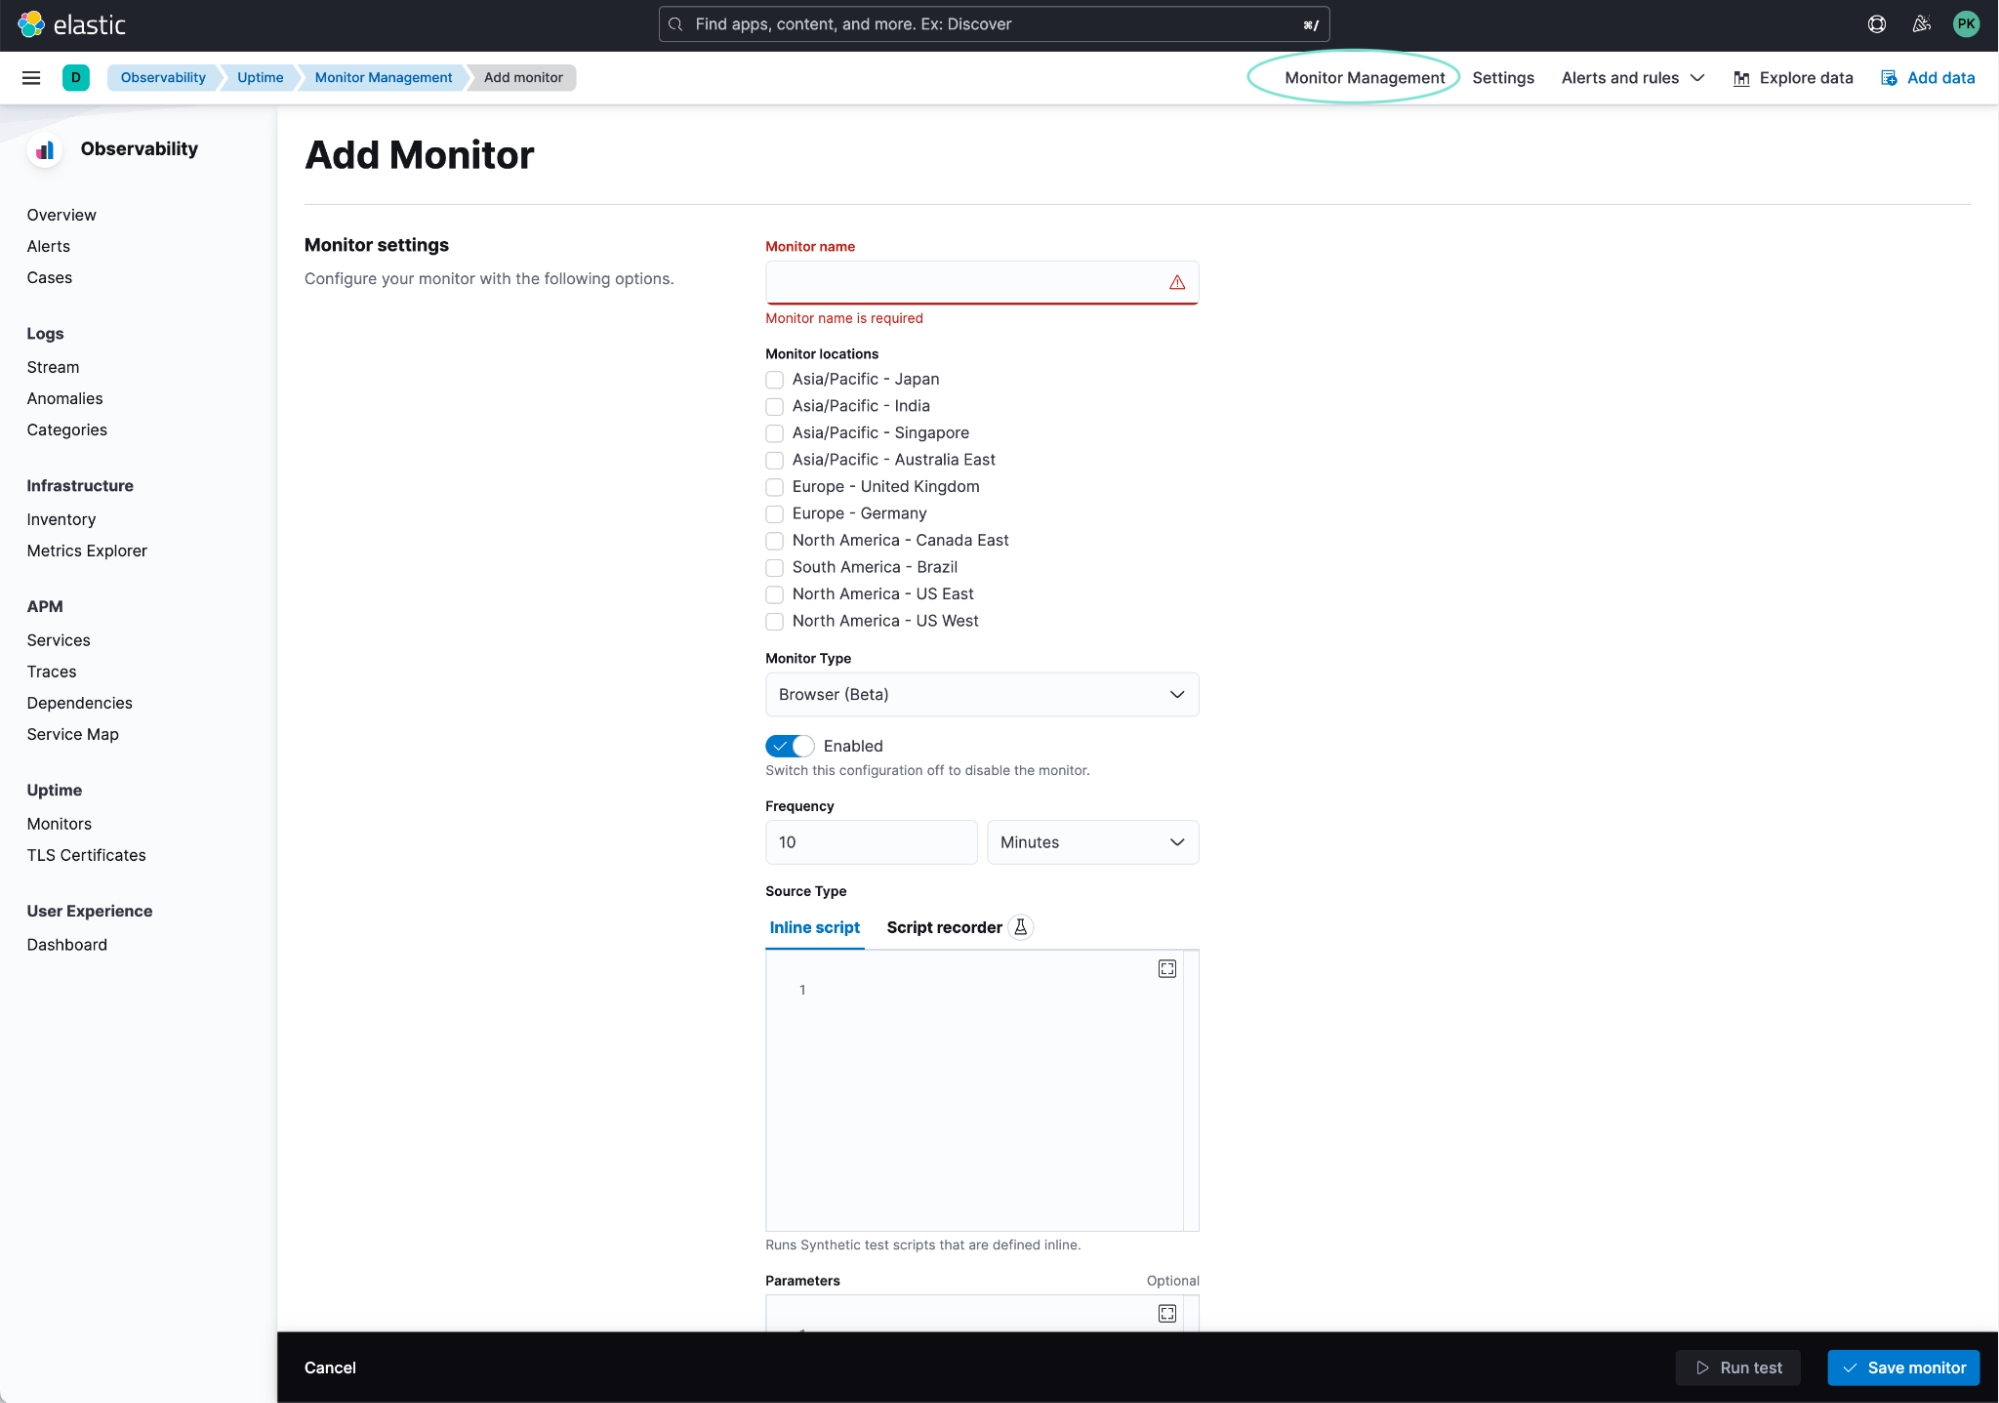
The monitor itself
How do we tell Elastic Synthetics what to do when visiting a website? There are two possibilities. You could write code using the Playwright Framework, or use our script recorder that is in beta (we would highly appreciate it if you could test it out and leave us feedback!). Here is an interesting read from another blog post covering much of the groundwork for synthetic tests.
I have prepared a synthetic test that does the following:
- Open Kibana.
- Log in.
- Click on the burger menu, then click on “Dashboards.”
- Click on the dashboard name and open it.
That is the code snippet we need!
step('Open Kibana', async () => {
await page.goto('https://kibana.elastic.co');
});
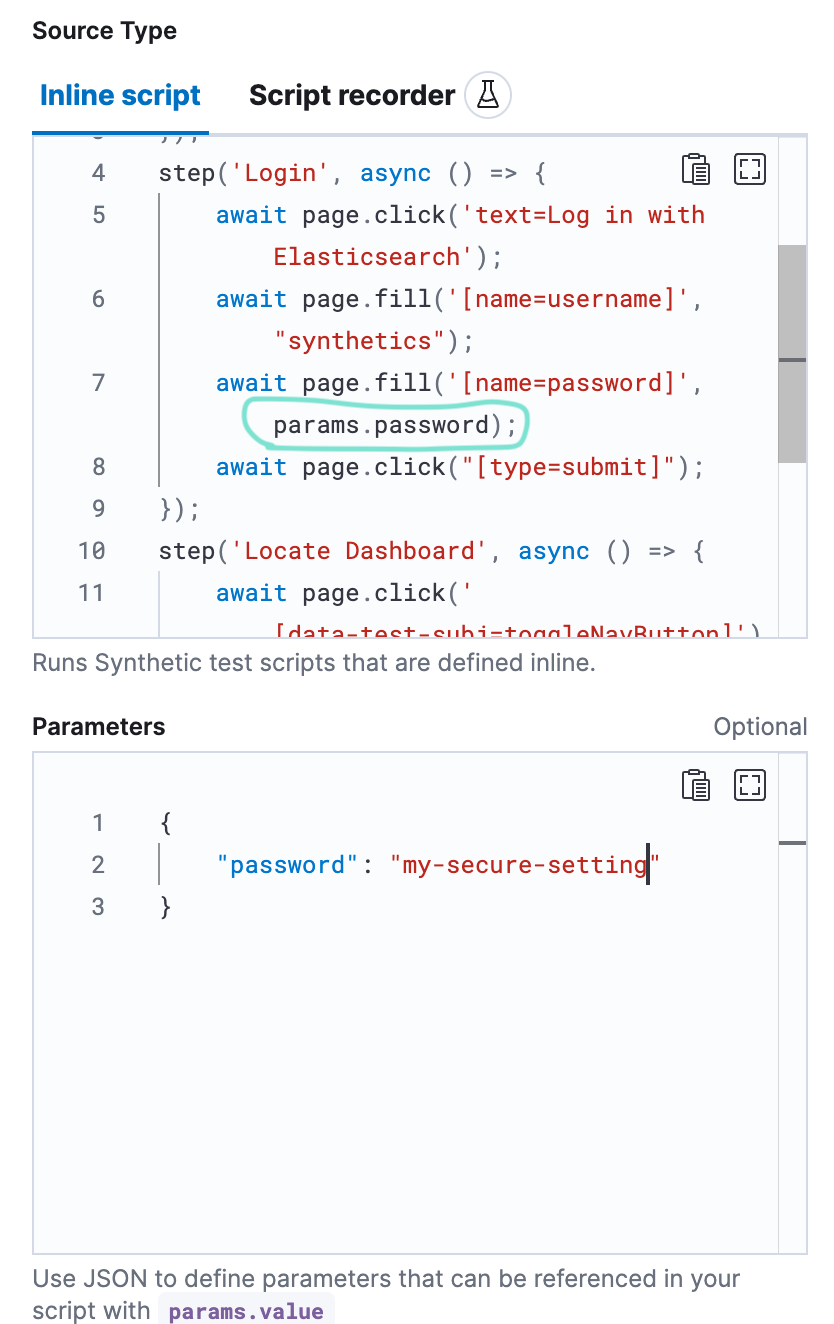
step('Login', async () => {
await page.click('text=Log in with Elasticsearch');
await page.fill('[name=username]', "synthetics");
await page.fill('[name=password]', params.pass);
await page.click("[type=submit]");
});
step('Locate Dashboard', async () => {
await page.click('[data-test-subj=toggleNavButton]');
await page.click('[title=Dashboard]');
await page.click('text=My Dashboard');
});
step('Load Dashboard', async() => {
await page.waitForSelector('[aria-label="Search session complete"]');
});Every time we do something, it is called a step. The simplest of steps is to visit a website called page.goto(‘URL’);.
Let’s look at the few things you will need to change:
- In the first step, ‘Open Kibana’ you need to alter the URL.
- In the second step, ‘Login’ you need to select a user and a password. I recommend creating a dedicated user with a role that only has access to this dashboard. The password is referenced as params.pass and you store the params in the box underneath as a JSON. In our case that is:
{
   "password": "my-secure-setting"
}
- In the third step, ‘Locate Dashboard’ you need to change the text=My Dashboard to the dashboard name you want to open.
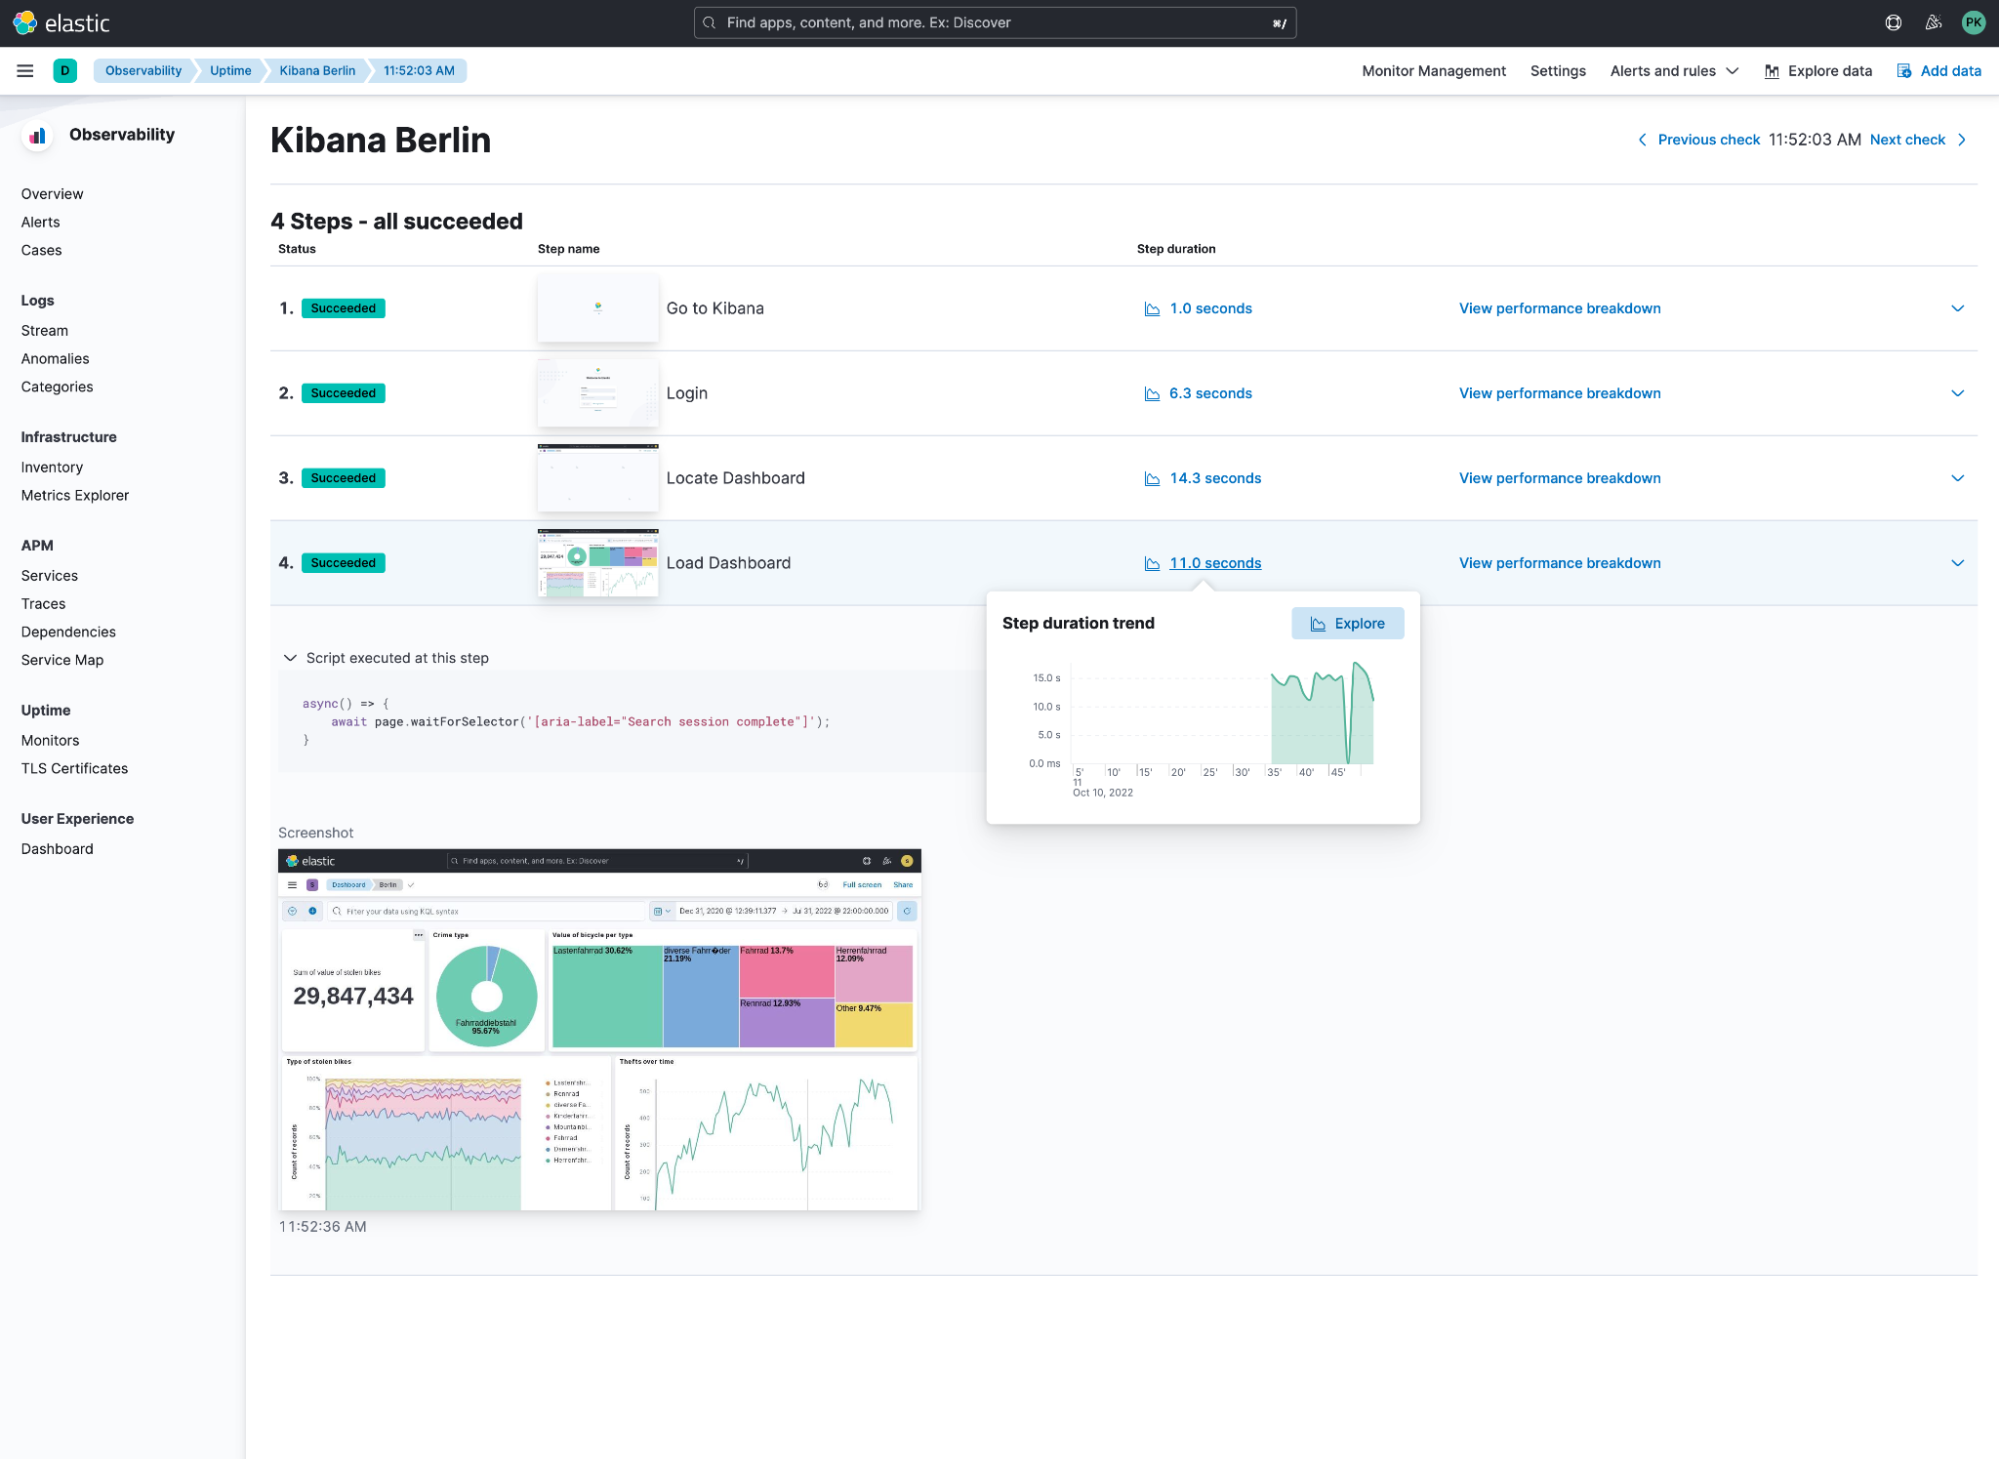
Now you click on the Run Test button or just save it. We first click on the test to see if we have an issue in our script. We also see a step-by-step breakdown of the test:
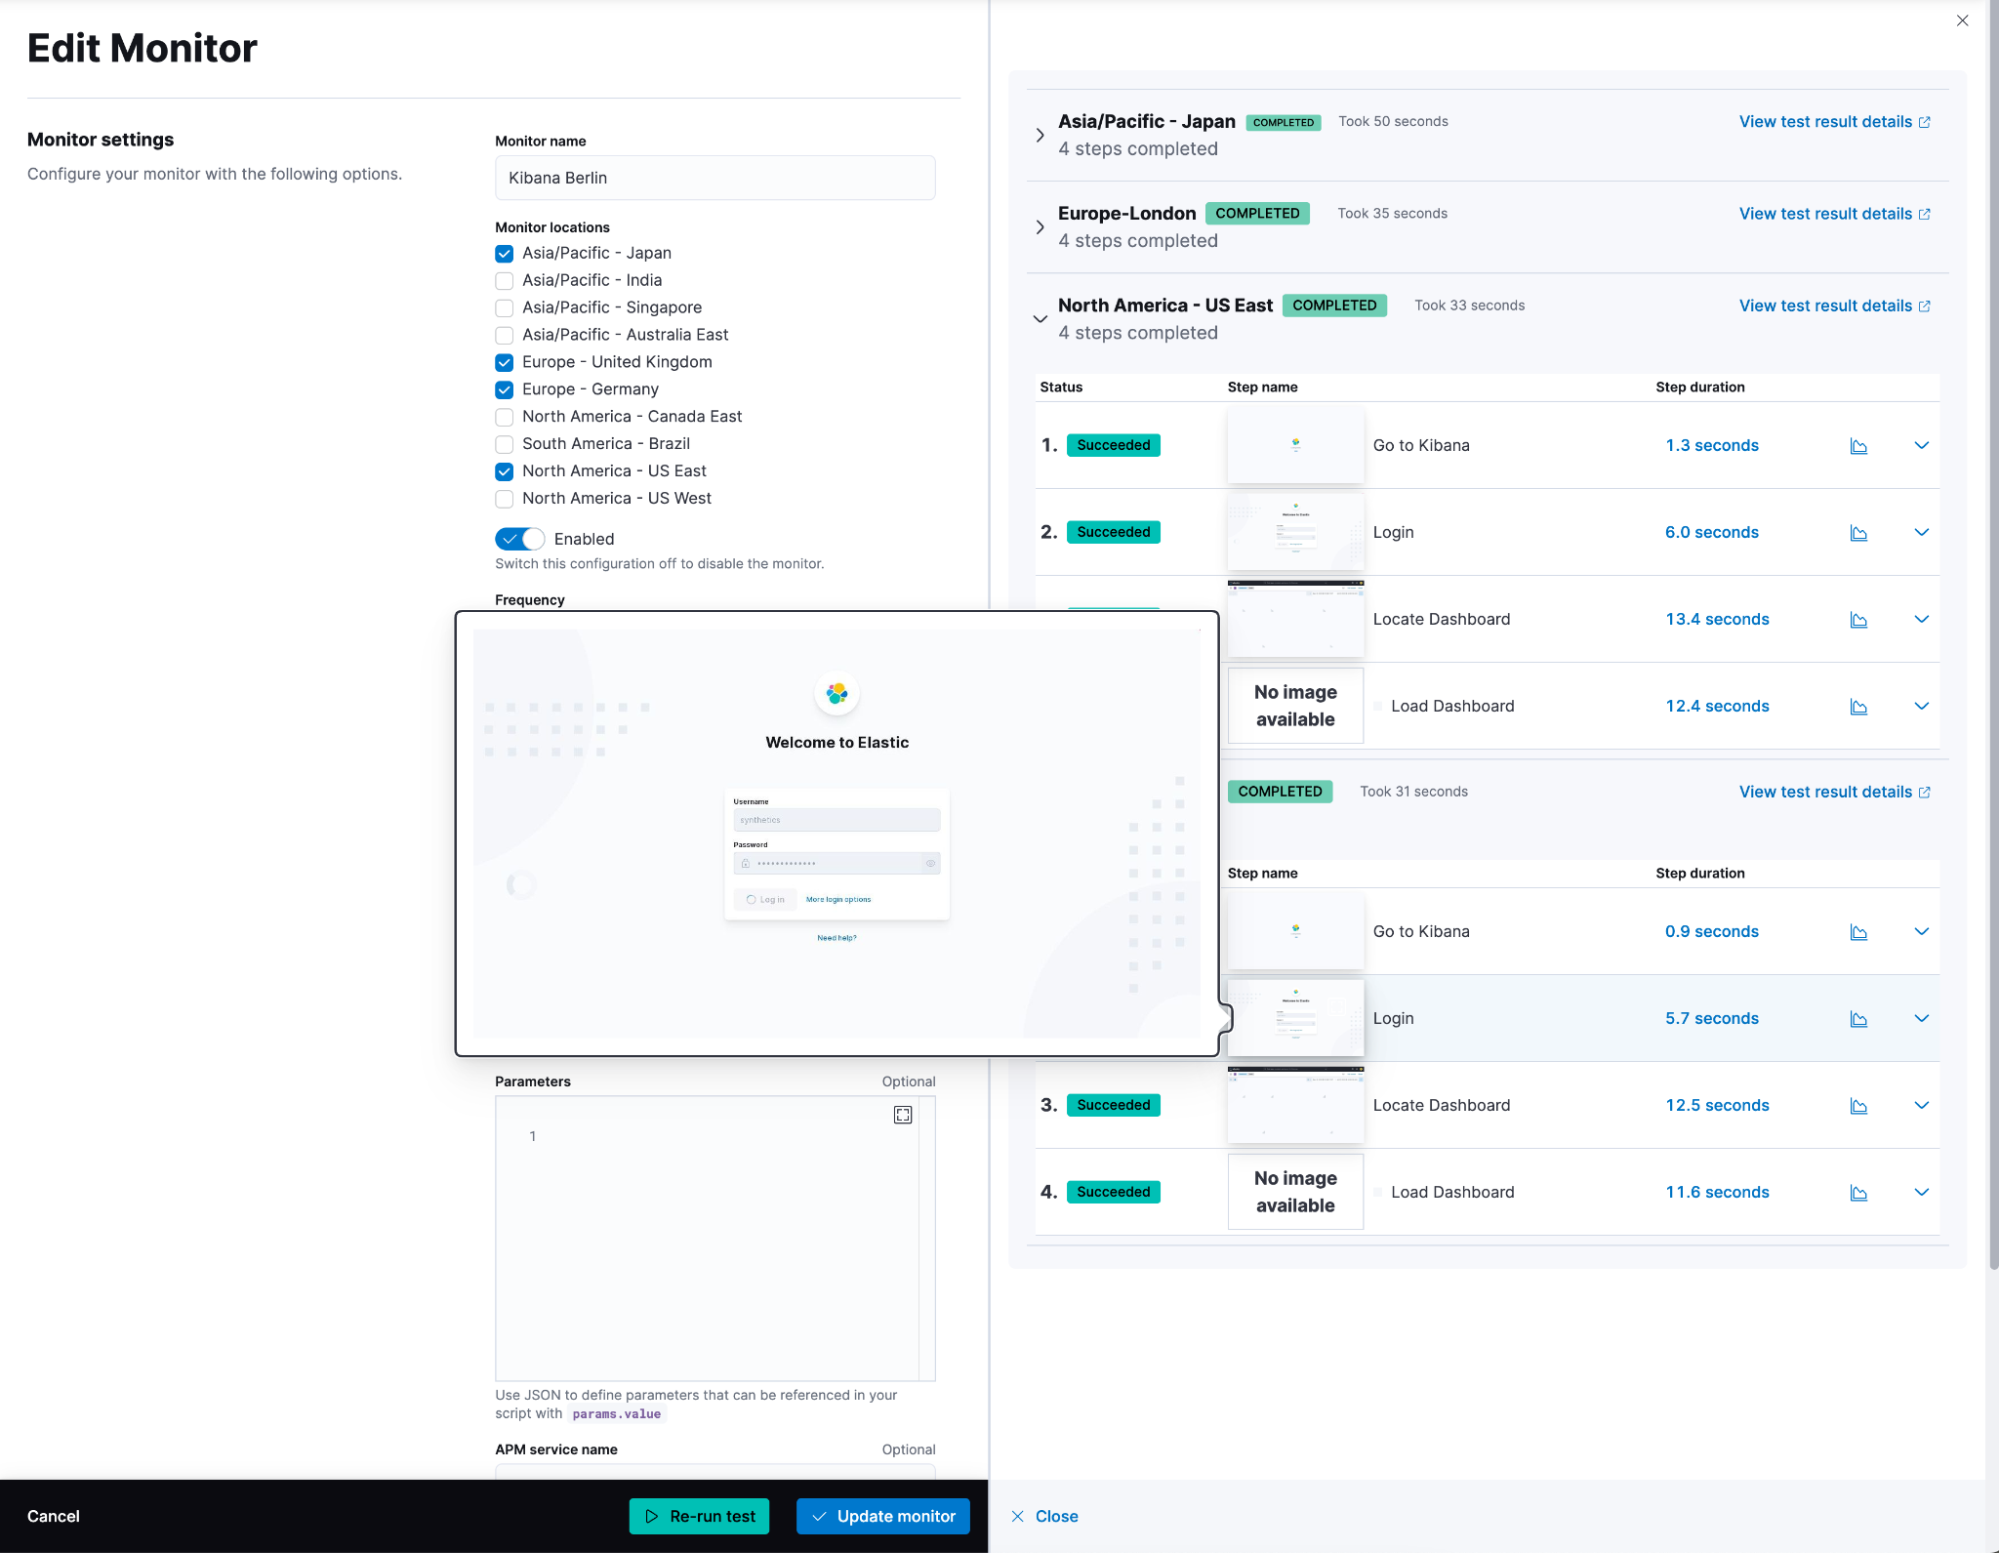
Let’s save this monitor and move on.
What’s next?
Head to the Uptime UI in observability and check out the new graphs. We can drill down and verify the average load time per region. We can enable machine learning out of the box to detect unusual page load times.
In our view, we can see that it once timed out for the Japan monitor.
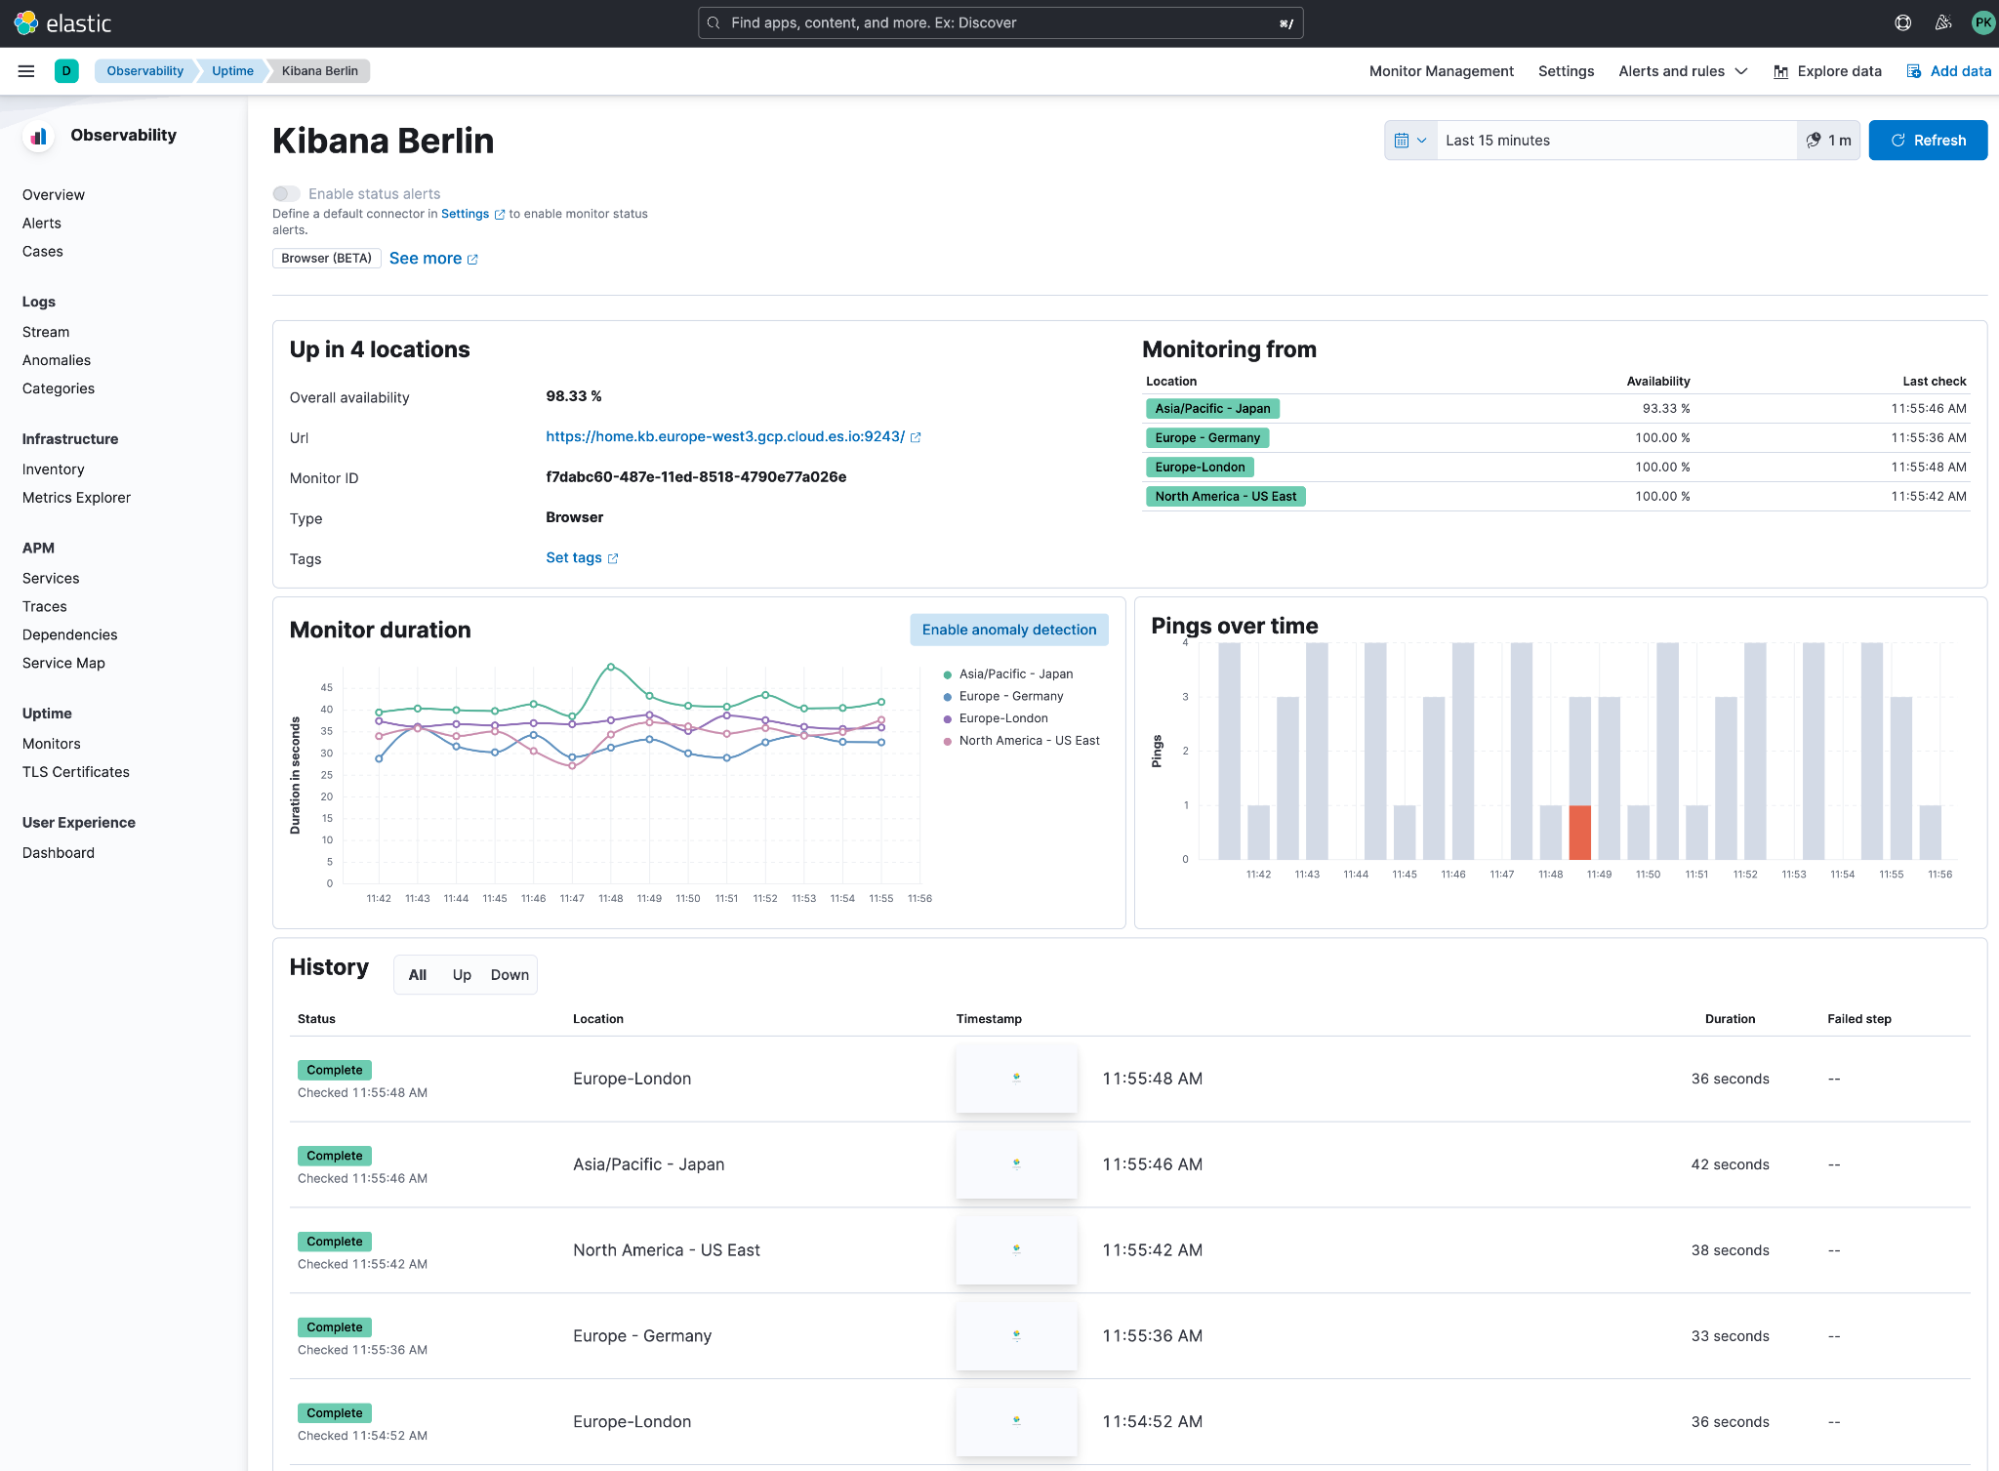
Now, if we click into one of those runs under history, we get a detailed view that explains each step with screenshots. Hovering over the step duration gives you a graph to quickly identify if 11 seconds are in the upper or the usual range.
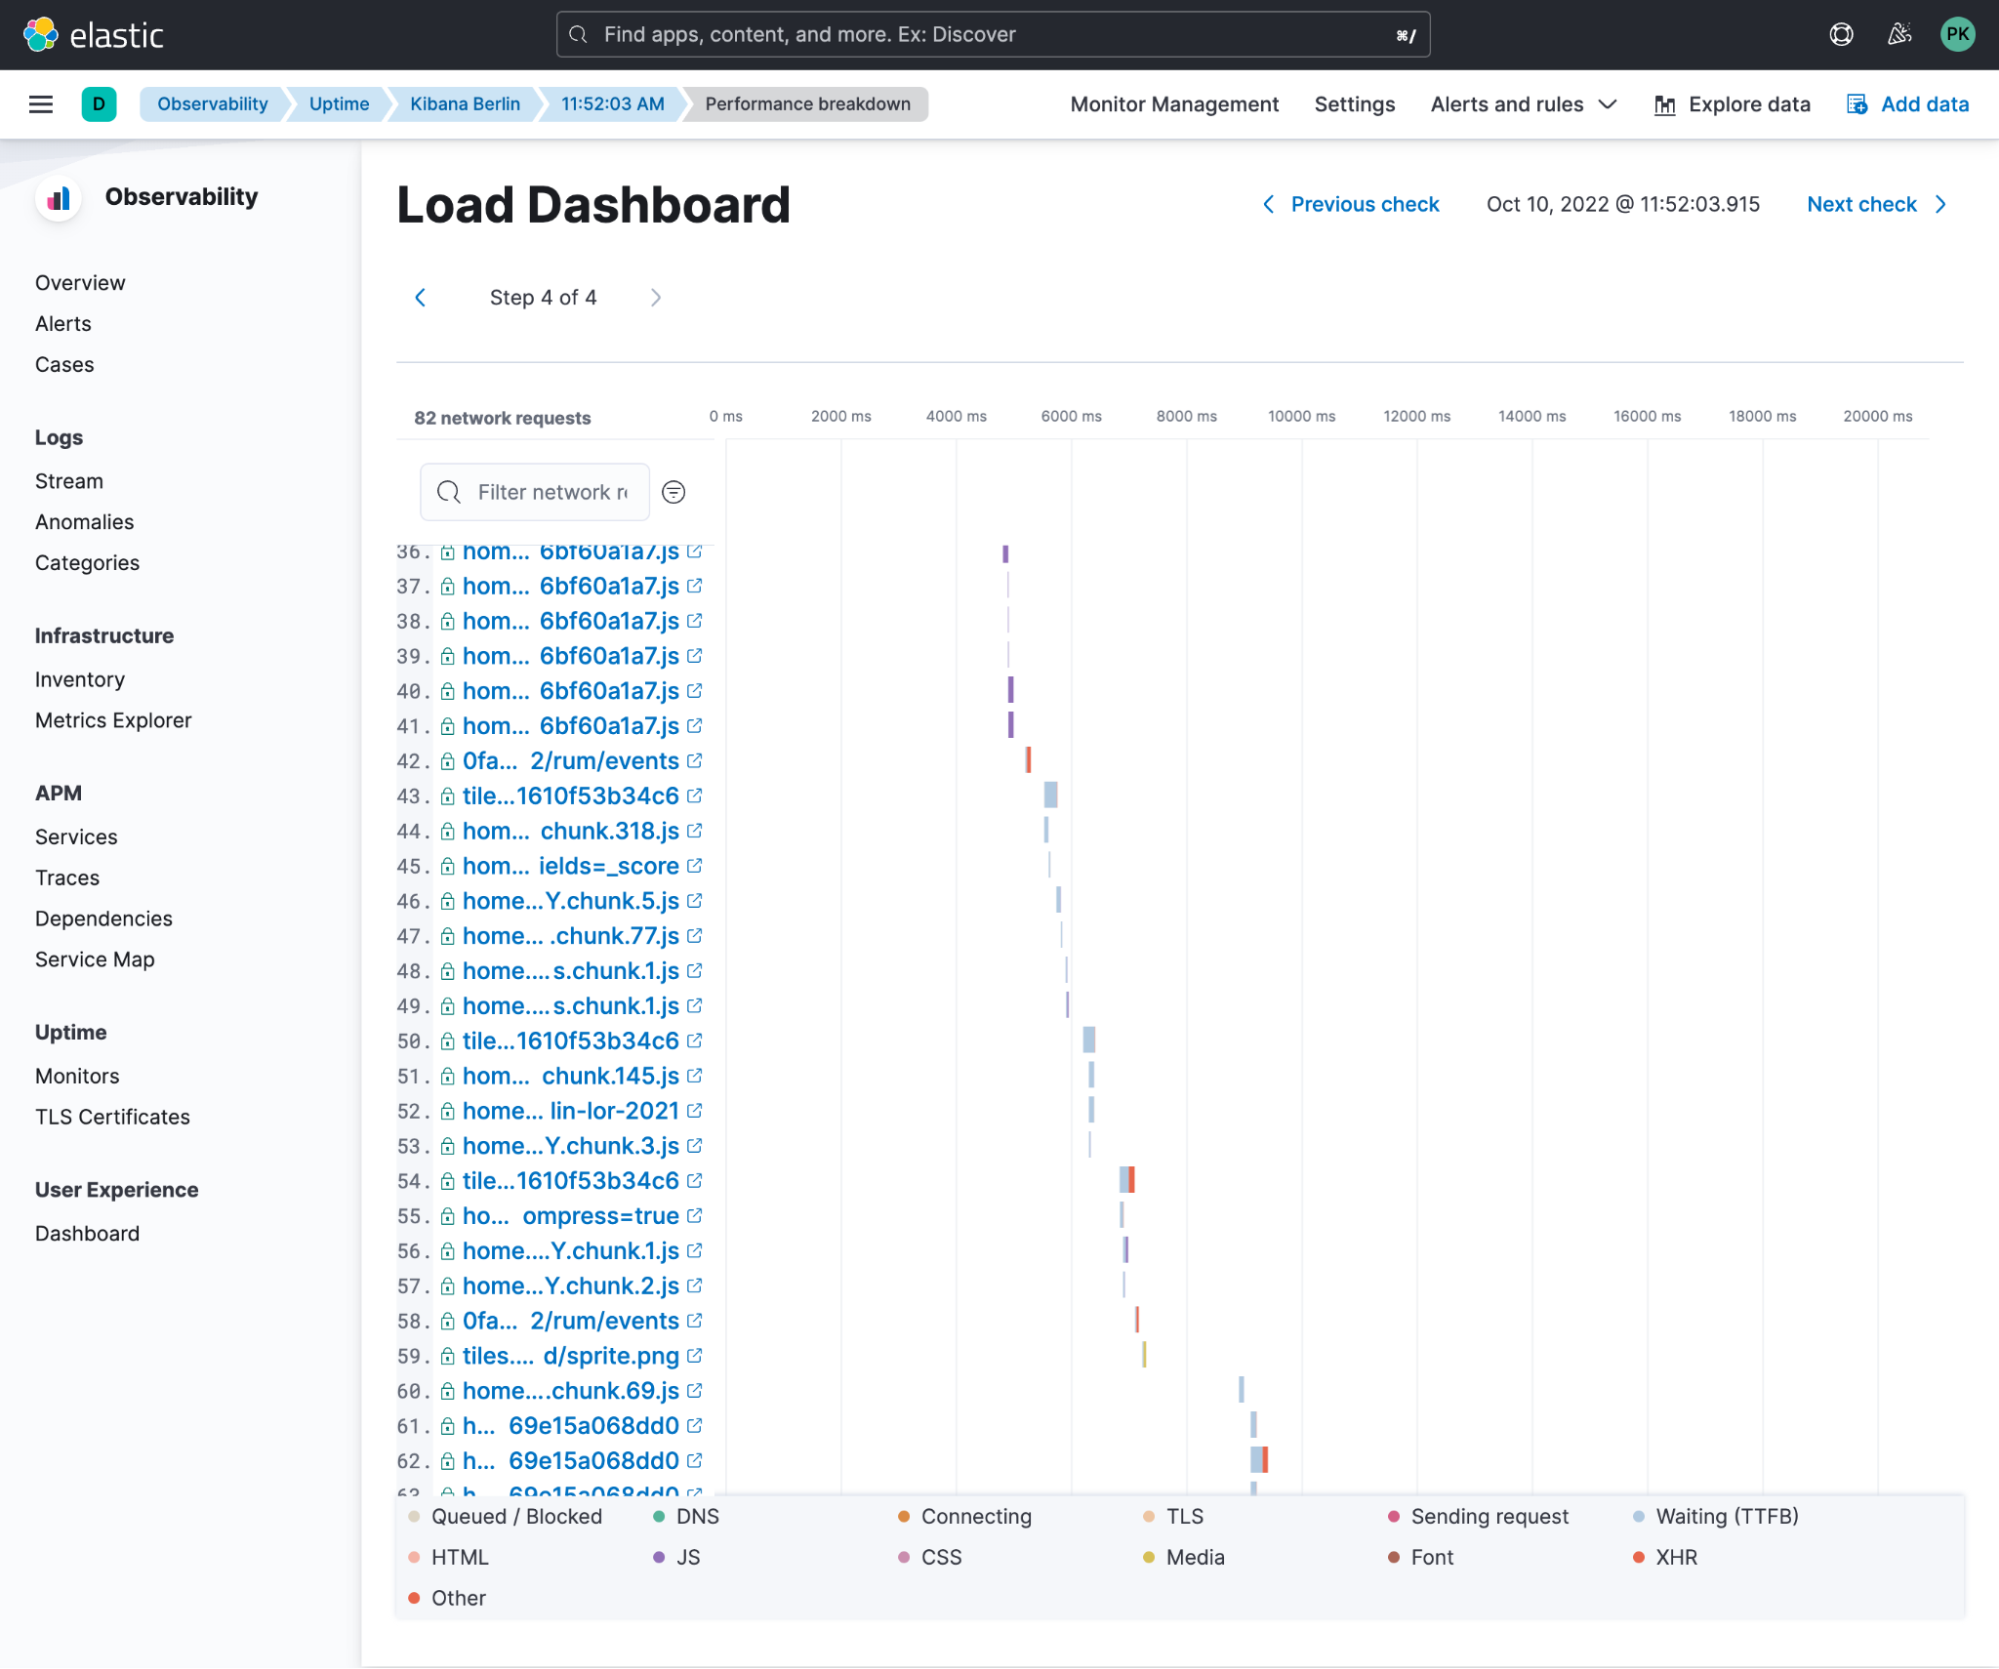
Clicking on view performance breakdown gives you a highly detailed view of everything that happened from the browser's network perspective.
Summary
In this short blog post, I showed how you could use the Elastic Synthetics framework to track different performance metrics. Looking at various dashboard loading times, you can quickly identify if a user's complaint about slow dashboard performance is valid.
Share
- Share on Twitter
Share on Twitter
- Share on LinkedIn
Share on LinkedIn
- Share on Facebook
Share on Facebook
- Share by Email
Share by Email
- Print this page
Print