Putting anomalies into context with custom URLs in Kibana
Machine learning in the Elastic Stack provides you with an intuitive way to detect anomalies in vast data sets. But even the most sophisticated anomaly detection job might not reveal the root cause of anomalous behavior. After an anomaly is detected, you may need to dive into further analysis, review multiple corresponding metrics, and investigate how they relate to the anomalous spike. The Anomaly Explorer and Single Metric Viewer themselves are great at exposing anomalies, but some workflows require more context for analysis. Fortunately, there’s an easy way to add that context.
In this blog, we’ll explore using custom URLs to extend drilldown capabilities and connect your anomalies with other views within and outside of Kibana.
Example: Root cause analysis of a security anomaly
A good candidate to demonstrate how to explore anomalous data is a security use case with data produced by Auditbeat (our Linux audit data shipper). We’re going to use anomaly detection to find unusual processes and users' activity in our system and show how providing additional context via custom URLs assist in root cause analysis.
To follow along with this example, you will need access to an Elastic Stack deployment with machine learning enabled. If you don’t already have that, you can either spin up a free trial of Elastic Cloud, or start a free trial locally.
Linking anomaly records during job configuration
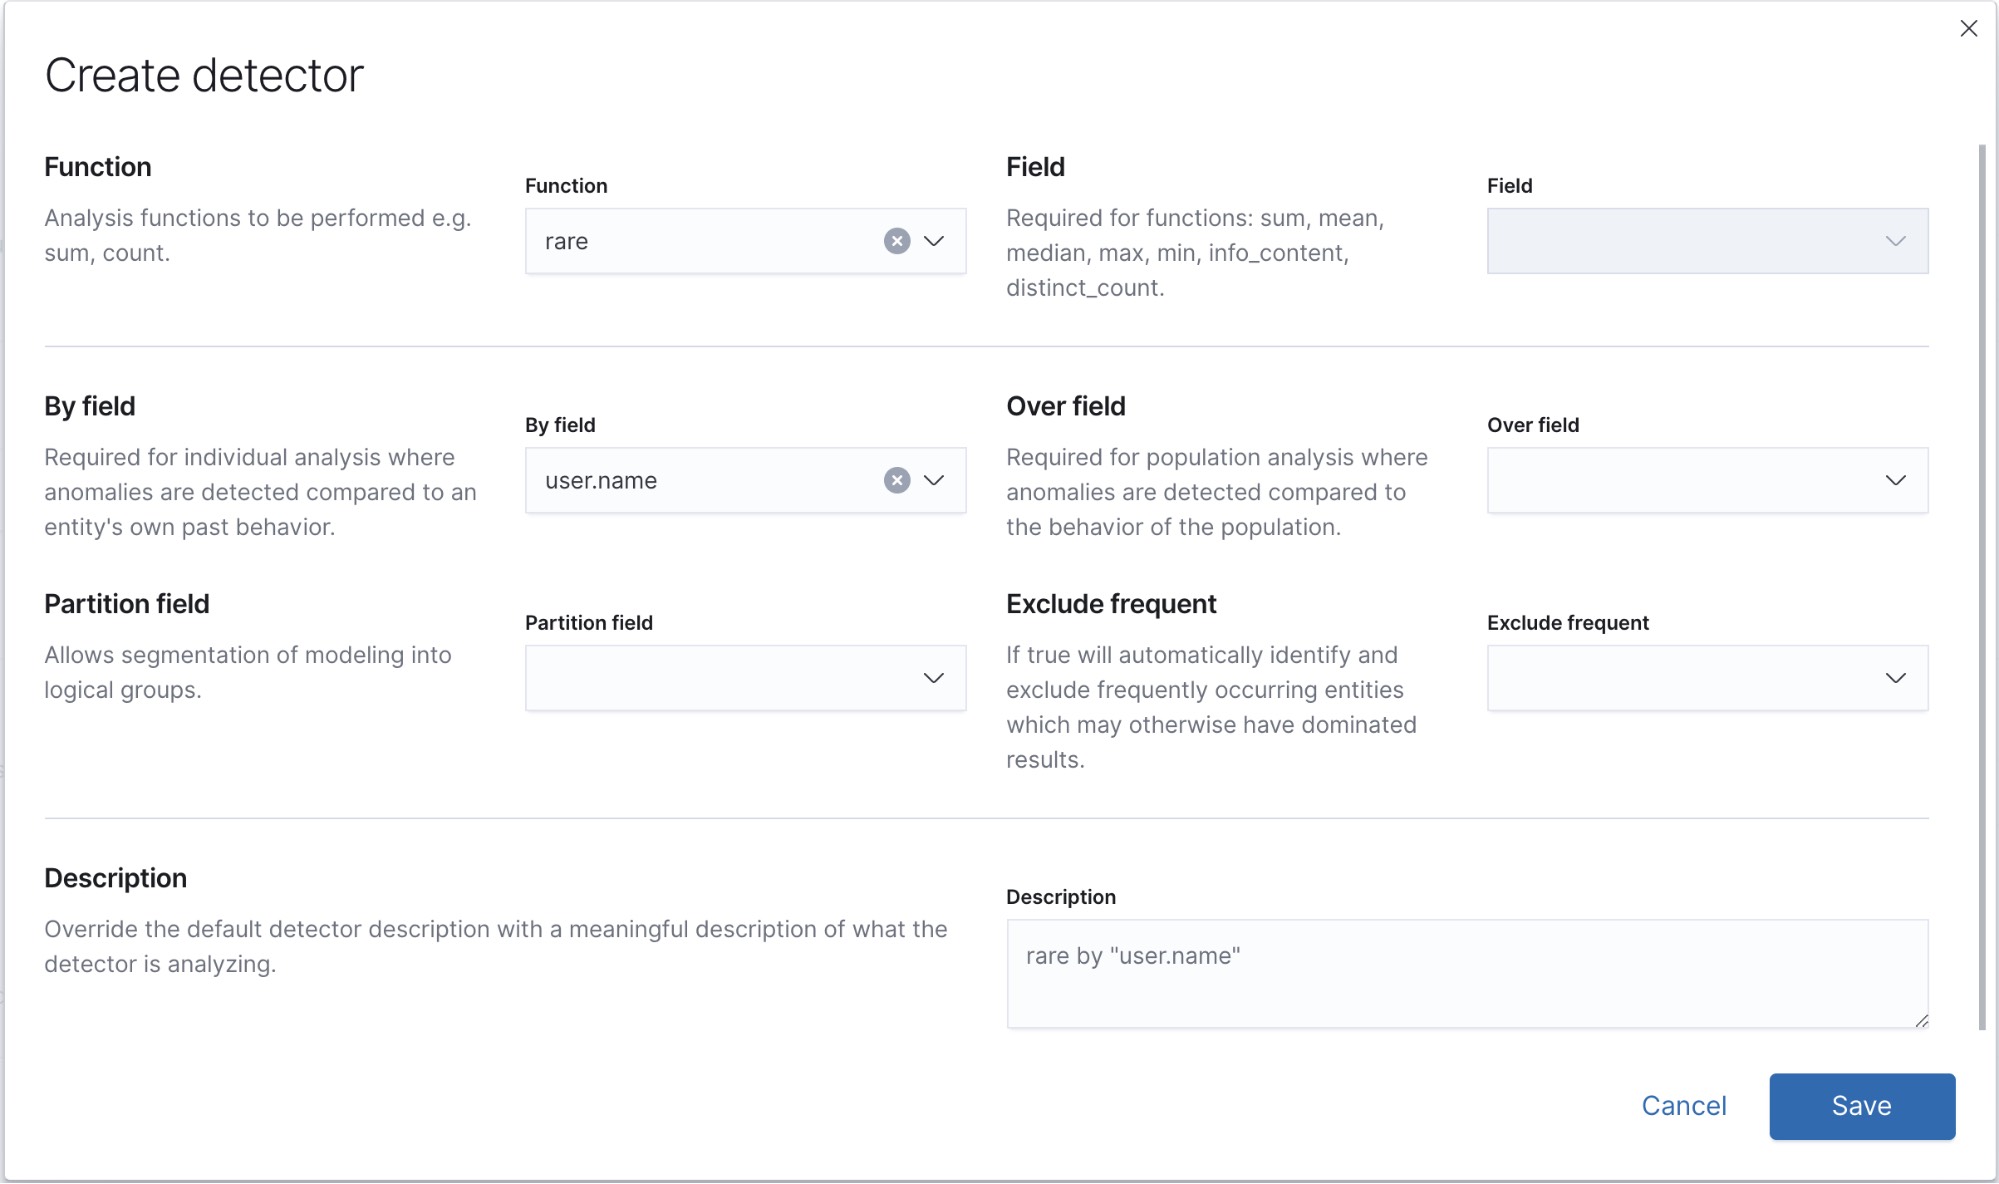
For detecting unusual processes running in our system, we can make use of the rare detector. Let’s get started by navigating in Kibana to Machine Learning > Anomaly Detection > Create Job > Advanced.
The Advanced wizard gives full and precise control over setting up the detectors. The analysis config we’ll use looks like this:
{
    "bucket_span": "15m",
    "detectors": [
      {
        "detector_description": "rare by \"user.name\"",
        "function": "rare",
        "by_field_name": "user.name"
      }
    ],
    "influencers": [
      "host.name",
      "process.name",
      "user.name"
    ]
  }
We need to focus on the Additional settings section. Here you can configure links — custom URLs — to any of your existing dashboards. In this case, we will add a link to the Security dashboard that was installed during the Auditbeat setup. If you've partitioned the analysis (in this case, using a "by field" and multiple influencers), you can use those fields as filters in the dashboard. Here we select host.name so that we can explore the events from the specific host for which the job has raised an anomaly.
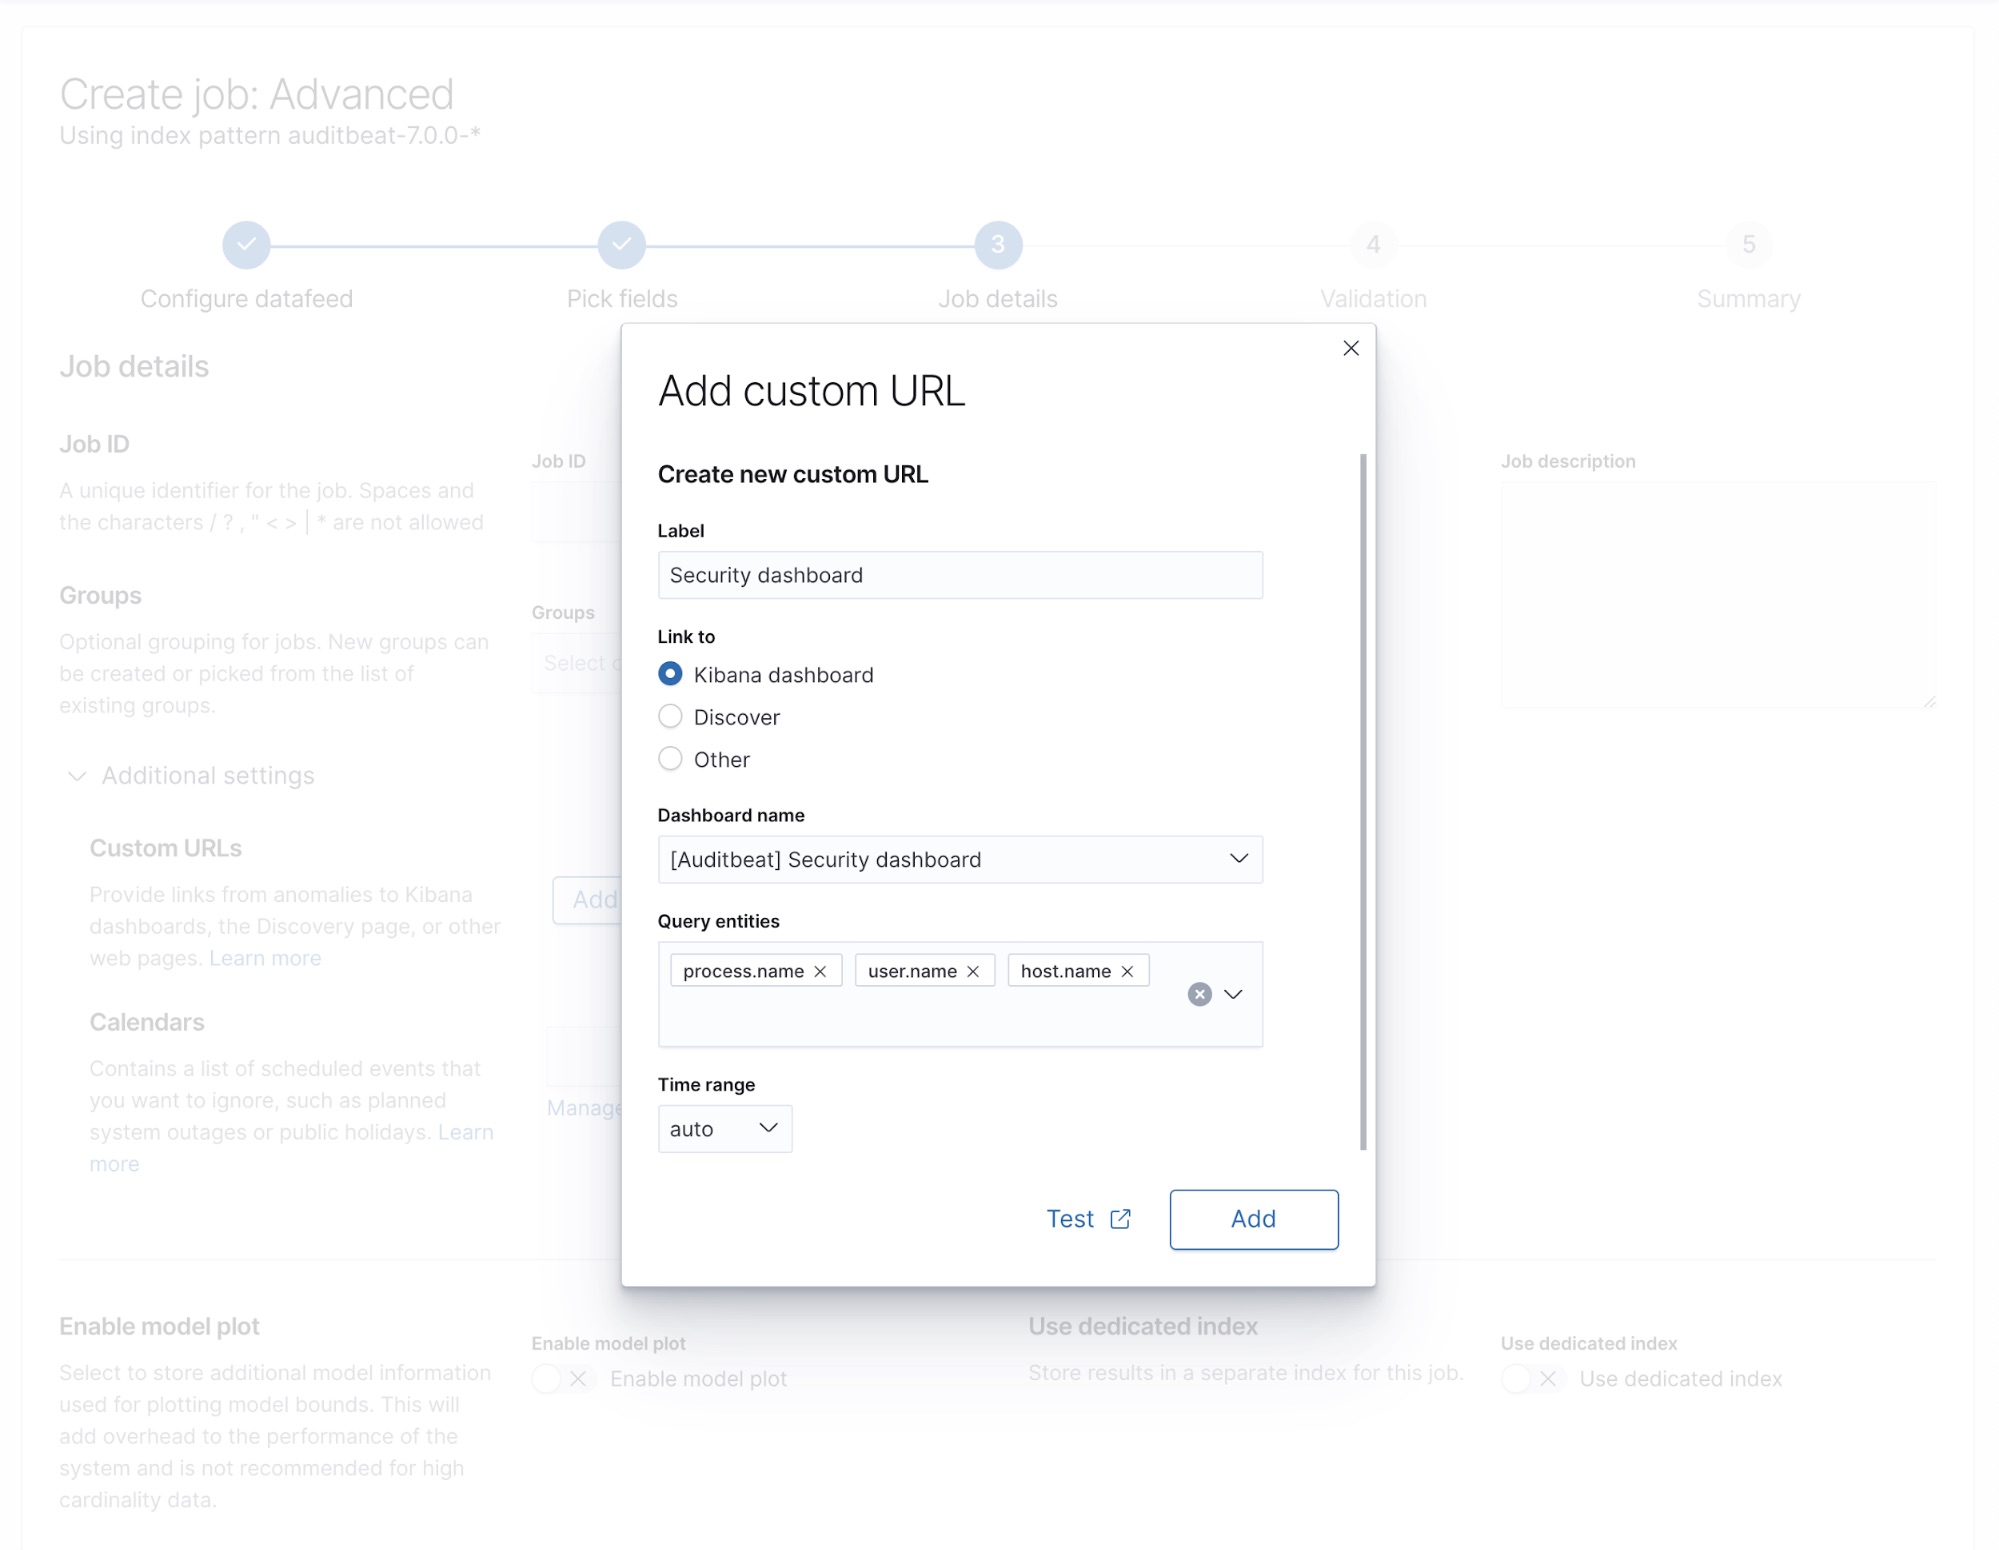
Based on your selection the resulting dashboard URL will be populated with values from a particular anomaly record. In this example, the host name and time of the anomaly will be used to construct the URL in the format:
kibana#/dashboard/dfbb49f0-0a0f-11e7-8a62-2d05eaaac5cb-ecs?_a=(filters:!(),query:(language:kuery,query:'host.name.keyword:"$host.name.keyword$"'))&_g=(filters:!(),time:(from:'$earliest$',mode:absolute,to:'$latest$'))
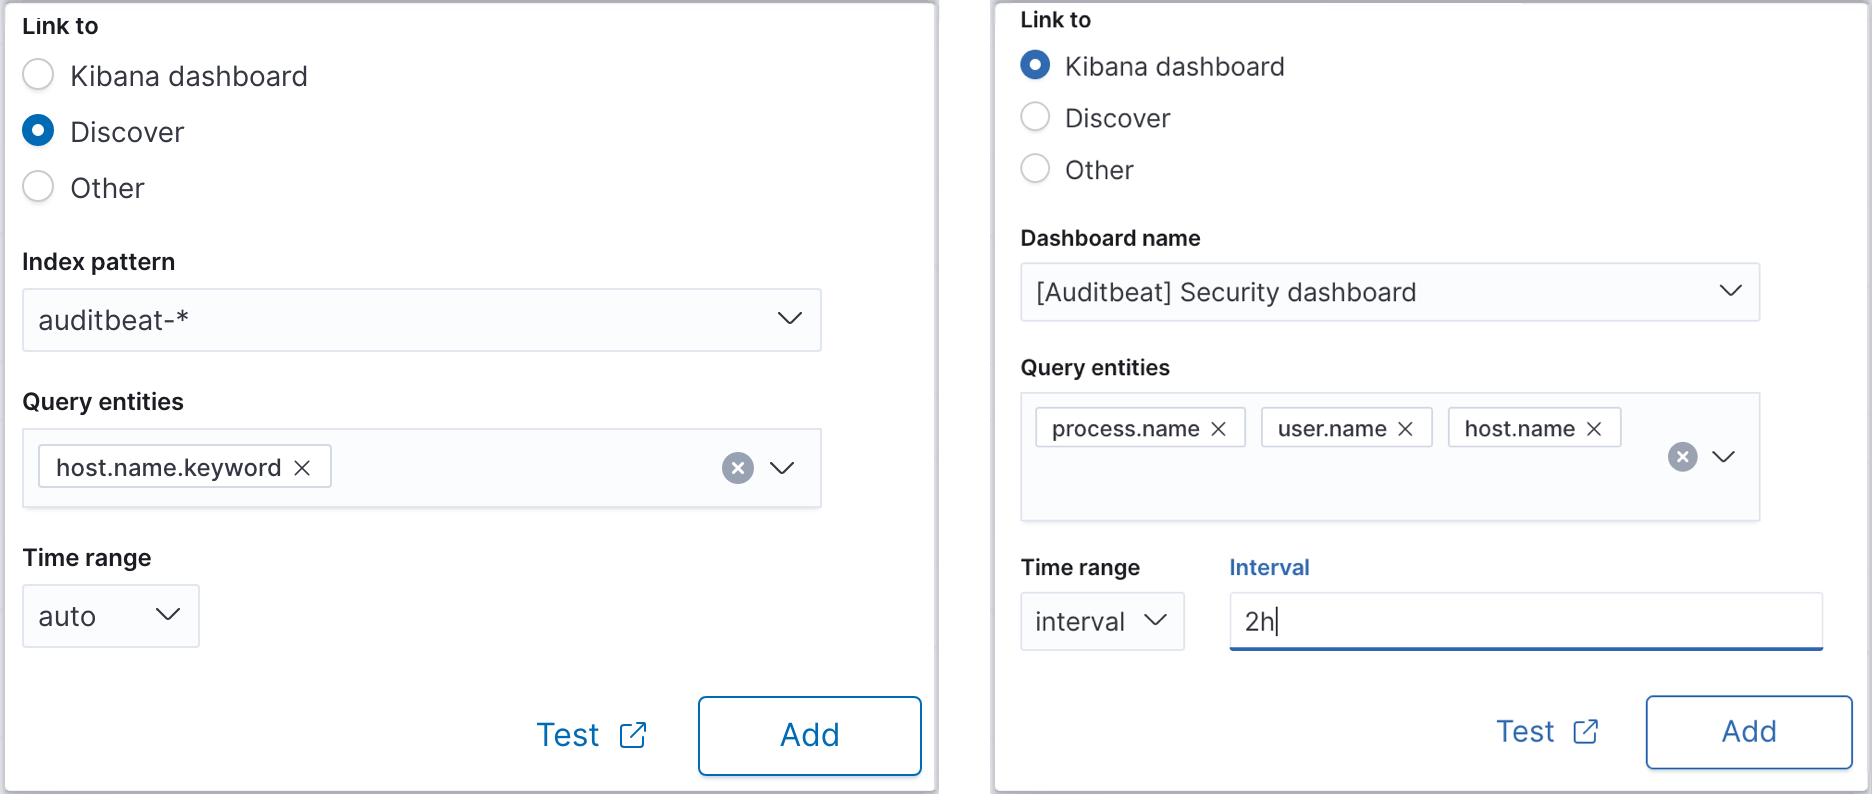
In addition, you could add a custom URL that links to the Kibana Discover page to explore the documents from the source index analyzed in the job, prepopulated with the entities that contributed to the anomaly.
The wizard makes creation of Kibana URLs straightforward — you just need to select entities and a time range to filter the target dashboard. For the time range, the auto option is selected by default and sets the time boundaries according to the interval at which the anomaly records are being viewed in the job results page. You can also configure a fixed interval (e.g. 2h)either side of the anomaly.
Linking to external URLs
As well as linking to Kibana dashboards and Discover, you can also use the ‘Other’ option to configure URLs to link to external sites to provide the user with further context on what is happening in their system around the time of an anomaly. When it comes to external URLs, you need to be aware of the special variables to retrieve time bounds and using the dollar sign ($) delimited tokens that are substituted for the values of the corresponding fields in the anomaly records.
For example, you might have some other data visualization tools in your tech stack, such as Grafana. To point your anomalous data to the Grafana dashboard, create a URL with predefined grafana url variables. For instance, for from and to URL query params you should use $earliest$ and $latest$ tokens to define the time range. Also, all the entities you selected during the job configuration (i.e. influencers and partition fields) are available with token notation, e.g. $process.name$. Eventually, it’s going to look similar to this example:
https://my-grafana-instance?from=$earliest$&to=$latest$&var-process=$process.name$
You can always revisit and test your custom URL templates for any anomaly detection job.
Viewing the anomaly records and navigating with actions
If you are new to Elastic machine learning, our Machine Learning Anomaly Scoring and Elasticsearch - How it Works blog post is a good starting point to get an understanding of how anomaly scoring works. In addition, we encourage you to refer to the official docs for viewing anomaly detection results. Anomalies do not only contain scores, but can also include influencers and multi-bucket scoring. The Anomaly Explorer provides a clear indication of when the anomaly took place, what influencers affected the end result, and plots each anomaly selected in the Anomaly timeline.
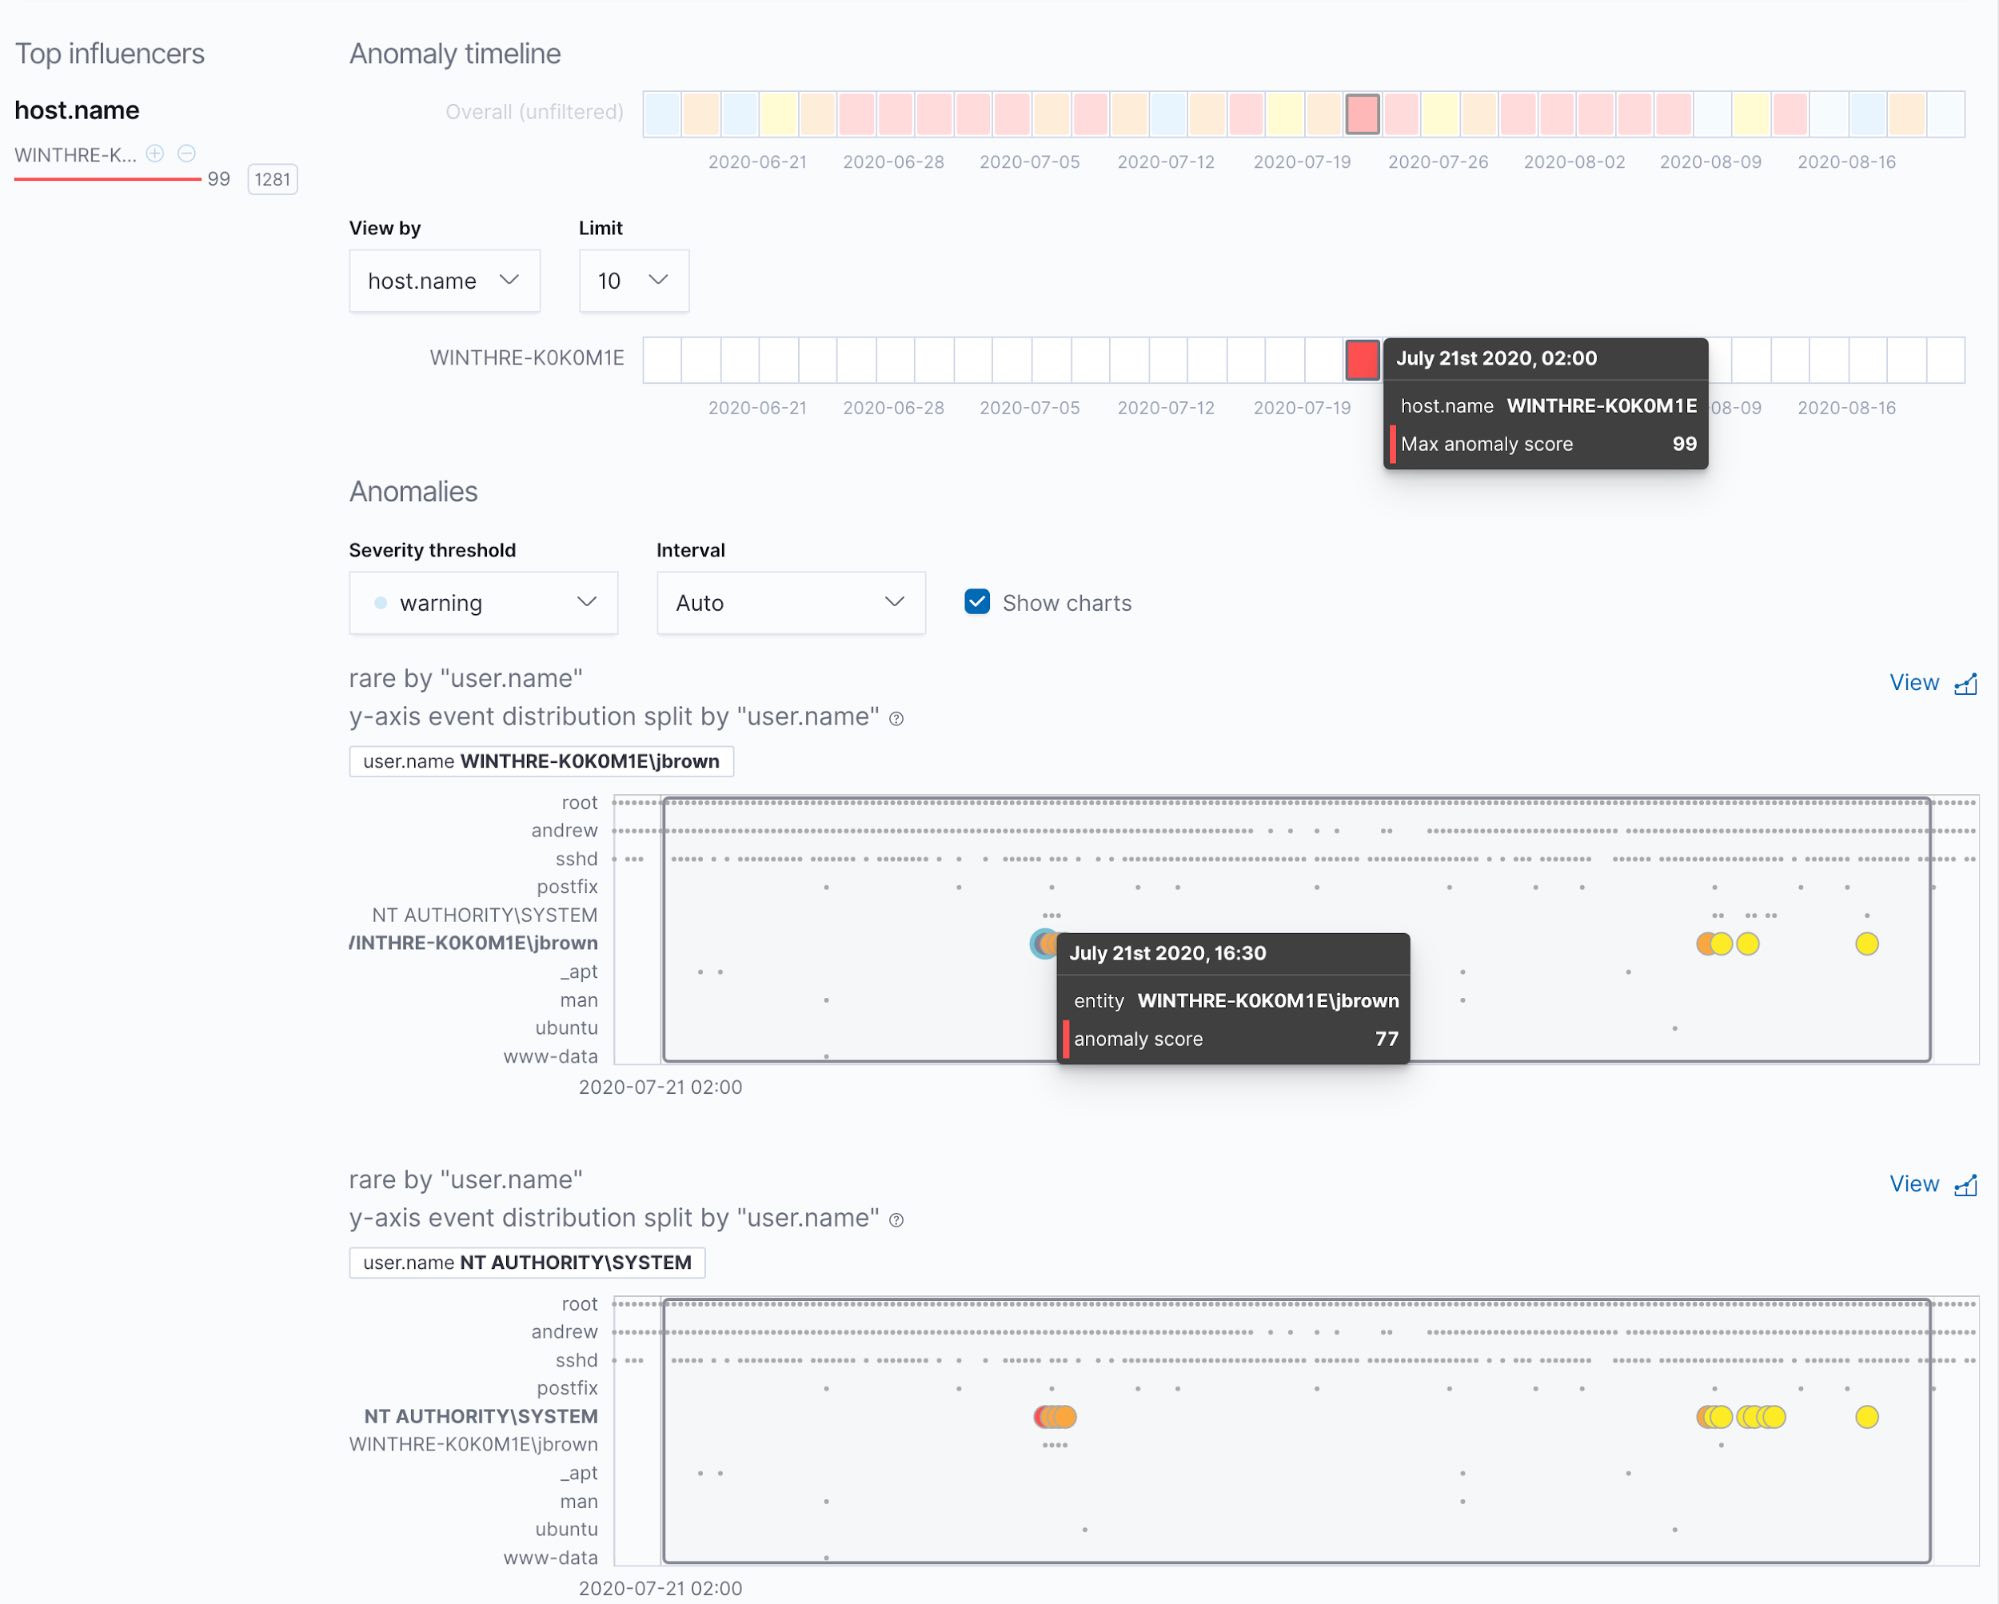
Nevertheless, it’s not always sufficient to observe the individual metric. You might need more context. Here is where the custom URLs we configured in the job wizard come into play.
In the Anomalies table, each record has a set of actions that are extended with the custom URLs configured for this job. By clicking any of those you’ll be redirected to the location you configured with tokens replaced with the corresponding entities’ values.
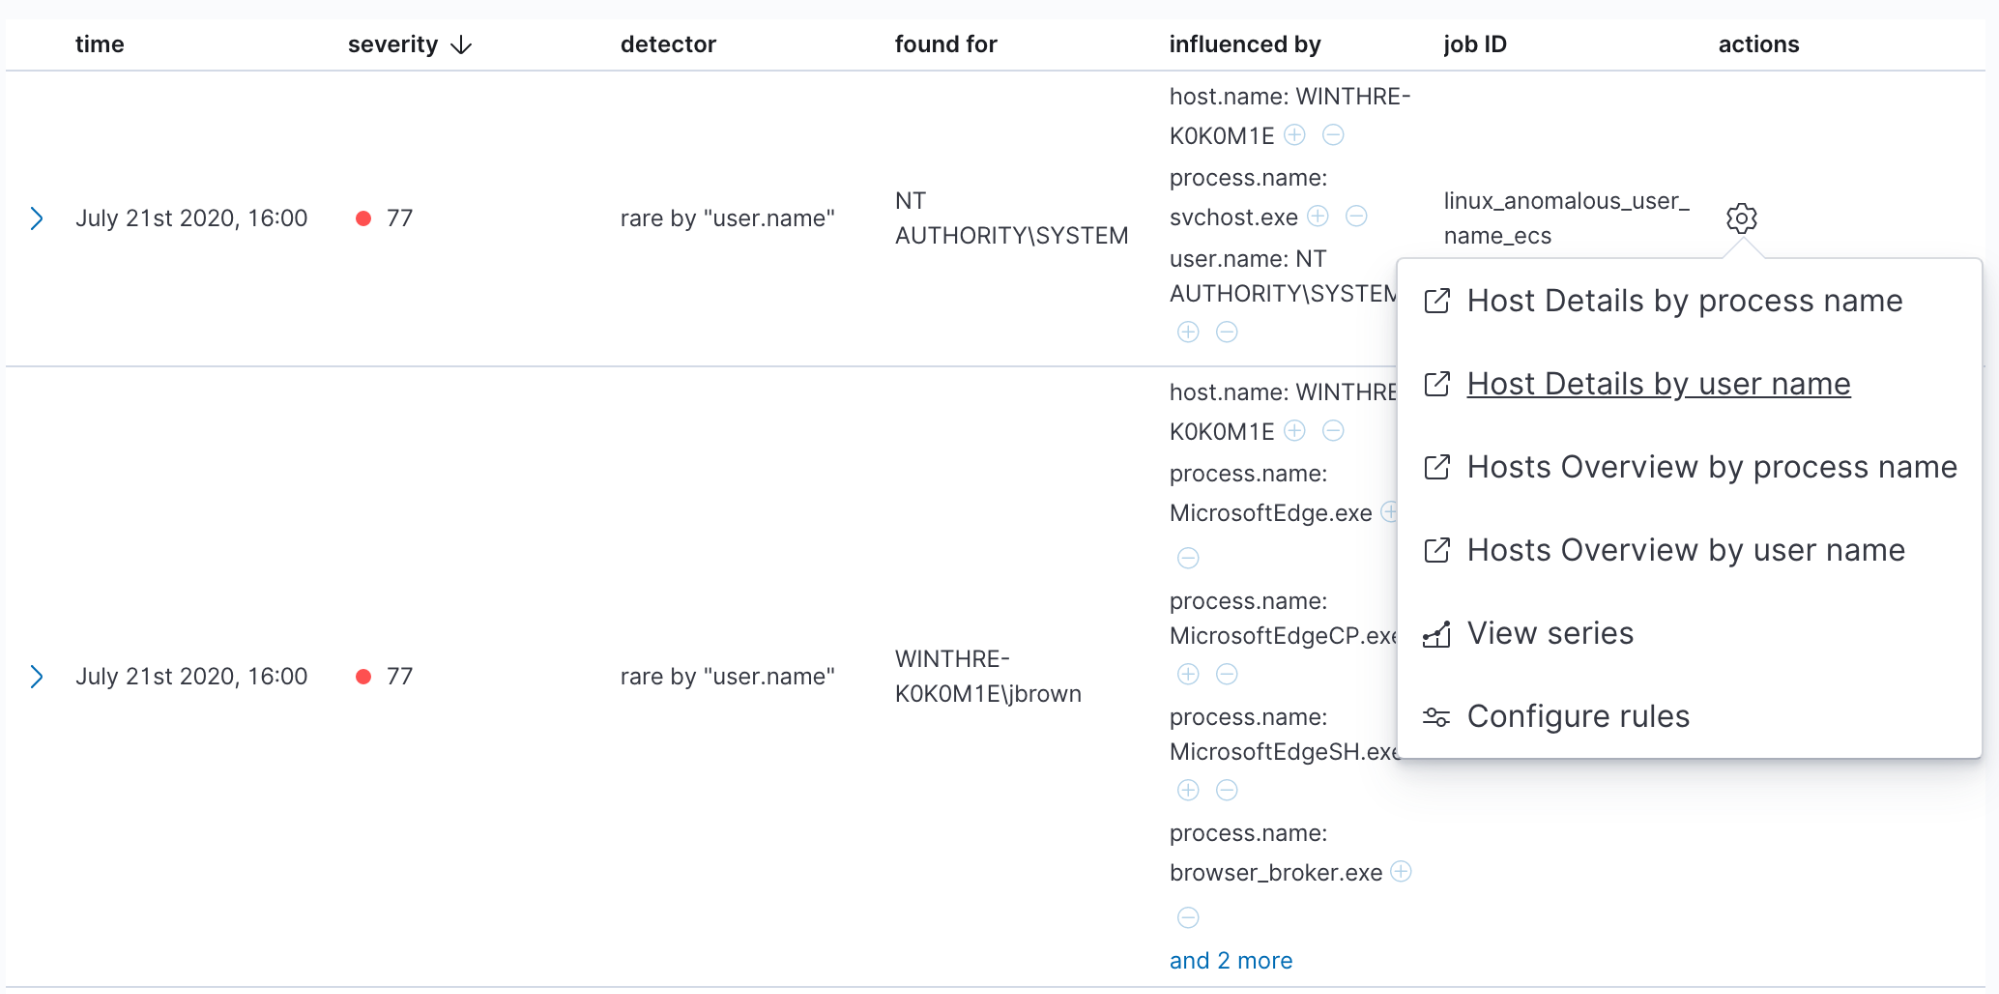
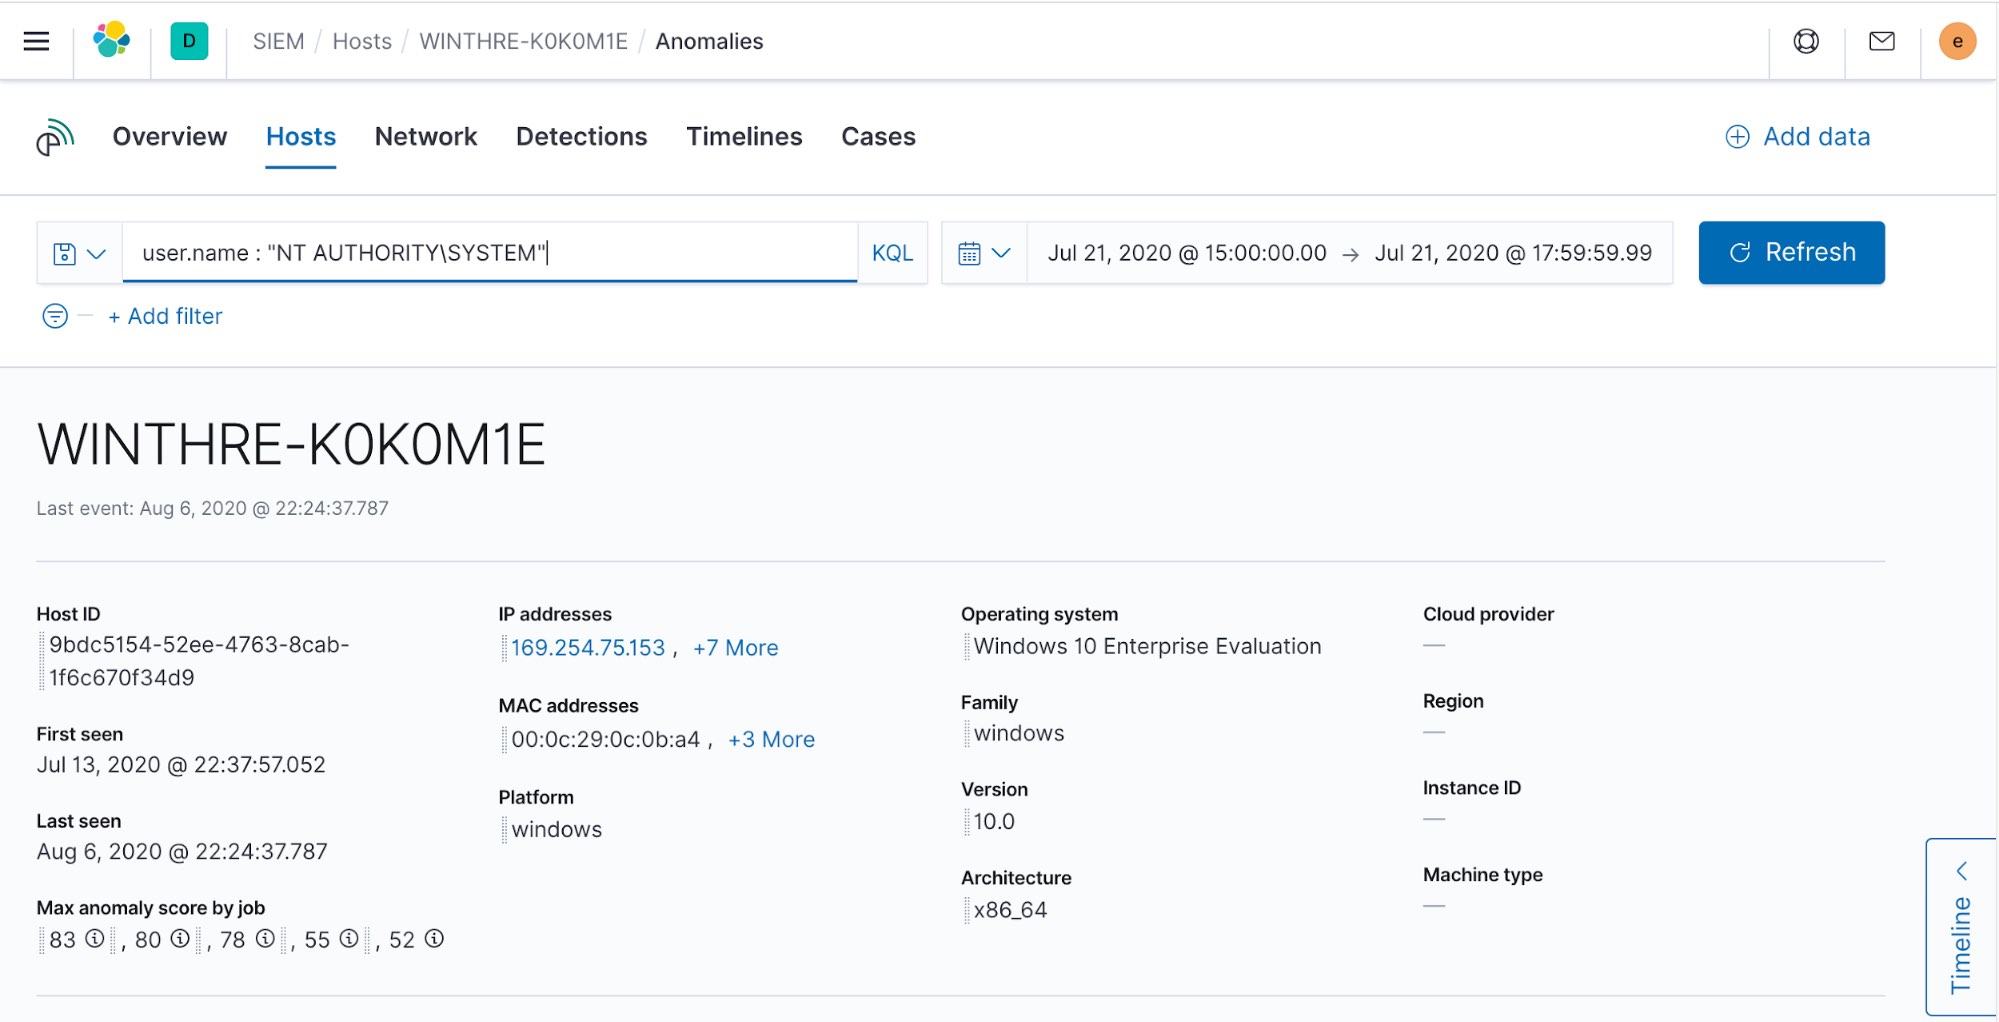
Elastic Stack provides you with a Security solution, which has advanced tooling for this case, such as the investigation timeline, so you might want to jump to the Security host overview directly from the Anomaly Explorer.
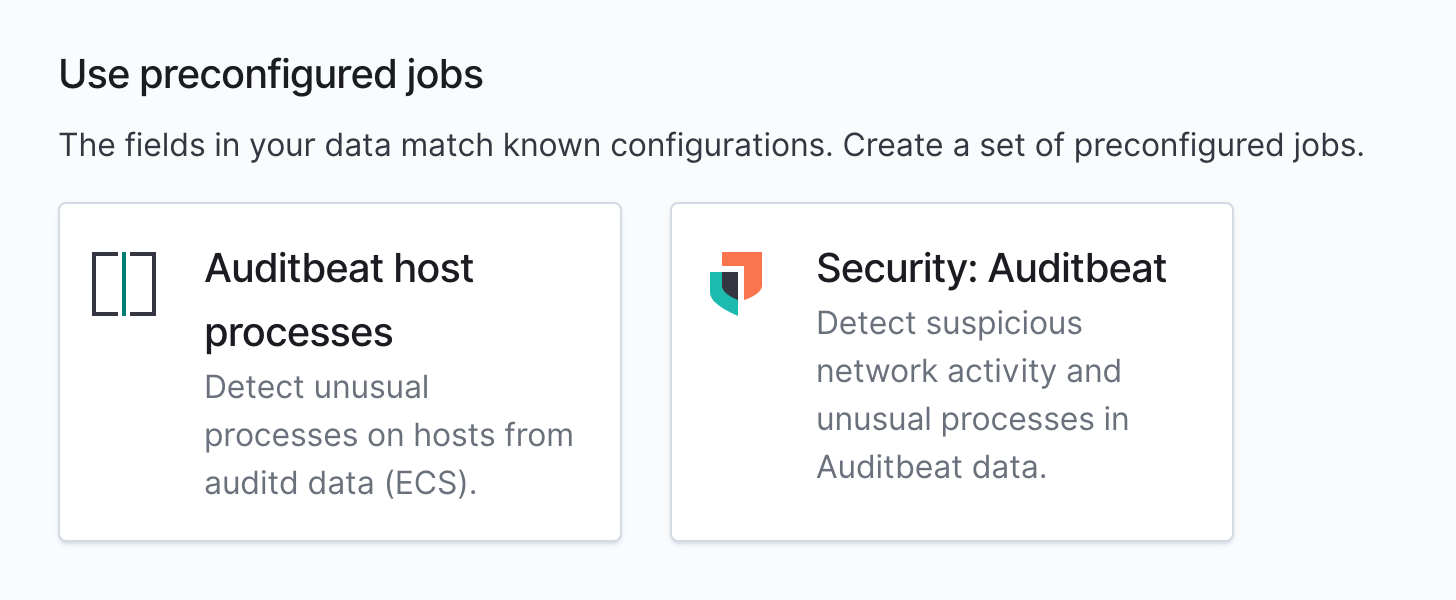
In addition it’s worth mentioning the configuration steps we described above are covered with prebuilt jobs that can be installed from the Security plugin and the machine learning job wizard.
Key takeaway
Custom URLs are a simple yet substantial tool to make your analytics workflow more efficient. It allows you to connect with other solutions within Kibana, such as Elastic Security to examine anomalies, as well as third-party tools.
How would you use custom URLs to streamline your own investigations? Experiment in a free trial of Elastic Cloud today.