Elastic Stack 7.4.0 released
We are excited to announce the general availability of version 7.4 of the Elastic Stack. Debuting in version 7.4 are several new features that simplify cluster administration and operations, introduce new aggregation and machine learning capabilities, and deepen the stack security experience. On the solutions front, Elastic SIEM improves security operations workflows by adding real-time maps for geospatial analytics, and 13 more predefined machine learning jobs for detecting a range of security threats that rules alone could not catch.
Version 7.4 is available right now on our Elasticsearch Service on Elastic Cloud — the only hosted Elasticsearch offering to include these new features. Or you can download the Elastic Stack for a self-managed experience.
The full feature rundown is in the individual blog posts, but here are the release highlights without further ado.
Snapshot lifecycle management — data back up has never been easier
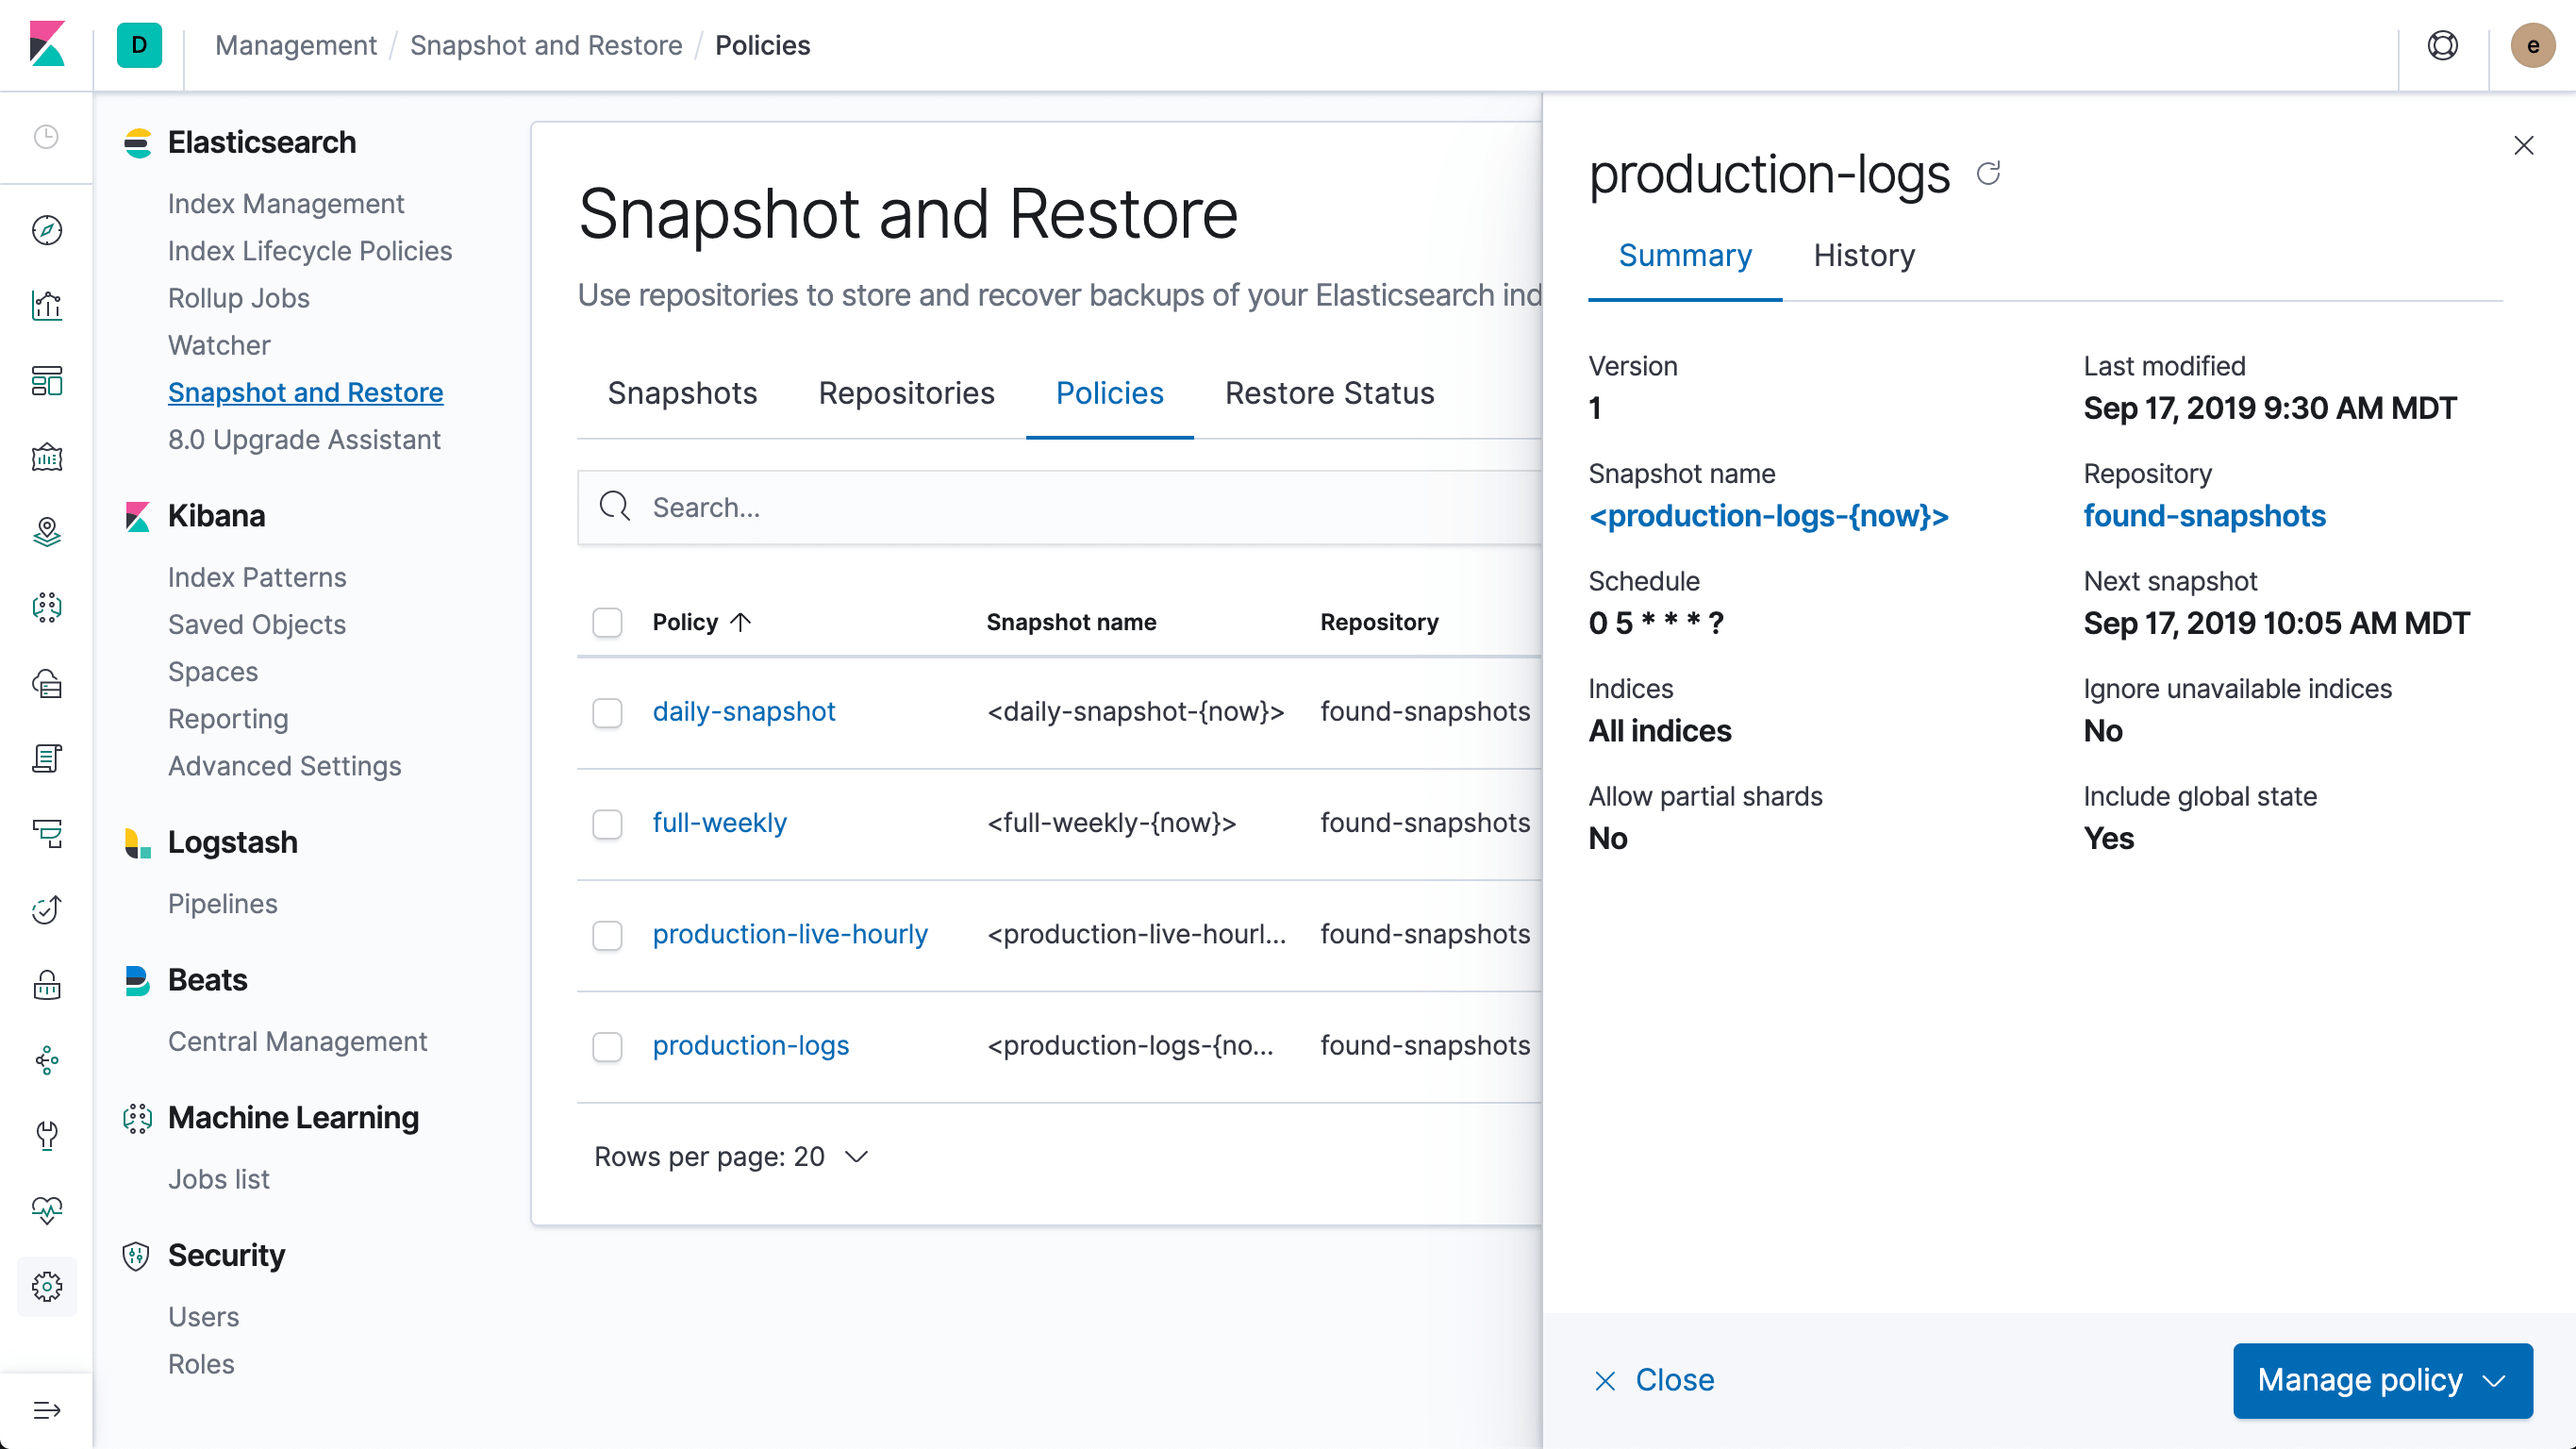
Snapshot / restore is the best way to backup (and restore) data in Elasticsearch and is a critical part of nearly all production deployments. In 7.4, we’re introducing snapshot lifecycle management, which allows an administrator to define policies that manage when and how often snapshots are taken. This ensures that appropriate, recent backups are ready if disaster strikes or the data needs to be restored for other reasons.
Together with the index lifecycle management feature introduced in 6.7, snapshot lifecycle management dramatically simplifies operating a production cluster. By building these as native features of the Elastic Stack, administrators reduce the dependency on external tools and cron jobs, gain reliability and visibility, and can focus on defining the data protection policies that matter to their business. While we always build API-first, we’re also thrilled to include a management UI for snapshot lifecycle management (located within the snapshot and restore interface in Kibana).
Get the full details in the Elasticsearch blog post.
Elastic Maps and Elastic SIEM — A pew pew map designed for analysts
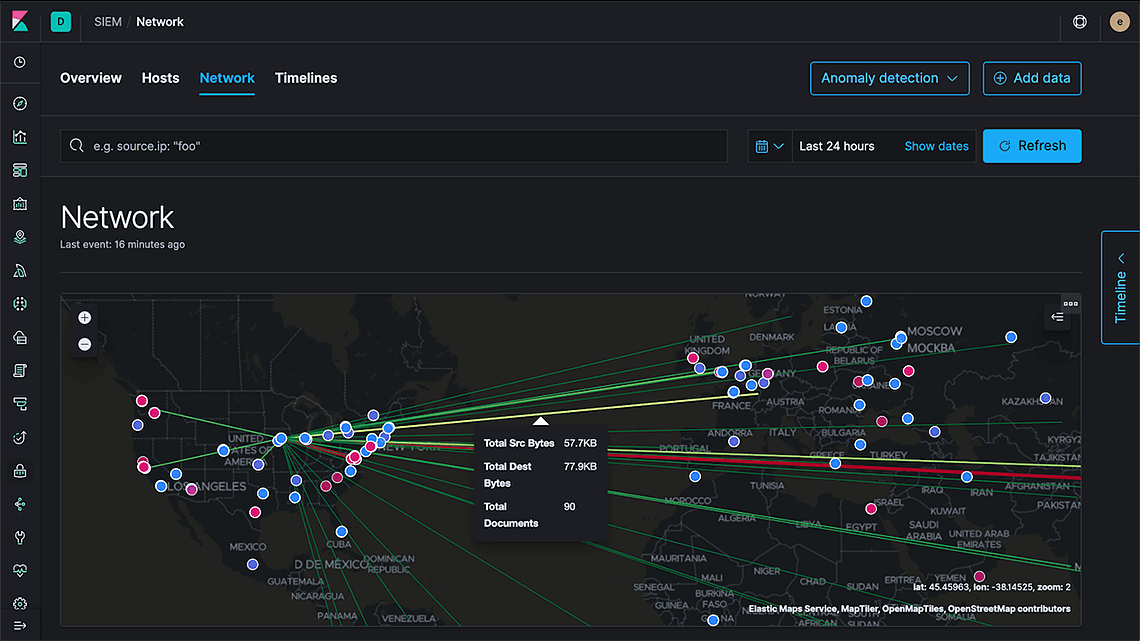
Cyber attack maps, sometimes called pew pew maps (cue the Star Wars sound effects), often live as eye candy for datacenter tours. With the 7.4 release, the SIEM application introduces a pew pew map based on live data, that analysts can search, filter, and explore in real time. While it’s pretty enough to show on tour, this is a tool for security analysts. In Elastic SIEM, location becomes just another attribute to help provide visibility and cyber situational awareness.
"We have been increasing the number of log data sources that we ingest into the Elastic Stack since adopting it. Our security team can now quickly search and visualize all our security-relevant data from within Kibana to enable effective interactive investigations.” said Wieger van der Meulen, IT Security Manager at Leaseweb Global B.V. “In addition, the machine learning capabilities of the Elastic Stack provide us with automated detection of unusual behaviors within our infrastructure. Now with the expanded set of machine learning jobs integrated into version 7.4 of the SIEM app, we’re hoping to enable an even more comprehensive set of anomaly detections. Adopting Elastic SIEM has enabled us to respond much more quickly to incidents and to take the appropriate mitigation actions.”
This feature is built right on top of Elastic Maps, so it takes advantage of our many years of investment in geospatial analytics and search capabilities. Also new in Elastic Maps for 7.4 is the point-to-point line feature, which makes it easy to visualize the connections in your data. By embedding Elastic Maps right into the SIEM application, we're showcasing the new point-to-point feature and will continue to benefit from the constant stream of improvements in Elastic Maps.
Get the full details in the Elastic SIEM blog post.
Machine learning learns new tricks
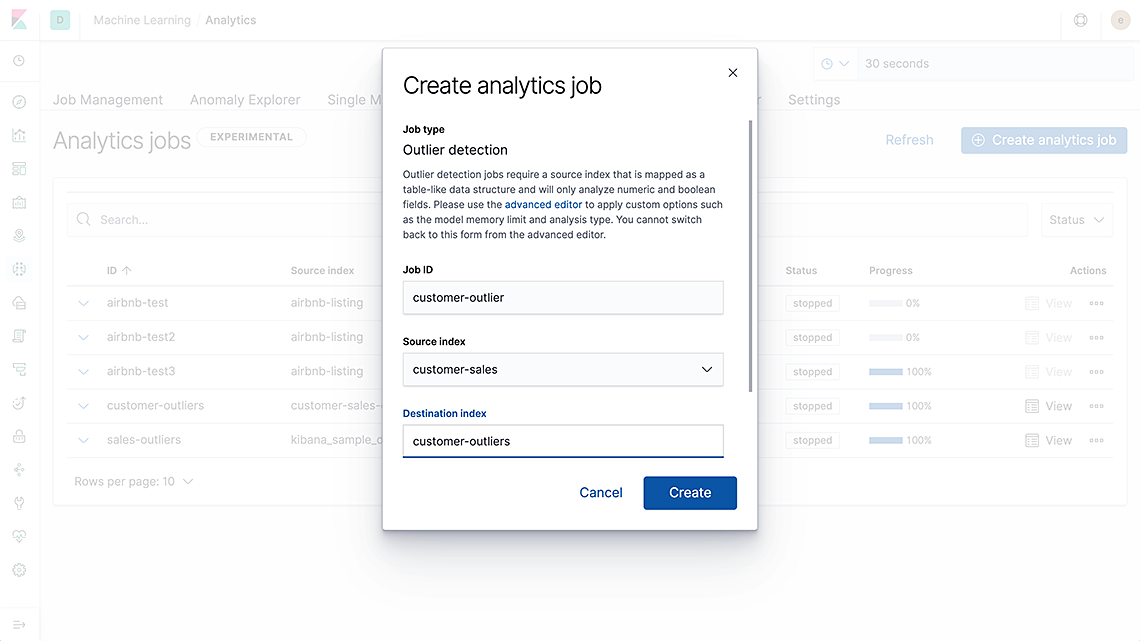
Version 7.3 introduced data transforms to let users pivot their Elasticsearch data into entity centric indices on the fly. This transformative feature (pun intended!) is a foundational block for a suite of new analytics and machine learning methods — such as outlier detection, regression, classification, and more. We are excited to deliver on that vision with the addition of regression analysis APIs and outlier detection UI to machine learning in version 7.4.
We have added a new Analytics tab in the Machine Learning app in Kibana to create, manage, and view your outlier detection jobs.
“Elastic’s machine learning is critical to my team because it is a force multiplier that allows us to cover exponentially more data than we could in the past,” said Jonathon Robinson, Fraud Intelligence Manager at PSCU. “We were able to use machine learning to identify fraud activity right away. We saw significant savings within a couple of weeks and last month alone we saved millions of direct dollars for our credit unions.”
In addition to these two new methods, we are also introducing several (13 to be precise) new out-of-the-box machine learning jobs to Elastic SIEM to detect common security threats on network and host activity data collected by Auditbeat. Examples include detecting anomalous processes, anomalous network port activity, and more.
Get the full details in the Elasticsearch blog post.
Increased depth in each pillar of observability
With 7.4 we’ve doubled down on auto-instrumentation in Elastic APM, expanding APM agents to support the plug-and-play experience for more common programming frameworks. Most notably, these additions include Angular support in the RUM agent and .NET framework support in the .NET agent, which are both very common in existing enterprise applications. In addition, we built on the RUM geolocation data we introduced in the previous release by adding a new "performance by geographic region" breakdown in the APM UI, allowing users to zero in on region-specific problems and troubleshoot them faster. Finally, structured filters in the Elastic APM UI help analysts search trace data even faster, resulting in shorter resolution cycles. Jump over to the Elastic APM release blog for more details.
Every Elastic Stack release brings new ways to automatically monitor the health of your critical infrastructure and services. The 7.4 release adds support for ingesting metrics from several more AWS services, including Elastic Load Balancer (ELB), Elastic Block Storage (EBS), and CloudWatch Statistics, plus the ability to read server logs right from Amazon Simple Storage Service (S3). It also increased Kubernetes monitoring capabilities with additional metrics for scheduled jobs, and added a new StatsD module for collecting custom metrics using this common format. Database monitoring got a boost with many new metricsets and improved default dashboards for datastores like Oracle, Prometheus, and Postgres. Finally, we added log analysis for IBM MQ, a critical messaging platform in many important enterprise applications. Jump over to the Elastic Infrastructure and Elastic Logs release blog for more details.
PKI Authentication in Kibana
The Kibana security model continues to evolve and offer new ways to securely access Kibana. Following incredible releases like feature controls in 7.2 and support for Kerberos in 7.3, we are excited to announce support for another highly requested authentication mechanism. With 7.4, Public Key Infrastructure (PKI) authentication is now officially supported. This type of encryption is heavily used by our community in sectors like finance, healthcare, government, and military.
While it was possible to use PKI authentication with Kibana behind a proxy in the past, those architectures can be simplified in 7.4. With native support for PKI authentication, users are now able to log into Kibana using X.509 client certificates and a two way encryption system. This opens the door to a variety of new and secure ways to access Kibana. From general client certificate authorization to physical smart or identity card access, Kibana has you covered. Want to learn more? Check out our documentation on how to get started.