Elastic vs. ClickHouse: Solving incidents fast beats writing SQL
SREs need to solve issues in minutes, not waste time building a DIY observability project. ClickHouse is a database. It's a component.
Elastic is a complete AI-powered observability platform. It's the answer, like you would expect an observability solution to be.

A complete observability solution is non‑negotiable
Elastic Observability helps you find answers faster. ClickHouse doesn't.
Focus on reliability, not pipelines
![]() Elastic Observability:
Elastic Observability:
Ship any data, in any format, including OpenTelemetry, and let our AI-powered automated pipelines instantly parse and structure it all. No custom parsers, no schema headaches.
![]() ClickHouse:
ClickHouse:
It's a DIY nightmare of rigid schemas, brittle ingestion pipelines, manual log parsing, and custom ETL.
Get answers in minutes, not query chaos
![]() Elastic Observability:
Elastic Observability:
Go from SLO alert to answer in minutes. Our agentic AI surfaces the likely root cause as the starting point for your investigation, complete with the unified context of your infrastructure and application health.
![]() ClickHouse:
ClickHouse:
With no automated RCA, retrieval augmented generation (RAG)-based AI assistant, or unified context, you're left to manually pivot through raw data as the outage mounts.
Prevent issues, cut the noise
![]() Elastic Observability:
Elastic Observability:
Save your team from hunting through noisy alerts using powerful machine learning (ML) to automatically detect anomalies across the entire user-journey, letting you fix what matters, faster.
![]() ClickHouse:
ClickHouse:
With no built-in ML, get ready for noisy, manual thresholds that only catch problems you already knew about.
Optimize AI apps, stop hallucinating
![]() Elastic Observability:
Elastic Observability:
Understand every LLM call from prompts, interventions, and contextual grounding, including tokens, cost, and latency all in one unified view. Debug AI issues in minutes, not days.
![]() ClickHouse:
ClickHouse:
Zero LLM observability means zero visibility into your AI stack.
Powered by agentic AI
In Elastic, an extensive set of built-in agentic tools and workflows organize and structure your data, surface significant events, and guide investigations.


Easy, open, complete — no operational overhead or maintenance
With ClickHouse, it's hard to see the full picture. Elastic brings it all together in a full-stack solution that's open and extensible by design.
Elastic
ClickHouse
Single unified solution
No single unified solution
Separate products with disconnected interfaces (HyperDX and ClickHouse)
Integrations
450+ integrations
Integrations
Limited number of OOTB observability integrations
Prebuilt dashboards
No prebuilt dashboards
Log streams
No log streams
Automatic import
No automatic import
Top 3 OTel contributor
Not even in the top 50 contributors
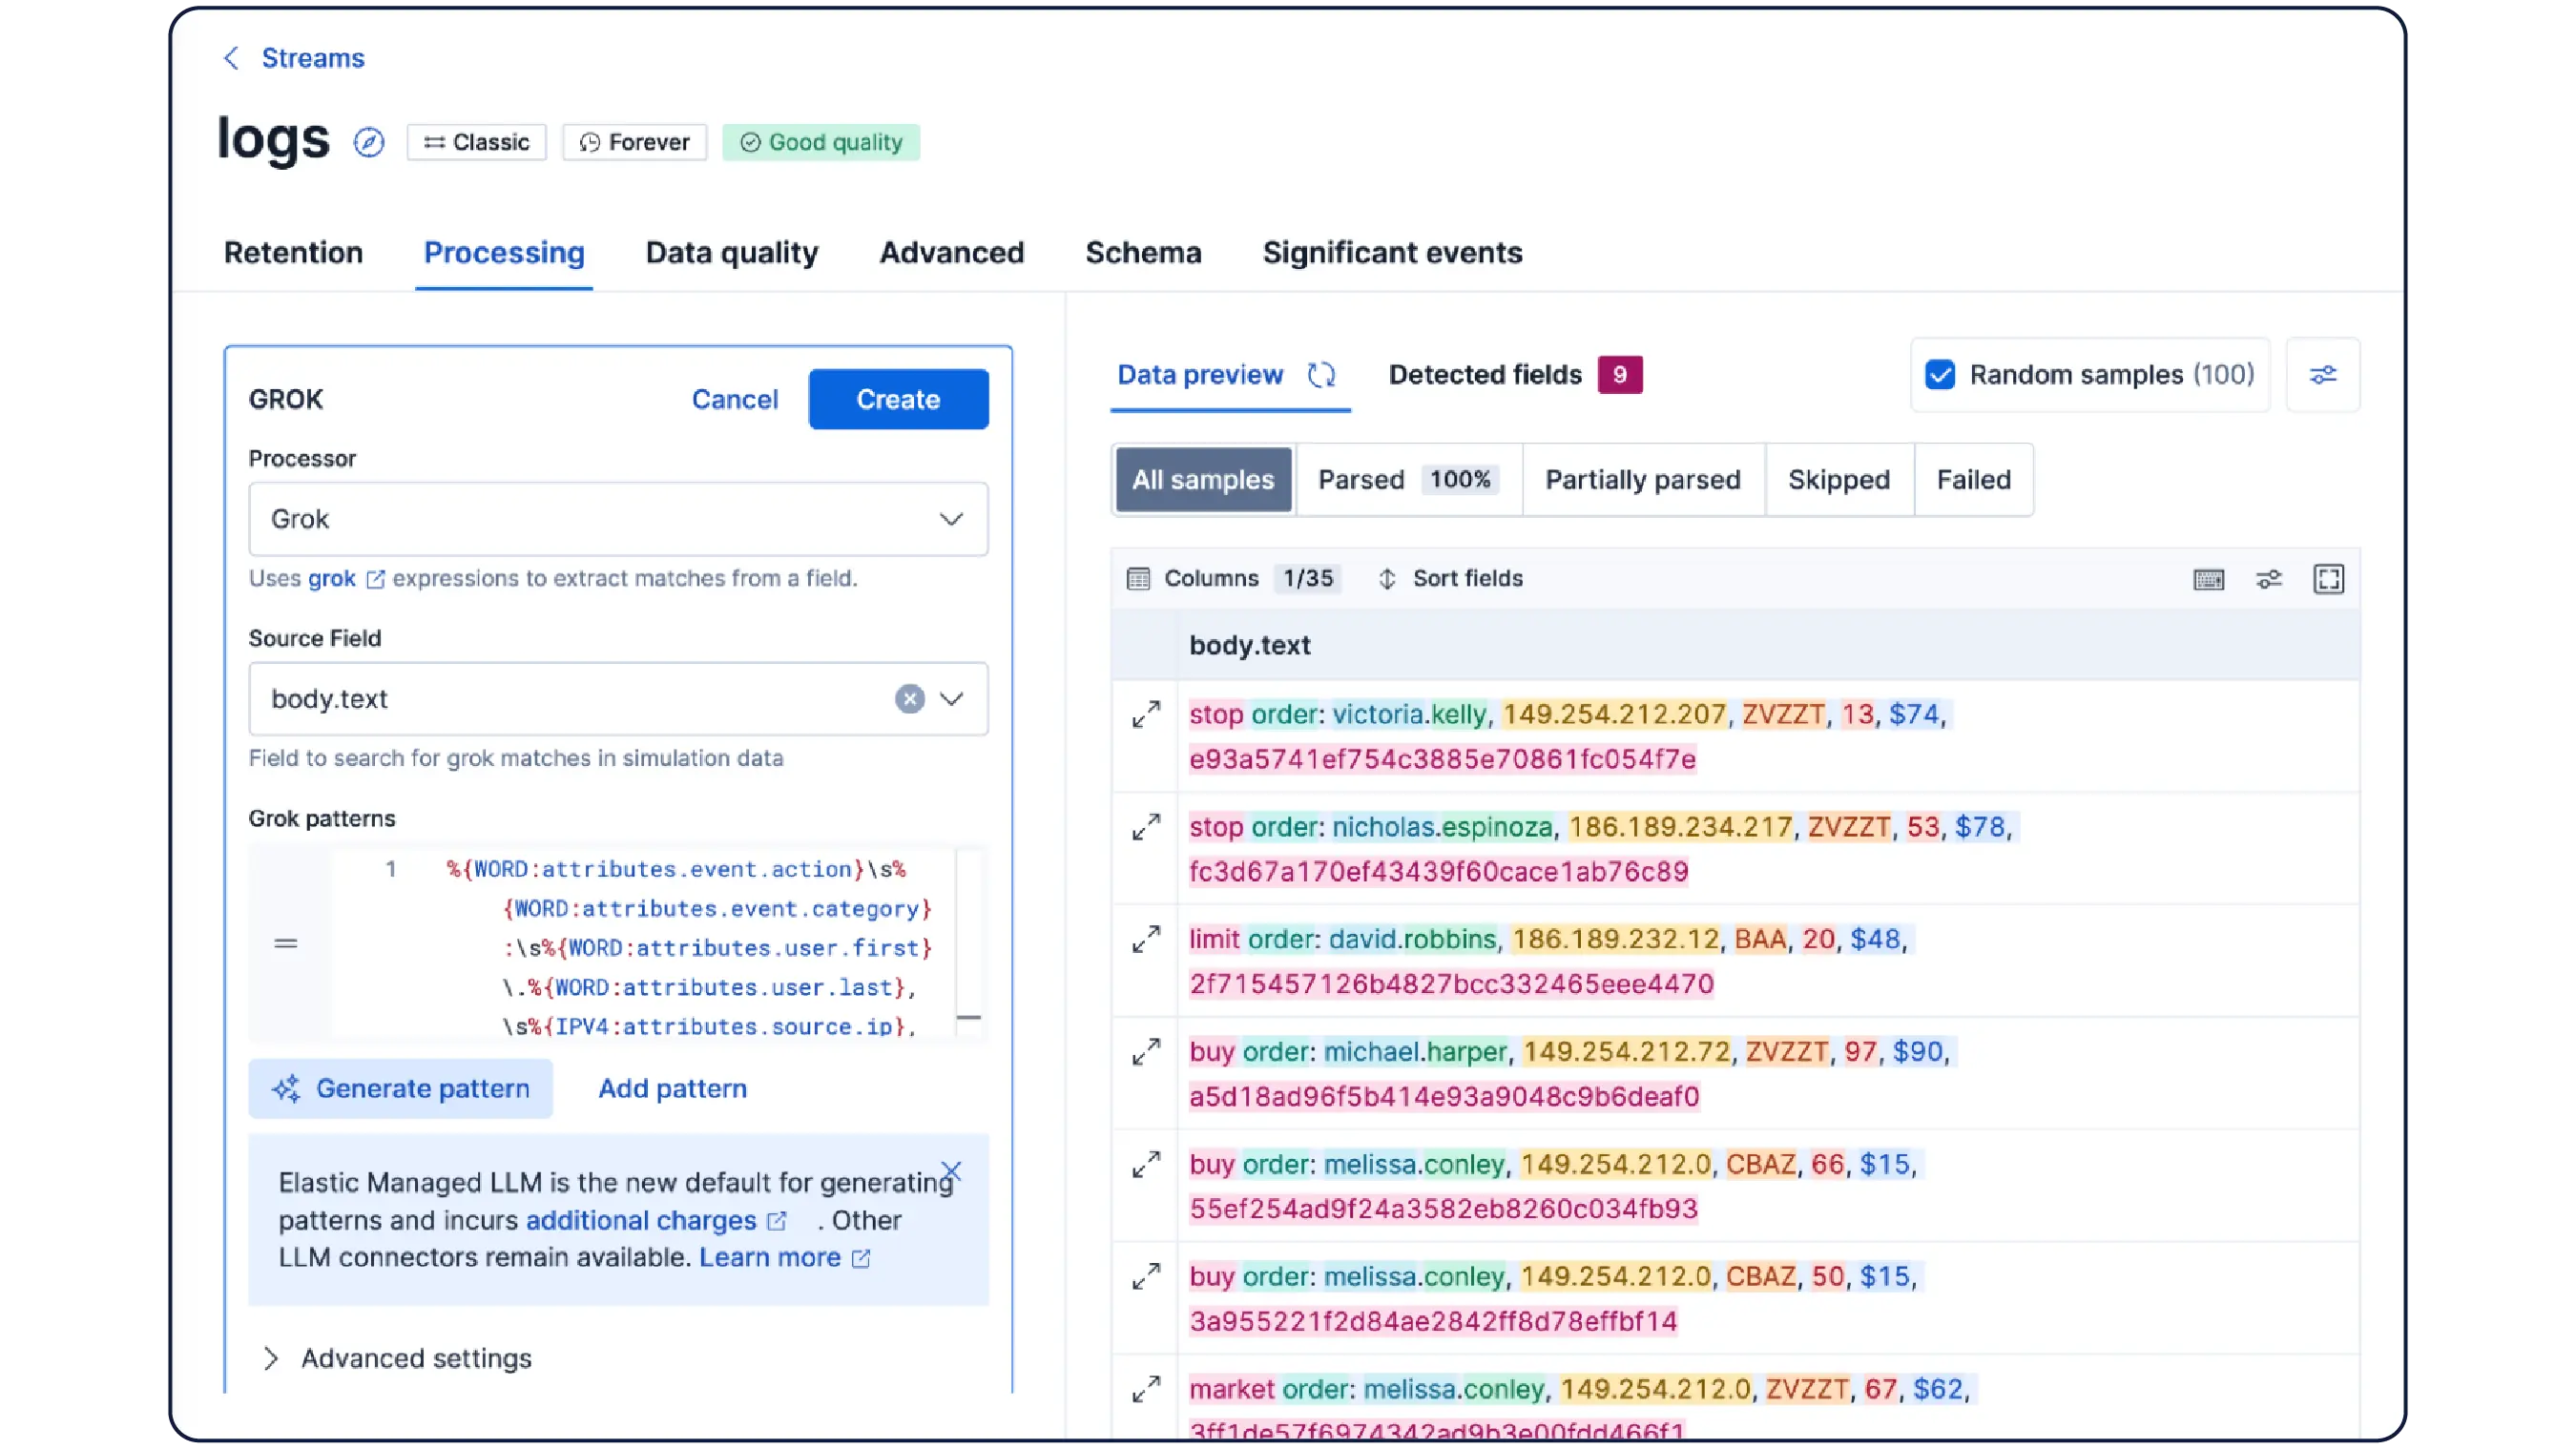
Streams: AI based parsing of raw signals
Manual schema definition in SQL
Automatic import
No automatic import
AI Assistant
Uses your enterprise knowledge and LLMs for accurate answers
AI Assistant
Limited (only for database management, not for observability)
Enterprise knowledge integrations
No enterprise knowledge integrations
Managed LLM (no setup)
or connectors to OpenAI, Azure OpenAI, Amazon Bedrock, Google Gemini
Managed LLM (no setup)
Limited (not available from HyperDX, and no option to choose LLM)
Significant Events
surfaces features in logs
No Significant Events
surfaces features in logs
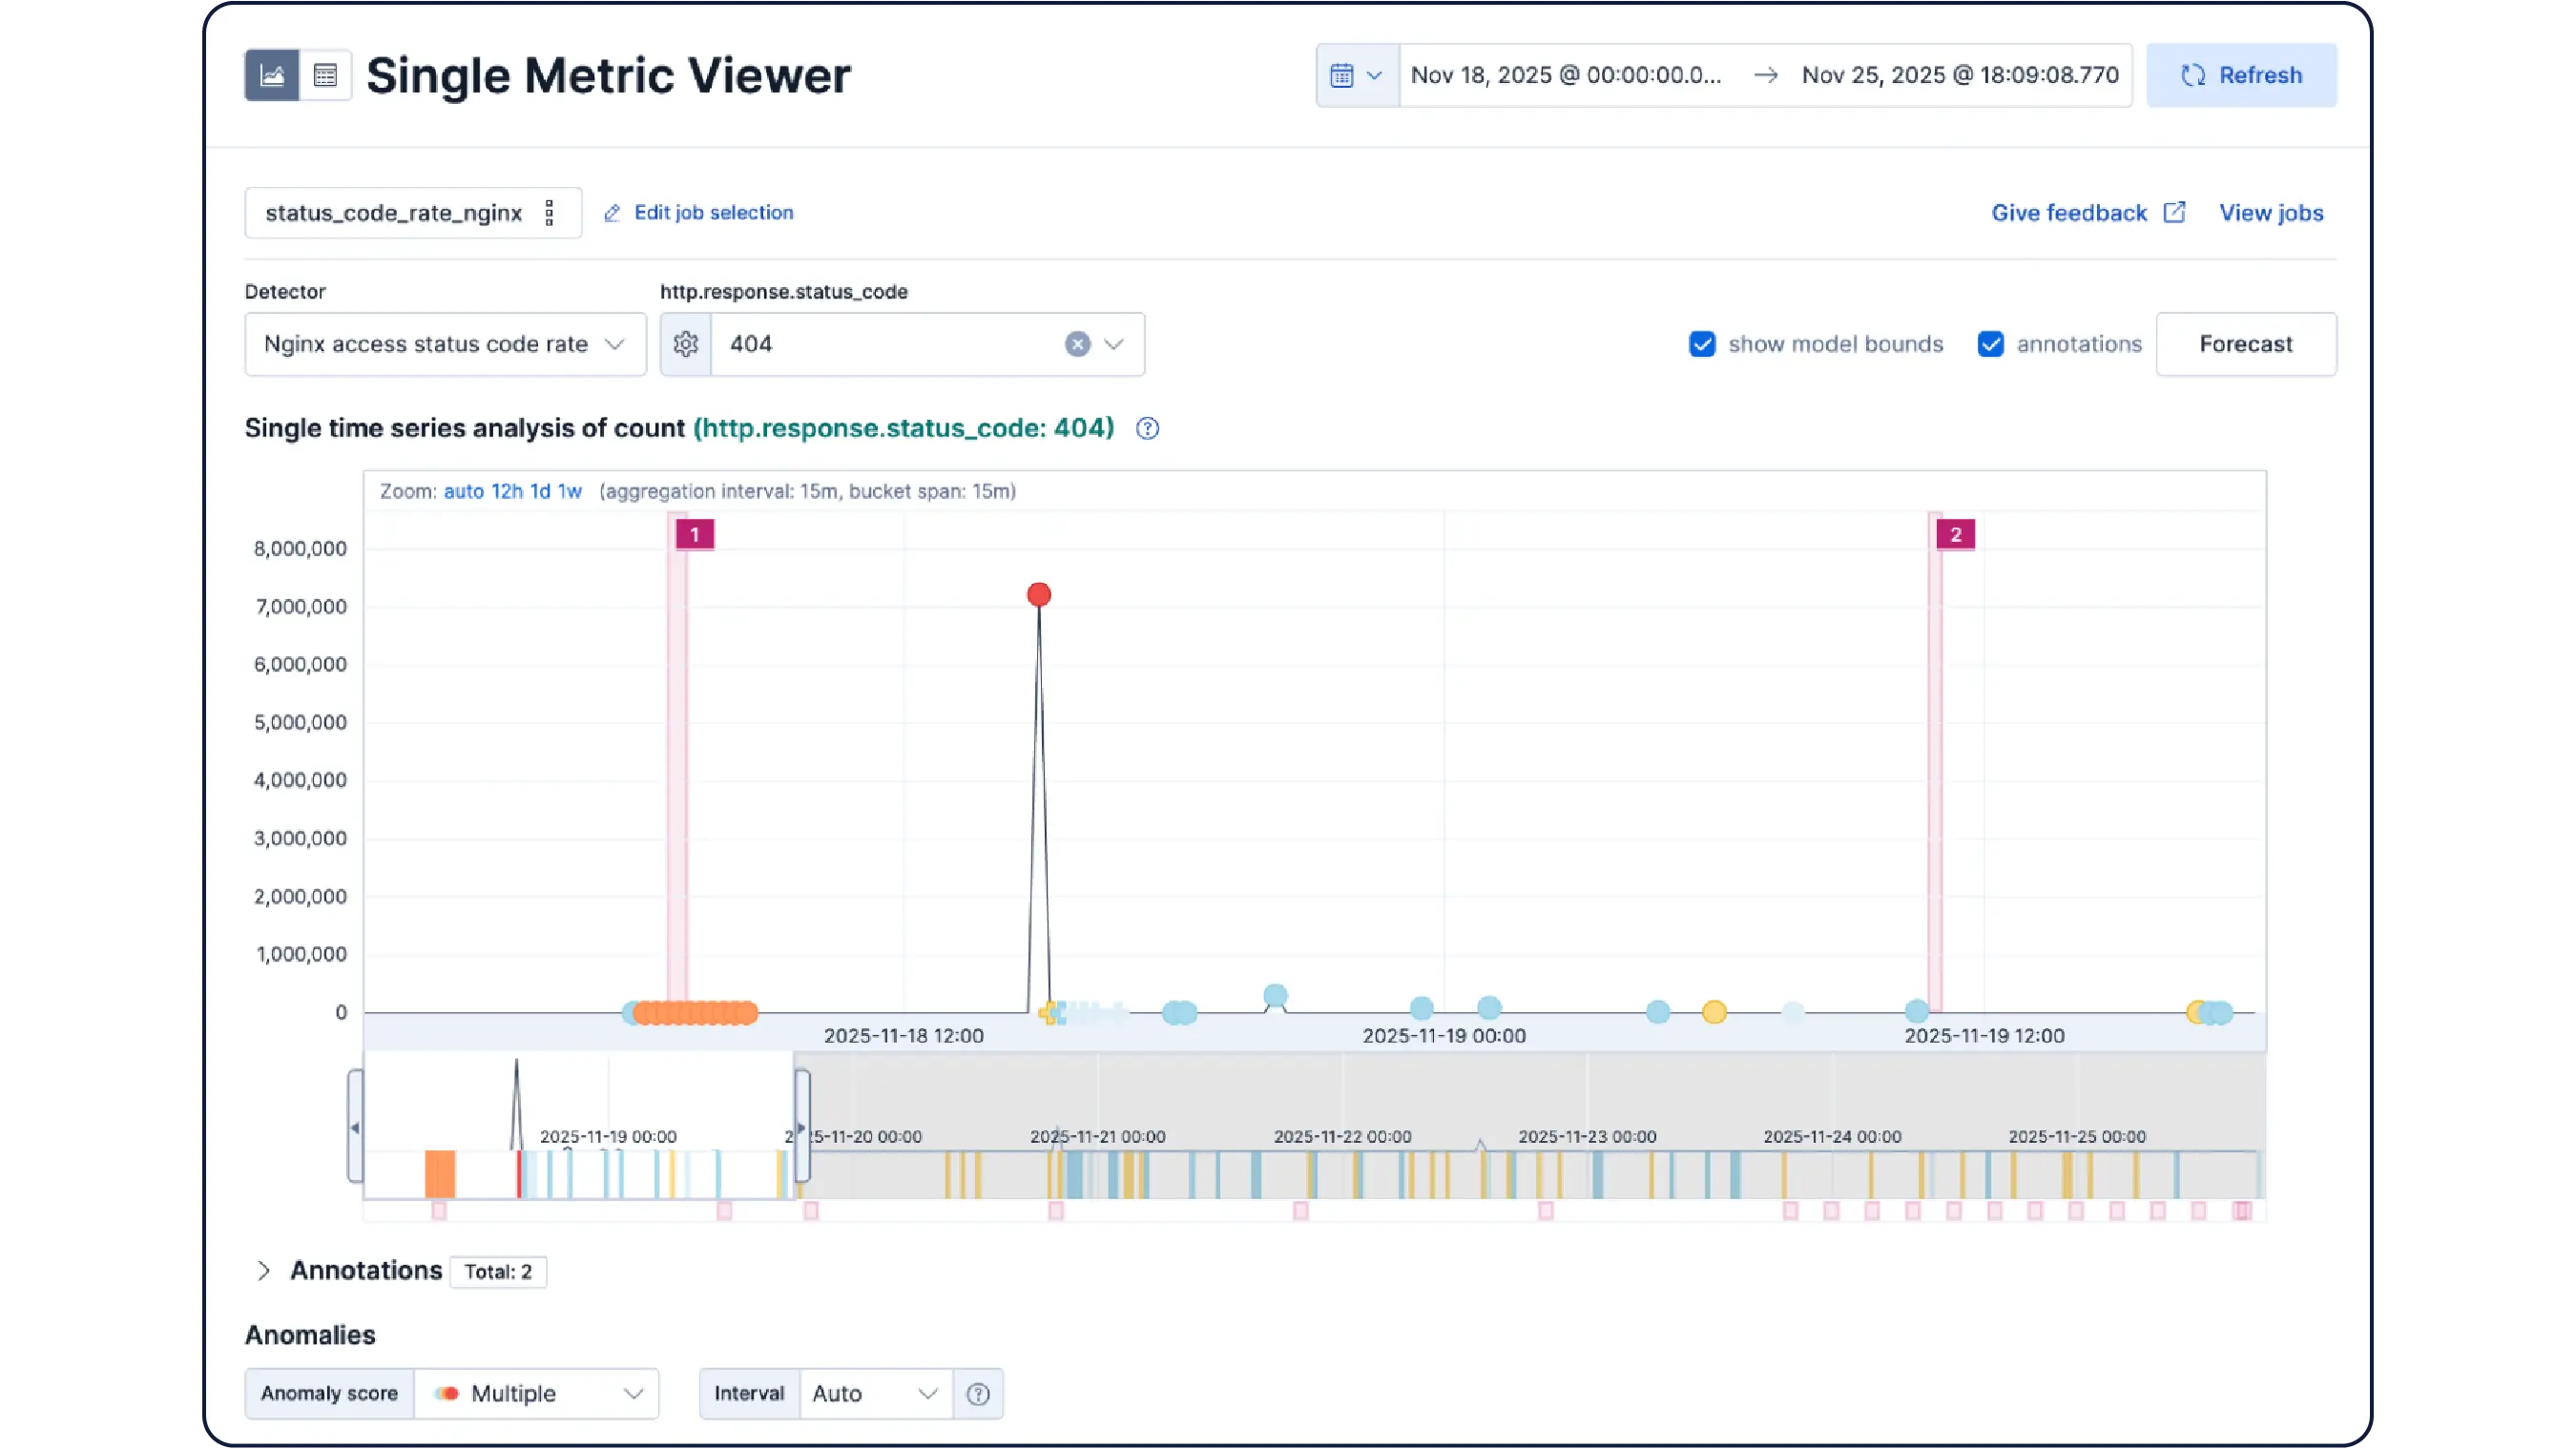
Machine learning
100+ preconfigured anomaly detection jobs for all signals, using both unsupervised learning and supervised techniques
No machine learning
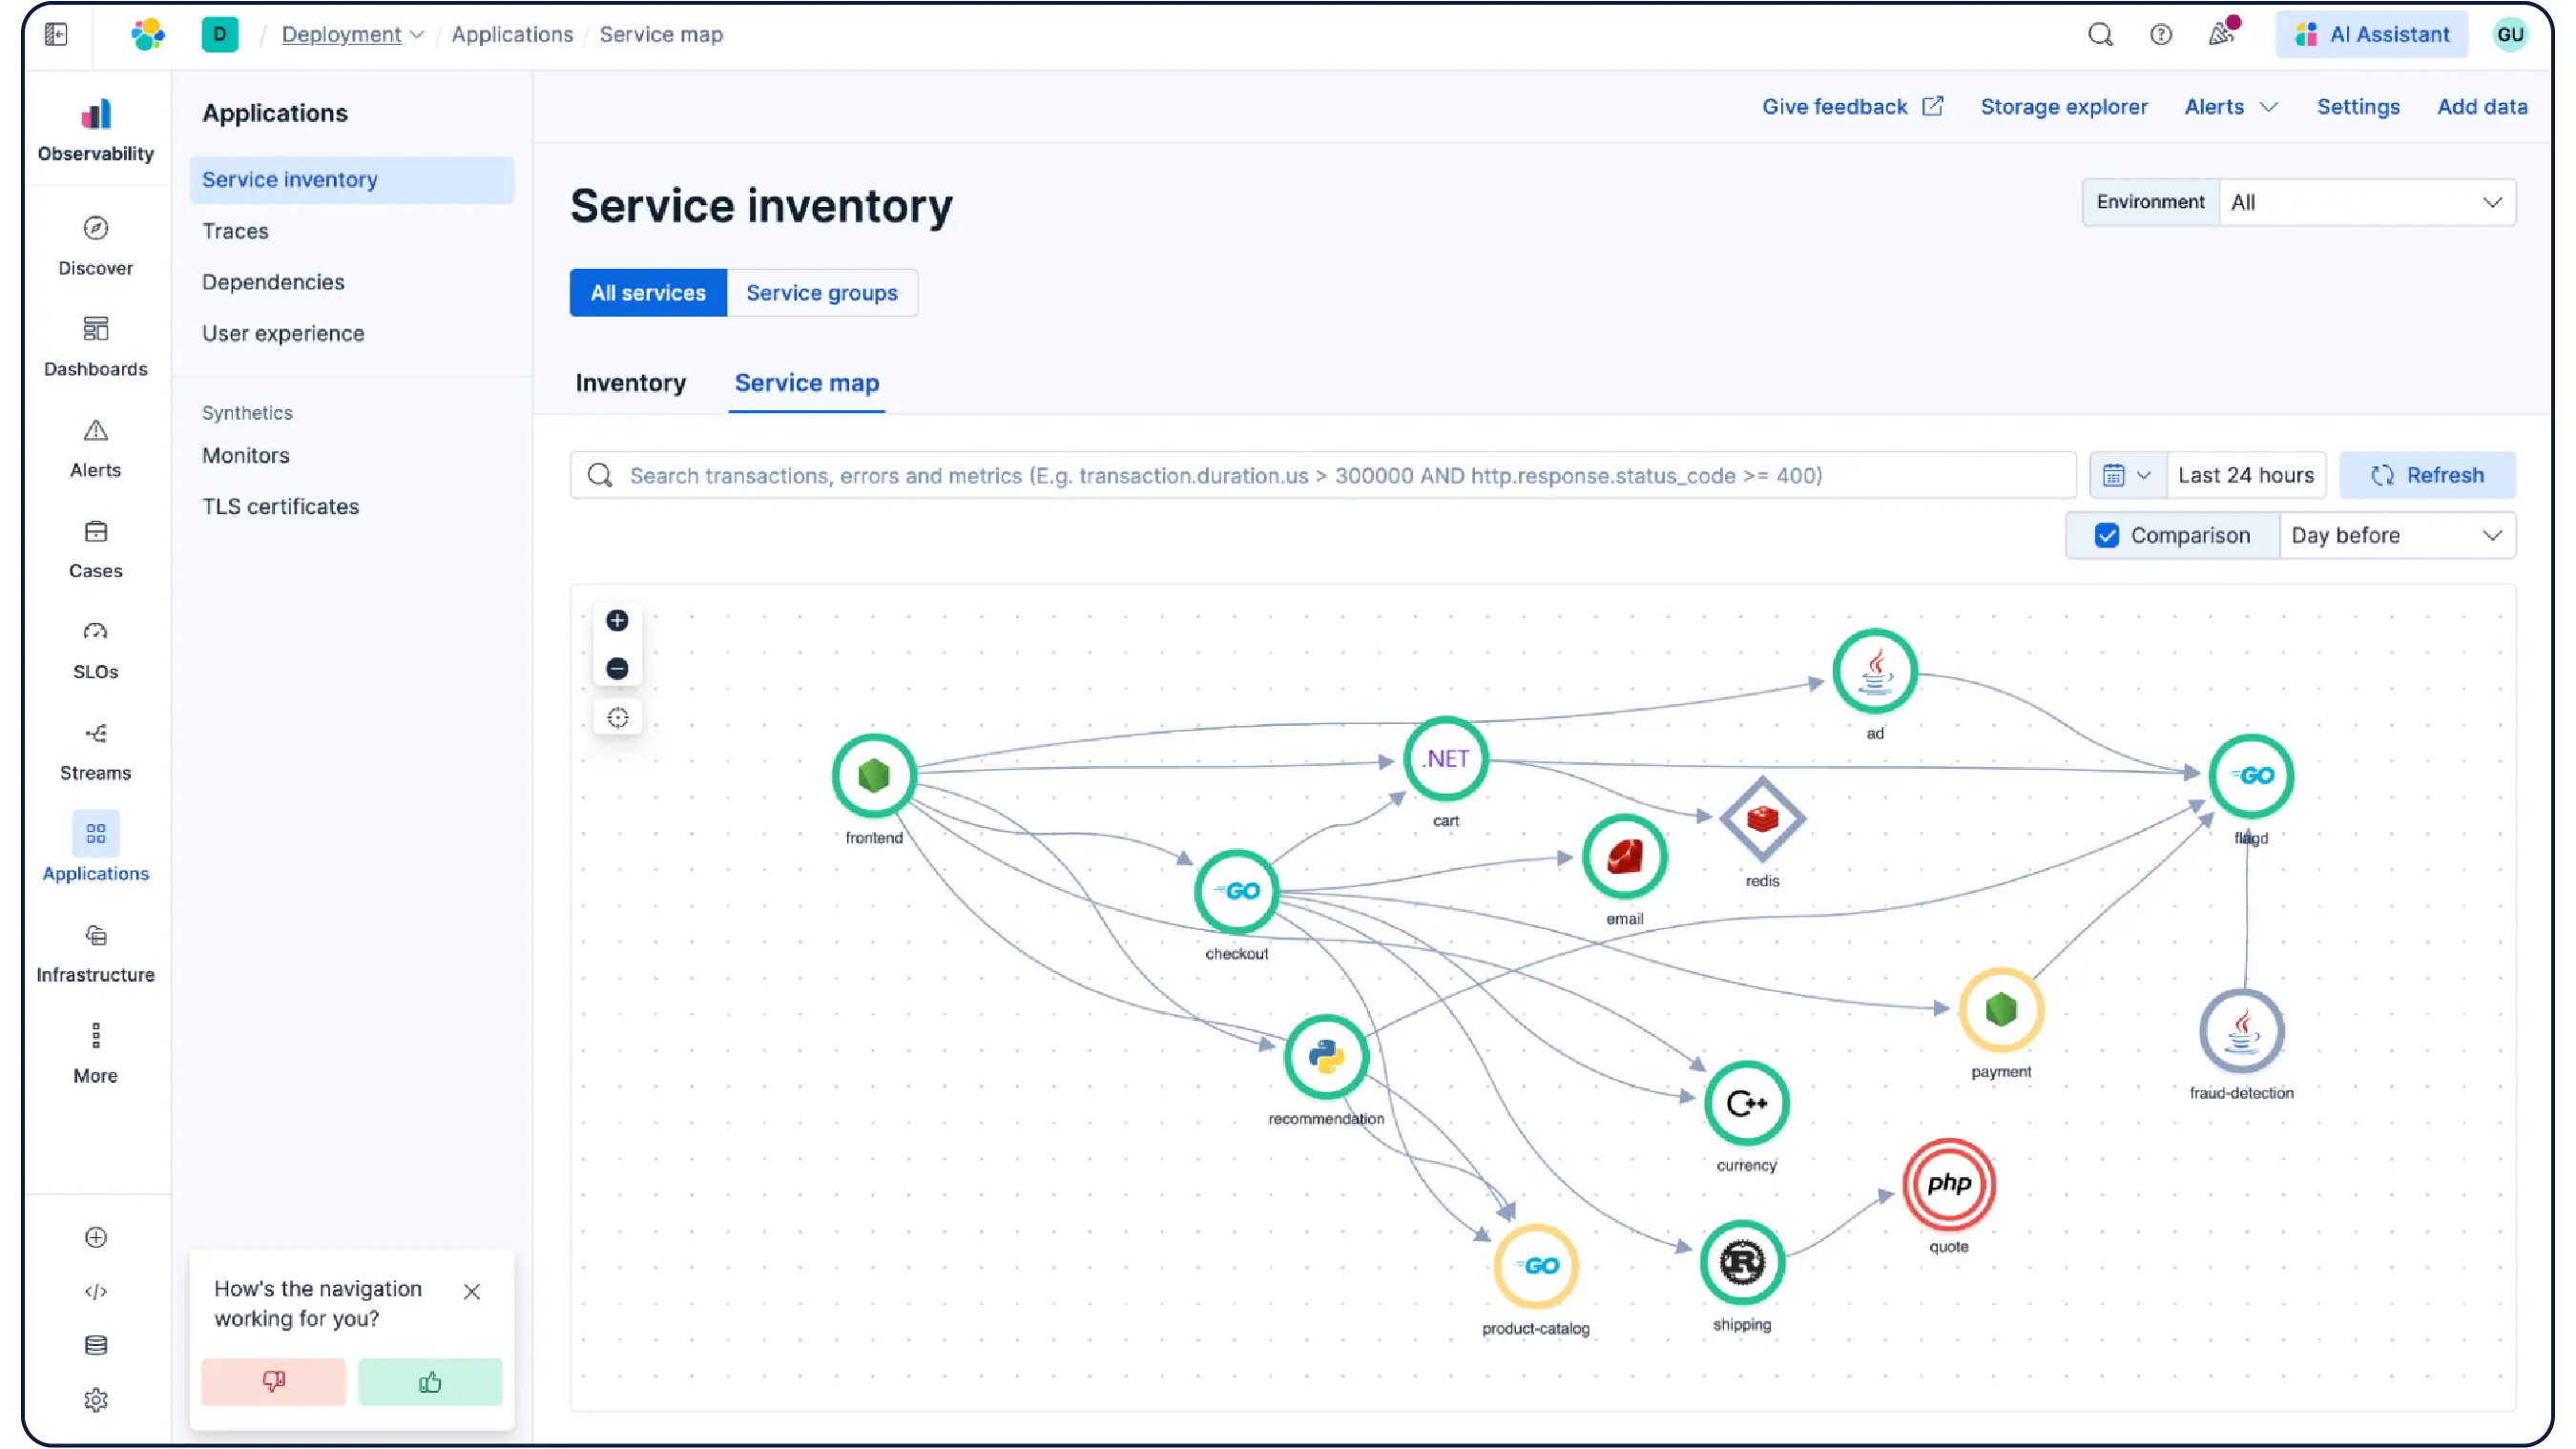
APM + universal profiling
APM + universal profiling
Traces only. No service maps, end-to-end transaction flows, or troubleshooting workflows. No service health monitoring.
eBPF-based code profiling capability
No eBPF-based code profiling capability
Infrastructure monitoring
No infrastructure monitoring
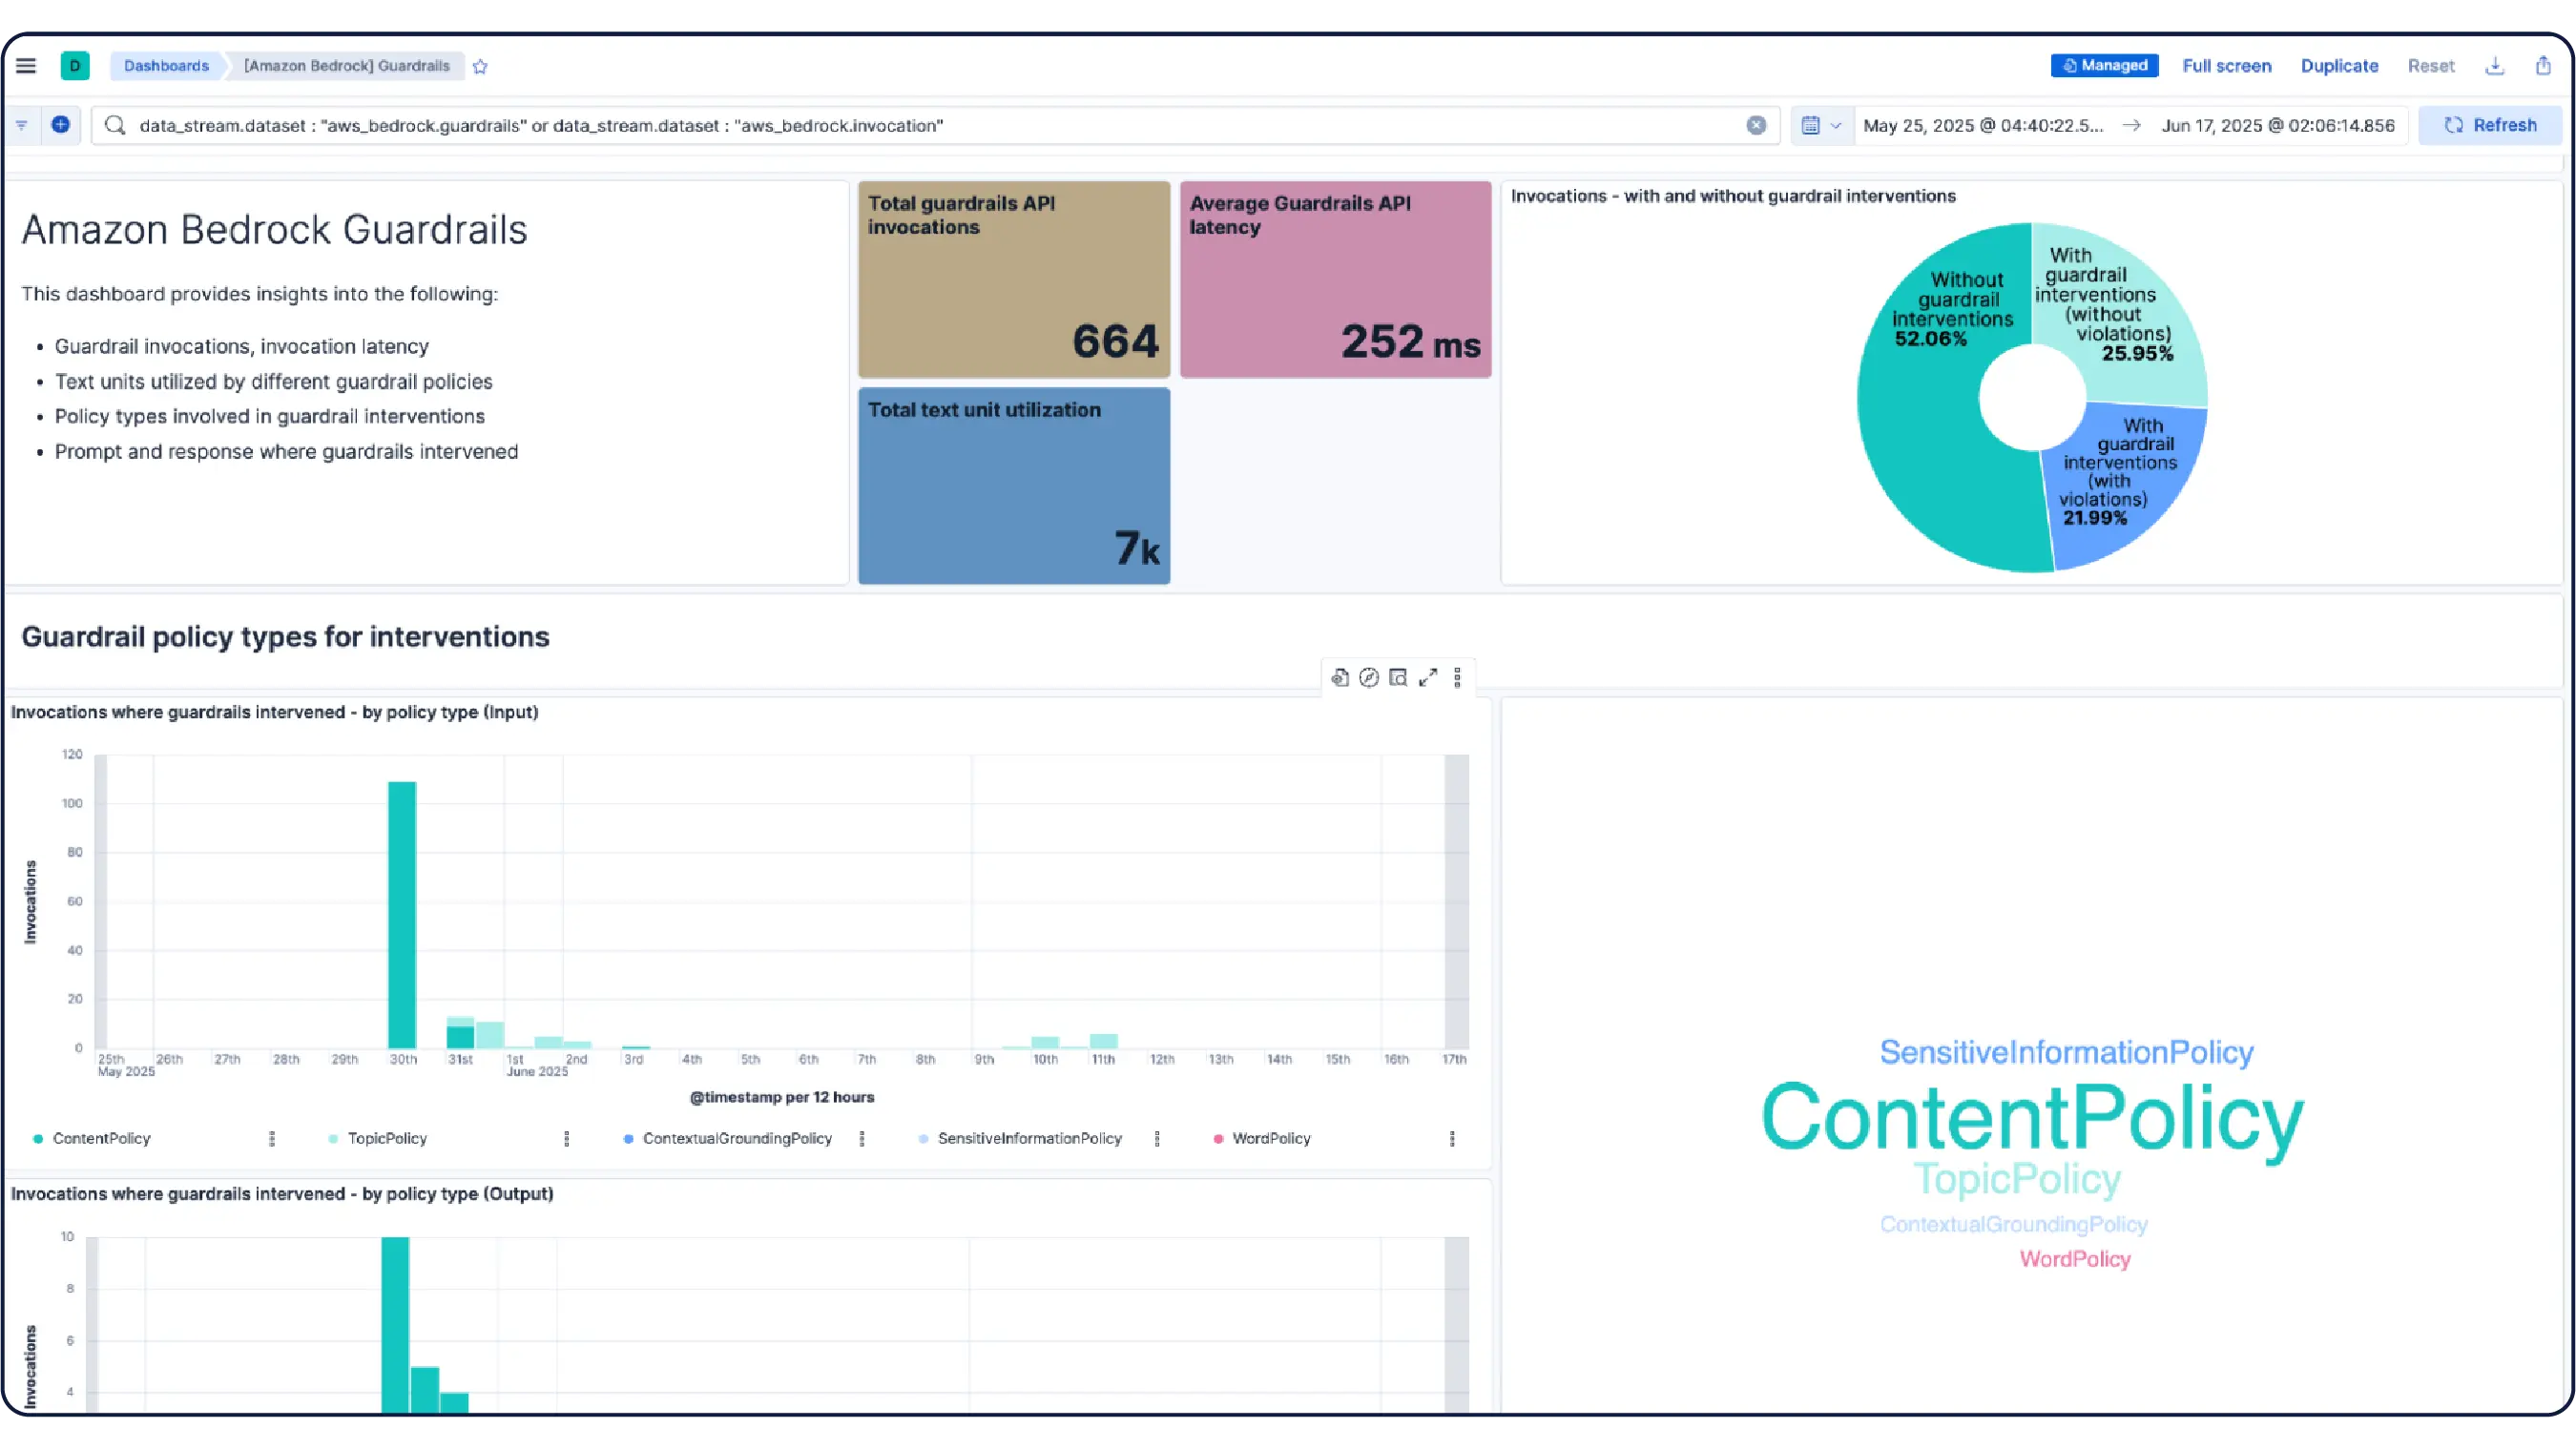
LLM observability with prebuilt dashboards
for AWS Bedrock, Azure AI Foundry, Open AI, Google Vertex, etc.
No LLM observability with prebuilt dashboards
Synthetics
No synthetics
SLOs
No SLOs
Proactive alerts based on anomaly detection
No proactive alerts based on anomaly detection
Cases
No cases
Inference API with built‑in semantic models
No inference API with built‑in semantic models
Hybrid and semantic retrieval
RRF retriever; rerank cross‑encoder for answer quality
No hybrid and semantic retrieval
Access control
Access control
Limited (low level data access controls (row/col))
Global managed service
+ fully-managed + self‑managed
Global managed service
Limited (only has deployment options for us-west-1, us-west-2, eu-central-1, and eu-north-1)
Fully managed service with existing FedRAMP authorization
No fully managed service with existing FedRAMP authorization
Built for petabyte‑scale indexing and aggregations
Not built for petabyte‑scale indexing and aggregations
Requires upfront schema design and pre-aggregation strategies to perform at scale; adds overhead requiring ClickHouse expertise
One-click setup
One-click setup, integrated UI, low operational overhead
Manual setup
Requires managing table engines, back-fills, partitions, materialized views, and large SQL queries
Geospatial search
Geospatial search, geo hexgrids; map visualizations
No geospatial search
First-class search
First-class search; fuzziness, synonyms, highlighting, nested done right
Poor search experience
Search user experience is poor, no fuzzy search support
The world's largest companies rely on Elastic
The smart, open choice that delivers uncompromised value
Customer spotlight

Wells Fargo observes through a single pane of glass — including metrics, events, logs, application traces, and extensions to minimize the log fields ingested by 60%.
Customer spotlight

Comcast transforms customer experiences by providing a more strategic, partnership-based approach.
Customer spotlight

Equinox boosts its cloud infrastructure health with Elastic Observability and reduces observability operational expenditure by 80%.