Was ist Kubernetes-Monitoring?
Kubernetes-Monitoring: Definition
Der Begriff „Kubernetes-Monitoring“ bezeichnet ein Reporting-System, das DevOps- und IT-Teams hilft, Probleme zu erkennen und komplexe Kubernetes-Cluster proaktiv zu verwalten. Ein effektives Kubernetes-Monitoring ermöglicht die Echtzeitverwaltung der gesamten containerisierten Infrastruktur. Es misst und verfolgt Daten zur Uptime und Auslastung der Cluster-Ressourcen, vom Arbeitsspeicher über die CPU bis hin zum Datenspeicher. Außerdem werden die Interaktionen zwischen den Cluster-Komponenten überwacht.
Mithilfe von Kubernetes-Monitoring können Cluster-Operators überwachen, ob alles funktioniert. Es meldet, wenn die erforderliche Anzahl von Pods nicht läuft, wenn die Ressourcenauslastung sich kritischen Grenzen nähert und wenn ein Pod oder Knoten aufgrund eines Ausfalls oder eines Konfigurationsfehlers einem Cluster nicht beitreten kann.
Mit Kubernetes-Monitoring erhalten Sie Einblick in den inneren Zustand Ihres Clusters, die Anzahl der Ressourcen und Performance-Metriken. Durch proaktive Alerts und eine auf Machine Learning basierende Anomalieerkennung unterstützt es Sie auch bei der schnellen Erkennung und Behebung von Problemen. Erfahren Sie mehr dazu, wie das richtige Kubernetes-Monitoring-Tool Ihnen dabei helfen kann, sich anhand der von diesen Tools generierten Logdaten, Metriken und Traces ein Bild vom Status und Zustand Ihrer Kubernetes-Cluster und der darauf ausgeführten Anwendungen zu machen – alles über eine zentrale Ansicht aller verfügbaren Daten.
Was ist Kubernetes?
Kubernetes (K8s) ist ein Open-Source-System zur Containerorchestrierung für die Automatisierung der Software-Bereitstellung, Skalierung und Verwaltung containerisierter Anwendungen. Das Projekt, das ursprünglich 2014 von Google entwickelt wurde, wird heute von der Cloud Native Computing Foundation (CNCF) betreut. Kubernetes macht viele der manuellen Prozesse im Zusammenhang mit der Verwaltung containerisierter Anwendungen überflüssig. Die Containerorchestrierung sorgt dafür, dass einzelne Container zu einem zusammenhängenden, koordinierten Ganzen kombiniert werden.
Kubernetes kann auf verschiedenen Cloud-Plattformen, aber auch in selbstverwalteten Systemen bereitgestellt werden, um IT- und DevOps-Teams effizienter zu machen. Viele Anbieter von Cloud-Services, wie AWS, Google und Azure, bieten ihren Nutzer:innen zusätzlich eine Form von verwalteten Kubernetes-Diensten an. Das Orchestrieren von Containern auf verschiedenen Hosts bietet die folgenden Vorteile:
- Maximierung der für das Ausführen von Anwendungen erforderlichen Ressourcen
- Automatisierung der Bereitstellung und Aktualisierung von Anwendungen
- Schnelle Skalierung containerisierter Anwendungen
- Verwaltung von Diensten, um zu gewährleisten, dass Anwendungen wie vorgesehen laufen
Warum ist das Kubernetes-Monitoring wichtig?
Beim Kubernetes-Monitoring werden viele kleinere Komponenten, wie Hosts, Container und containerisierte Anwendungen, sowie Ihre Kubernetes-Plattform selbst überwacht. Wenn Probleme auftreten, kann es schwierig sein, deren Ursache zu ermitteln. Bei einem ordnungsgemäßen Kubernetes-Monitoring können Sie einfacher erkennen, an welcher Stelle die Probleme auftreten – oder auftreten werden –, und entsprechende Maßnahmen ergreifen.
Kubernetes-Monitoring-Lösungen können auch verwertbare Berichtsinformationen und Einblicke in Cluster, Deployments, Knoten und Container liefern. Und dank der Möglichkeit, Alerts zu konfigurieren, können Sie die Voraussetzung dafür schaffen, dass Ihre Teams in der Lage sind, schnell auf jedes Sicherheits- und Performance-Ereignis zu reagieren. Anhand der zusammengetragenen Daten können Sie den Zustand, die Performance und die Sicherheitskonfigurationen Ihrer Cluster verbessern. Das wiederum führt zu besserer Ressourcennutzung und senkt die Kosten.
Das Kubernetes-Monitoring bietet die folgenden Vorteile:
- Schaffung der Voraussetzungen dafür, dass Ressourcen von Teams oder Anwendungen optimal genutzt werden
- Automatische Nutzung neuer Ressourcen, wenn ein Cluster um einen neuen Knoten erweitert wird
- Umschichtung von Workloads auf verfügbare Knoten, wenn Hosts ausfallen
- Effizientere Bereitstellung von Updates und Rollbacks
Methoden für das Kubernetes-Monitoring
Für das Kubernetes-Monitoring benötigen Sie Folgendes:
- Metriken-Server, der im Cluster ausgeführt wird
- aktivierter Dienst „kube-state-metrics“
- einen funktionierenden Erfassungsmechanismus
- Kubernetes-Monitoring-Tool, das mit Kubernetes-Metriken und ‑Logdaten umgehen kann
Ein umfassendes Observability-Tool kann sowohl Kubernetes-Daten als auch Anwendungs-Traces, Metriken und Logdaten überwachen und so für volle Transparenz Ihrer gesamten Umgebung sorgen. - Agent zum Erfassen von Metriken und Logdaten
Viele Kubernetes-Monitoring-Lösungen nutzen einen DaemonSet-Ansatz, da sie sich relativ einfach provisionieren lassen. Ein DaemonSet ist ein spezieller Pod, der dafür sorgt, dass auf allen Knoten im Cluster eine Kopie seiner Workload ausgeführt wird. Entwickler:innen können DaemonSets erstellen, die zum Sammeln von Performance-Metriken auf jedem Knoten in einem Cluster einen Monitoring-Agent ausführen.
Welche Metriken sind für das Kubernetes-Monitoring besonders wichtig?
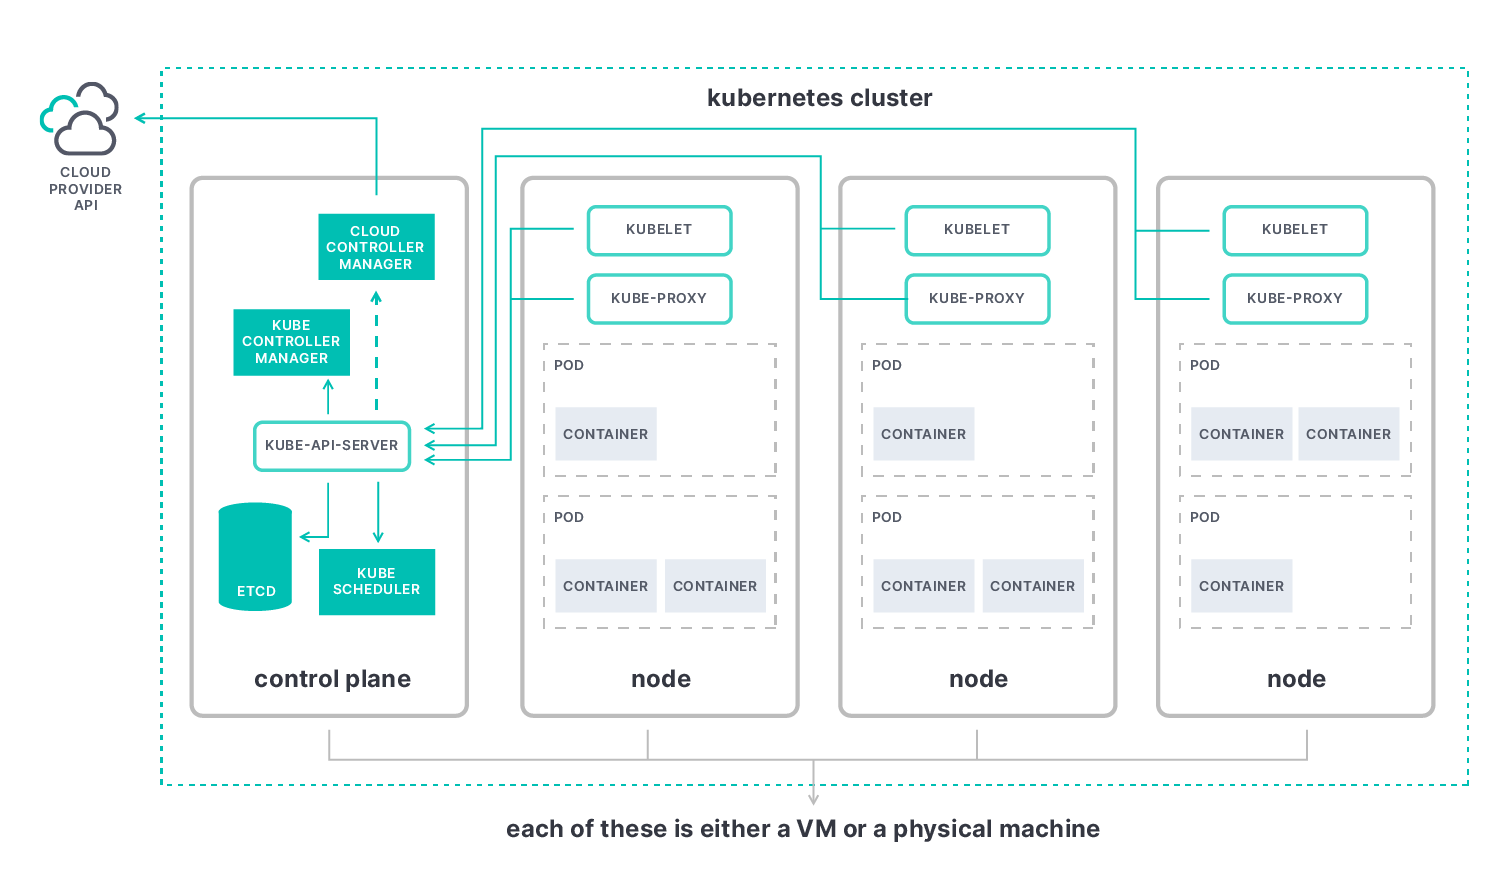
Die wichtigsten Metriken beim Kubernetes-Monitoring sind die Master-Metriken (Control Plane) sowie die Metriken für Knoten, Pods und Container.
- Anhand der Kubernetes-Master-Metriken können Sie sich ein Bild von der Performance des Clusters als Ganzem machen. Die Kernkomponente ist der Kubernetes-API-Server („kube-apiserver“), mit dem Sie Elemente wie die folgenden beobachten können:
- etcd: Konsistenter und hochverfügbarer Key-Value-Speicher, den Kubernetes als Backing-Store für alle Clusterdaten verwendet.
- kube-scheduler: Planungsprozess, der entscheidet, wo neue Pods platziert werden sollen, indem er die Pods in eine Warteschlange einreiht, da für jeden Pod genau bewertet wird, an welchen verfügbaren Knoten er gebunden werden soll.
- kube-controller-manager: Komponente, die alle Controller in einem einzigen Prozess zusammenfasst und sie gemeinsam ausführt, um die Komplexität zu verringern.
- cloud-controller-manager: Controller, der mit den Ressourcen des Cloud-Anbieters interagiert und es Ihnen ermöglicht, Ihren Cluster mit der API des Cloud-Anbieters zu verknüpfen.
- Mit Kubernetes-Knoten-Metriken können Sie die Performance Ihres gesamten Kubernetes-Clusters überwachen, von der Anzahl der verwendeten Ressourcen über die Anzahl der auf den einzelnen Knoten laufenden Anwendungen bis hin zum ordnungsgemäßen Funktionieren Ihrer Knoten. Wir empfehlen, nach Metriken zur Nutzung von Knotenressourcen Ausschau zu halten, wie z. B. zur Festplatten- und Arbeitsspeichernutzung, zur CPU-Nutzung und zur Netzwerkbandbreite. Jeder Knoten enthält die folgenden Elemente:
- kubelet: Agent, der auf jedem Knoten im Cluster ausgeführt wird. Er sorgt für die Containerausführung in einem Pod.
- kube-proxy: Netzwerk-Proxy, der auf jedem Knoten in Ihrem Cluster ausgeführt wird und einen Teil des Kubernetes-Service-Konzepts implementiert.
- Container-Runtime: Software, die Container ausführt; auch als „Container-Engine“ bezeichnet.
- Kubernetes-Container-Metriken bieten Ihnen die Möglichkeit zu beurteilen, wo Sie im Vergleich zu den von Ihnen konfigurierten Ressourcenlimits stehen. Sie geben u. a. Aufschluss über die CPU-Nutzung des Containers, die Arbeitsspeicherauslastung des Containers und die Netzwerkauslastung.
- Kubernetes-Pod-Metriken helfen herauszufinden, ob alle Pods in einem Deployment korrekt ausgeführt werden. Anwendungsmetriken zeigen anhand von Angaben zu Uptimes und Reaktionszeiten, zur Reaktionsfähigkeit, zur Latenz usw. die Performance und Verfügbarkeit von Anwendungen, die in Ihren Kubernetes-Pods ausgeführt werden.
Herausforderungen beim Kubernetes-Monitoring
Das Migrieren herkömmlicher Anwendungen zu Kubernetes kann sehr zeitaufwendig sein. Zwar kann Kubernetes die Anwendungsbereitstellung in Containern und über Clouds hinweg vereinfachen, seine Komplexität bringt aber auch eine Reihe von Herausforderungen mit sich.
Die Orchestrierung von Kubernetes-Containern bietet dynamisches Automatisierungspotenzial. Daher braucht es gleichermaßen dynamische Monitoring-Systeme, um die einzelnen Komponenten überprüfen und Alerts auslösen zu können. Eine der besonderen Herausforderungen beim Monitoring von Anwendungen, die in dynamischen containerisierten Umgebungen laufen, ist deren Komplexität Wie diagnostiziert und behebt man Probleme mit Hunderten von Microservices auf Tausenden von Containern, die in kurzlebigen und nur für den einmaligen Einsatz bestimmten Pods laufen?
Best Practices für das Kubernetes-Monitoring
Die Best Practices für das Kubernetes-Monitoring gelten überall – ganz gleich, ob Ihre Knoten alle am selben Standort, in verschiedenen Clouds oder in einer Hybrid-Cloud-Umgebung bereitgestellt wurden. Das Erfassen von Metriken sollte im gesamten Cluster auf dieselbe Weise erfolgen. Die folgenden Best Practices könnten beim Kubernetes-Monitoring hilfreich sein:
- Verwenden Sie Namespaces, um Ihr Cluster zu organisieren, das Container-Management zu vereinfachen und das Risiko zu minimieren.
- Nutzen Sie die jeweils neueste Version von Kubernetes, um von neuen Features, Bug-Fixes und Security-Patches zu profitieren.
- Nutzen Sie Kubernetes-Alerts sinnvoll, indem Sie automatisiertes Monitoring einrichten.
- Richten Sie eine rollenbasierte Zugriffssteuerung (Role-Based Access Control, RBAC) ein, um die Berechtigungen und den Zugriff durch Nutzer:innen und Dienstkonten zu verwalten.
- Richten Sie Push-Benachrichtigungen ein, die an Cluster-Administrator:innen gesendet werden, und legen Sie Teams fest, die für das Beheben konkreter Probleme zuständig sind.
- Nutzen Sie Labels, um Ihre Cluster zu organisieren und Objekte zu definieren und zu verwalten.
- Verringern Sie die Zahl der Fehler, indem Sie einen optimierten Git-basierten Workflow einrichten.
Wenn Sie es den erfolgreichsten Kubernetes-Monitoring-Lösungen gleich tun möchten, achten Sie auf Folgendes:
- Beziehen Sie alle Ebenen Ihres Tech-Stacks in die Überwachung ein. Alle Host-Systeme – Kubernetes-Kernkomponenten, Knoten, Pods und Container innerhalb des Clusters – und alle Anwendungen und Dienste sollten verfolgt werden.
- Sorgen Sie dafür, dass alle Dienste, die dynamisch ins Spiel kommen, automatisch erkannt und überwacht werden.
- Bieten Sie eine Möglichkeit, Daten so zu erfassen und zu korrelieren, dass Sie zugehörige Metriken, Logdaten, Traces und andere Observability-Daten zu Gruppen zusammenfassen und untersuchen können.
- Achten Sie auf die Integration mit offenen Standards, wie Prometheus und OpenTelemetry, um zusätzliche Metriken erfassen zu können.
Wenn Sie mehr dazu erfahren möchten, wie Sie mit Elasticsearch und OpenTelemetry Anwendungs- und Dienst-Workflows auf Kubernetes überwachen und schützen können, lesen Sie diesen Best-Practices-Artikel.
Kubernetes vs. Docker
Im Gegensatz zu Docker verarbeitet Kubernetes große Mengen von containerisierten Anwendungen. Docker dagegen ist ein Satz von Entwicklungstools, mit dem einzelne Container erstellt, geteilt und ausgeführt werden können.
Docker nutzt eine Client-Server-Architektur mit einfachen Befehlen und Automatisierung über eine einzige API. Es bietet eine nutzerfreundliche Möglichkeit, containerisierte Anwendungen zu verpacken und zu verteilen.
Mit Docker erstellte Container-Images können auf einer Plattform ausgeführt werden, die Container unterstützt, wie das z. B. bei Kubernetes oder Docker Swarm der Fall ist. Für das Ausführen, Verwalten, Planen und Orchestrieren großer Containermengen, die auf mehrere Server und Cluster verteilt sind, ist Kubernetes besser geeignet als Docker. Wenn es um die Überwachung ihres Zustands und effizienten Lastausgleich geht, bevorzugen die meisten größeren Unternehmen eindeutig Kubernetes.
Ein entscheidender Vorteil von Kubernetes ist, dass es über eine API und ein Befehlszeilentool verfügt, mit denen sich Vorgänge automatisieren lassen. Das Tool, kubectl, macht die Containerverwaltung deutlich einfacher. Kubernetes ist eine Plattform für das Ausführen und Verwalten von Containern aus vielen Container-Runtimes, einschließlich Docker-Container-Runtimes. Dass Kubernetes in der Lage ist, eine ganze Reihe von Elementen automatisch zu verwalten, macht es besonders flexibel. Und durch seine Zuverlässigkeit sparen IT-Teams Zeit, was dem Gesamt-Workflow zugutekommt.
Dashboard für das Kubernetes-Monitoring
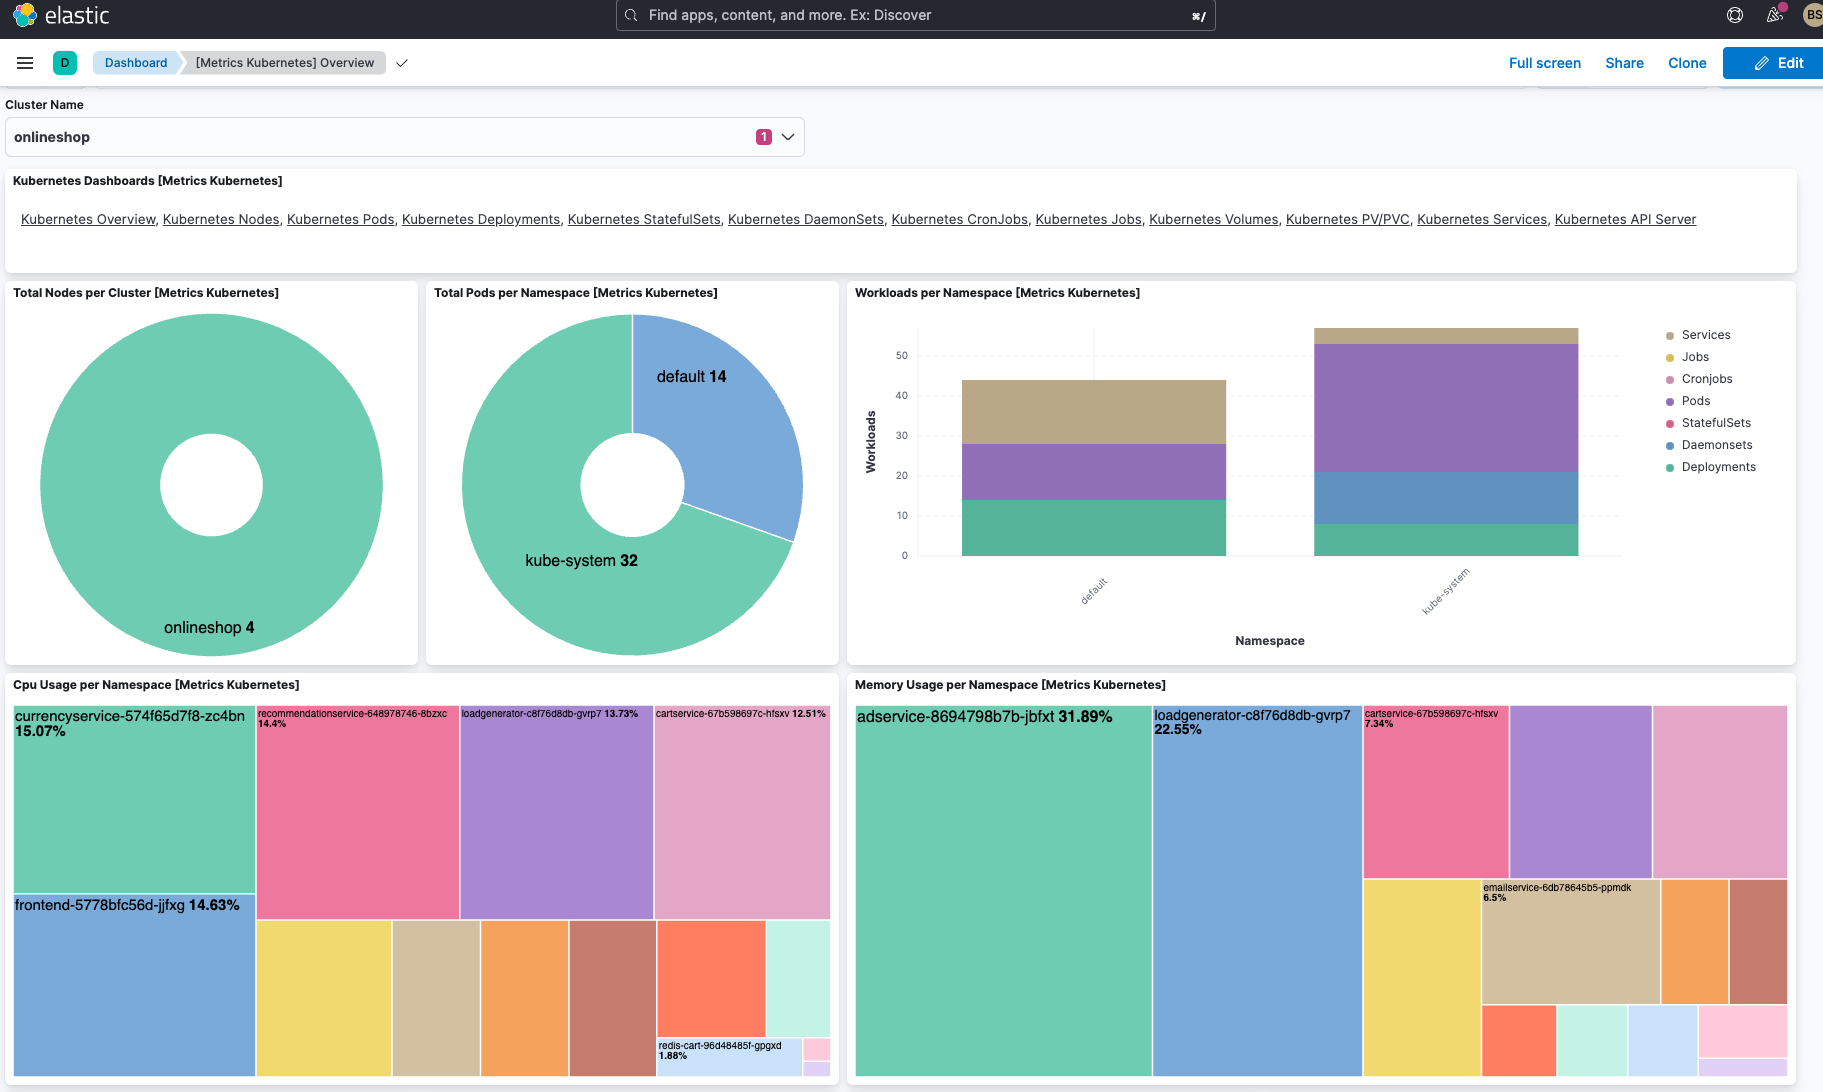
Für das webbasierte Kubernetes gibt es ein nutzerfreundliches Dashboard, in dem Ressourcen und Knoten sowohl einzeln als auch clusterübergreifend übersichtlich dargestellt werden. So erhalten Sie eine einfache Möglichkeit, containerisierte Anwendungen bereitzustellen, Ressourcen zu verwalten und Fehler zu beheben.
Das unten abgebildete von Elastic out of the box bereitgestellte Dashboard enthält alle Namespaces und definierten Speicherklassen des Clusters. Außerdem finden Sie darin einen Überblick über alle Knoten, Namespaces und persistenten Speichervolumes sowie ausführliche aggregierte Metriken zu den Knoten.
Für jede Anwendung im Cluster werden die Persistent Volume Claims (PVCs) angezeigt und Sie erhalten einen kompletten Überblick über alle Kubernetes-Ressourcen, die im Cluster ausgeführt werden. Außerdem wird angegeben, welche Anwendungen im jeweils ausgewählten Namespace laufen, wie viel Pod-Arbeitsspeicher gerade verwendet wird und wie viele Pods für das jeweilige Deployment oder ReplicaSet bereitstehen.
Kubernetes-Monitoring mit Elastic
Mit Elastic Observability können Sie Logdaten, Metriken und Traces aus Ihrem Kubernetes-Cluster und die Workloads, die auf ihm ausgeführt werden, auf einer zentralen Plattform zusammenführen. Das ermöglicht eine effektive Identifizierung von Problemen mit Ihren Anwendungsdiensten. Um den Zeitaufwand für die Datenanalyse zu verringern, können für die Machine-Learning-basierte Anomalieerkennung von Elastic Metriken und Logdaten aus Kubernetes-Clustern verwendet werden.
Mit seiner umfangreichen Funktionalität, die auf dem Markt ihresgleichen sucht, ermöglicht Ihnen die Kubernetes-Monitoring-Lösung von Elastic Echtzeiteinblicke in Ihr Kubernetes-Ökosystem. Die auf dem Elastic Stack aufsetzende Observability-Lösung macht es möglich, Kubernetes-Architekturen nahtlos bereitzustellen und zu betreiben. Durch die Zentralisierung sämtlicher Logdaten, Metriken und APM-Traces in einer einzigen Ansicht lassen sich auch komplexeste, hochgradig verteilte cloudnative Anwendungen effektiv steuern. Darüber hinaus profitieren Sie zusätzlich von verwertbaren Observability-Informationen über Ihren cloudnativen Tech-Stack sowie von Cloud-Monitoring, sodass Sie Probleme in den immer komplexeren Hybrid- und Multi-Cloud-Ökosystemen proaktiv erkennen und lösen können.
Kubernetes-Monitoring-Glossar
Im Folgenden finden Sie eine Zusammenstellung wichtiger Begriffe aus der Kubernetes-Welt.
Cluster
Satz von Arbeitsmaschinen (Worker Machines), den sogenannten „Knoten“ (Nodes), auf denen containerisierte Anwendungen ausgeführt werden. Jeder Cluster hat mindestens einen Knoten.
Knoten
Ein Knoten (Node) ist eine Arbeitsmaschine (Worker Machine).
- Master(-Knoten)
Veralteter Begriff, der als Synonym für Knoten verwendet wurde, auf denen sich die Steuerungsebene mit den Master-Komponenten befindet. - Arbeits(-Knoten)
Arbeitsknoten (Worker Nodes) hosten die Pods, die die Komponenten der Anwendungs-Workload sind.
Pod
Kleinstes und einfachstes Kubernetes-Objekt. Ein Pod steht für eine Gruppe laufender Container in Ihrem Cluster.
Container
Leichtgewichtiges und portables Executable-Image, das Software und alle ihre Abhängigkeiten enthält.
Controller
In Kubernetes sind Controller Kontrollschleifen, die den Zustand des Clusters überwachen und bei Bedarf Änderungen vornehmen oder anfordern. Jeder Controller versucht, den aktuellen Zustand des Clusters näher an den gewünschten Zustand zu bringen.
Kubelet
Agent, der auf jedem Knoten im Cluster ausgeführt wird. Er sorgt dafür, dass Container in einem Pod ausgeführt werden.
kube-proxy
Netzwerk-Proxy, der auf jedem Knoten in Ihrem Cluster ausgeführt wird und einen Teil des Kubernetes-Service-Konzepts implementiert.
etcd
Konsistenter und hochverfügbarer Key-Value-Speicher, den Kubernetes als Backing-Store für alle Clusterdaten verwendet.
Ingress
API-Objekt, das den externen Zugriff auf die Dienste in einem Cluster verwaltet, in der Regel über HTTP. Ingress kann Lastausgleich, SSL-Terminierung und namensbasiertes virtuelles Hosting bieten.