Using the Elastic Stack as a SaaS-Based Security Operations Swiss Army Knife
Editor's Note: With the release of Elastic Stack 7.11, the new alerting framework is now generally available. In addition to existing connectors to 3rd party platforms like Slack PagerDuty, and Servicenow, 7.11 adds Microsoft Teams to the list of built-in alerting integrations. Read more about this update in our alerting release blog.
At RS2, security is at the core of everything we do. Our main product, BankWORKS, is a fully featured, end-to-end integrated solution for all payment processing needs — from device transaction acquisition through to final settlement and ledger integration. The software is used by Banks, Processors and Payment Service Providers around the world, big and small, simple to complex. We also offer the product as a hosted managed service.
As a team, we are responsible for making sure that we minimise the risk of data being compromised or leaked, across all avenues of our business, and at the same time ensure that we meet several compliance requirements, all while avoiding disruption of day-to-day operations.
In November 2017, we were planning to grow our security team. Before getting approval for additional hires, though, we needed to alleviate some of the manual effort involved in dealing with incidents and security events. Here began our journey with the Elastic Stack.
The Journey from Proposal to Production
Initial Stages
Having previously used the Elastic Stack in other roles, and for personal projects, I wanted to introduce the product to the team. I felt it would fulfil all our requirements thanks to its extensive featureset and scalability.
In the first few days in my new role at RS2, I spun up Elasticsearch and Kibana instances (version 6 in this case) on a virtual machine on my laptop, installed a couple of Beats on the VM itself (packetbeat, auditbeat, metricbeat and filebeat) and sent all the data straight to Elasticsearch. The whole process took about an hour (40 minutes of which included the operating system ISO image download and install) to have meaningful data populated in Kibana.
I showed this to my colleague and he almost instantly agreed that this was the way forward, and we that should create a demo for the executive team using real data to emphasize effectiveness. We decided to include a few network devices and existing servers which wouldn't require any changes to our production network (using the different Beats and Logstash), as well as some third party integrations.
Cloud Evaluation
In previous roles, I hosted large Elastic deployments spanning several servers. However, I had never really looked at the Elastic Cloud offering. RS2 happened to be on an "infrastructure freeze" due to their imminent migration to the cloud. This, coupled with tight deadlines and limited resources, led me to explore Elastic Cloud. As a security professional, I was skeptical. I wanted to make sure that the service was designed with a degree of security in mind.
Once I had my cluster, I carried out a few quick security tests to see if I can spot any blatant vulnerabilities or weaknesses. Here's what I discovered:
- Elastic lets you choose between AWS and GCP as a backend cloud provider, so all their security features are inherited, along with their compliance certifications.
- Segregated networks are used for each cluster, not the default subnets for each provider.
- Modern TLS settings and ciphers are used for both the Elasticsearch and Kibana URL's
- Elasticsearch transport ports are randomised
- The URLs for each instance are also completely randomised, so it isn't possible to enumerate customer names
- Direct IP access is not possible without the cluster ID
- The latest versions of the Elastic Stack is used, along with a recent version of Java 8.
Putting it all Together
Now that I had my cloud cluster, I had to design the data flows. The diagram below outlines the architecture for the POC.
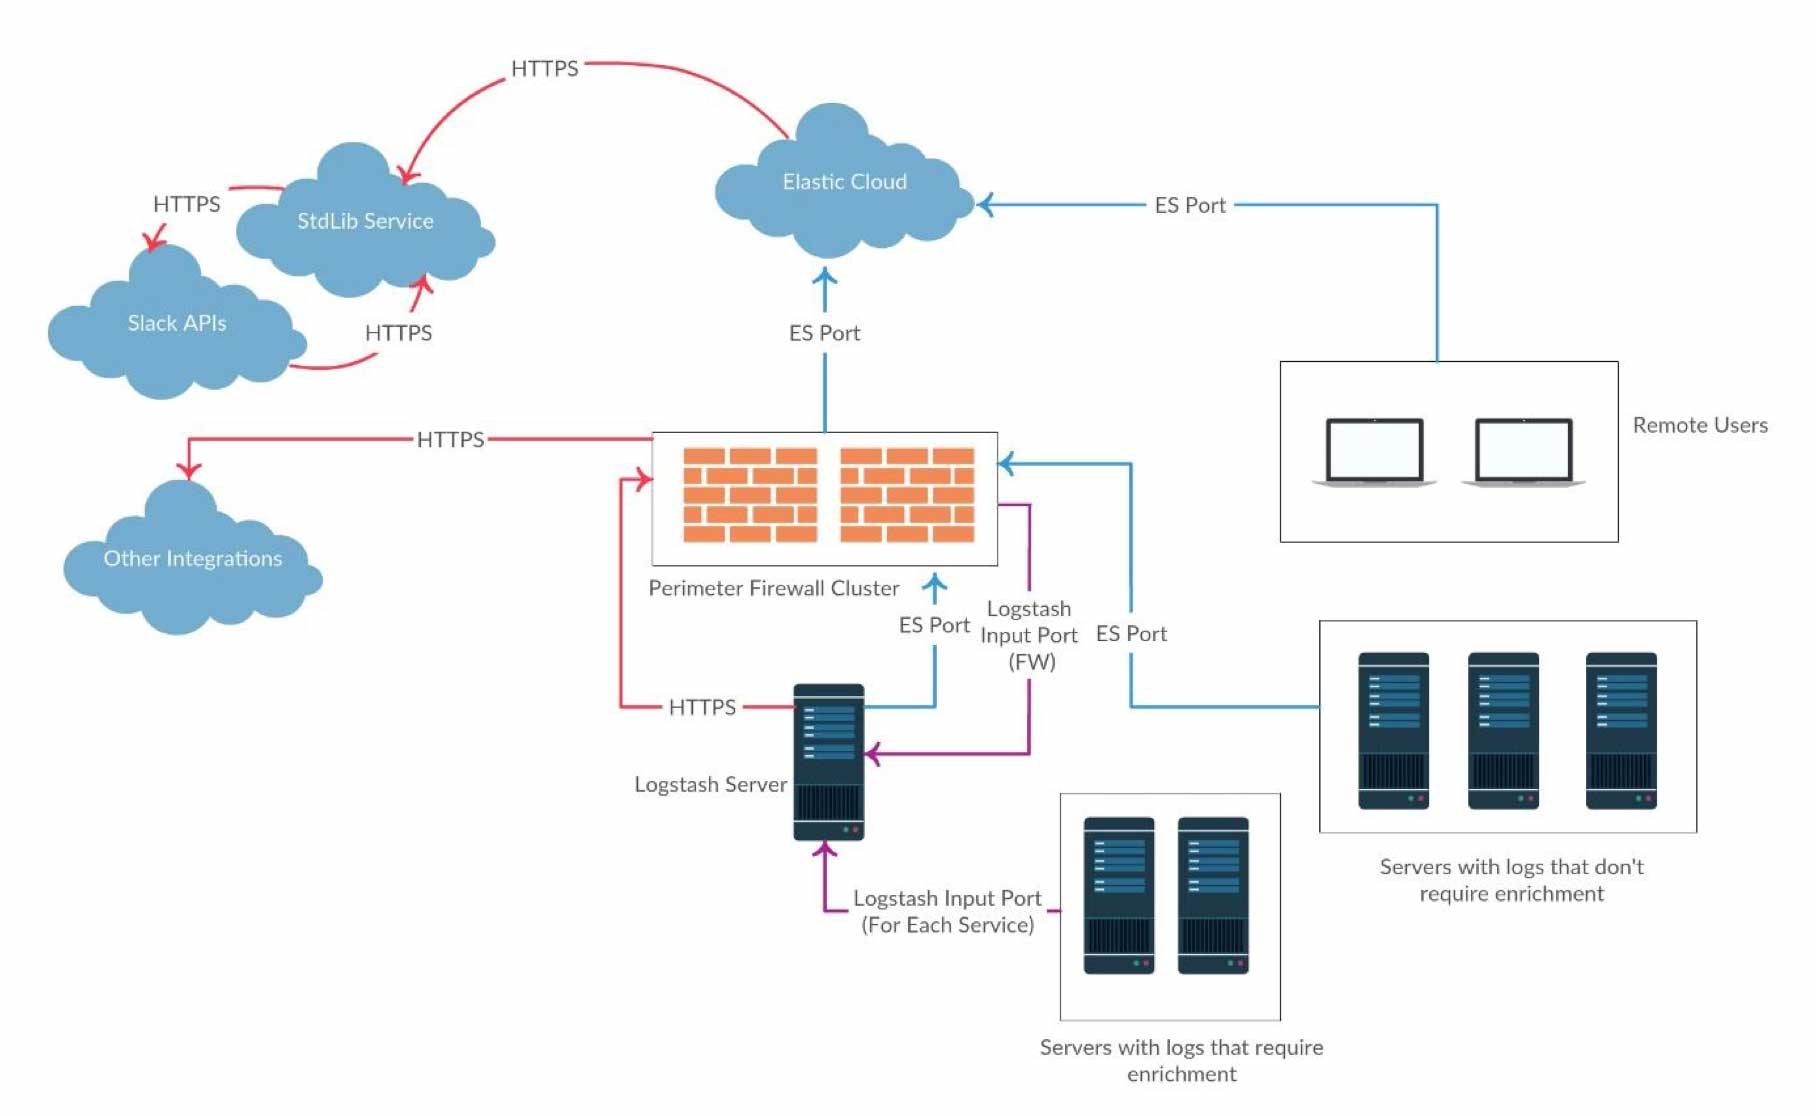
Since we had X-Pack available to us, Watcher was utilised heavily as part of the alerting framework. This was integrated with a custom Slackbot by using the Watcher webhook actions.
Demo Preparation – Working with the Data
The first step was to parse and enrich our logs as much as possible. In a security context, enrichment is key for solving incidents quickly, as it greatly reduces the investigation time for analysts. It also helps to filter out false positives. Using several Logstash filter plugins, I was able to do this with ease. Additionally, to cater for our existing log archiving tool, I was able to set up multiple Logstash outputs to simultaneously send data to our Elastic cluster and the existing archiving tool.
Below is a list of some of the enrichment operations added to our parsed logs:
- GeoIP data (Location and ASN)
- Malware IP lookups
- Allowed logins user lookups
- User agent parsing
- URL decoding
This is a partial list of enrichments set up for the POC. Many more were added once we made the move to production.
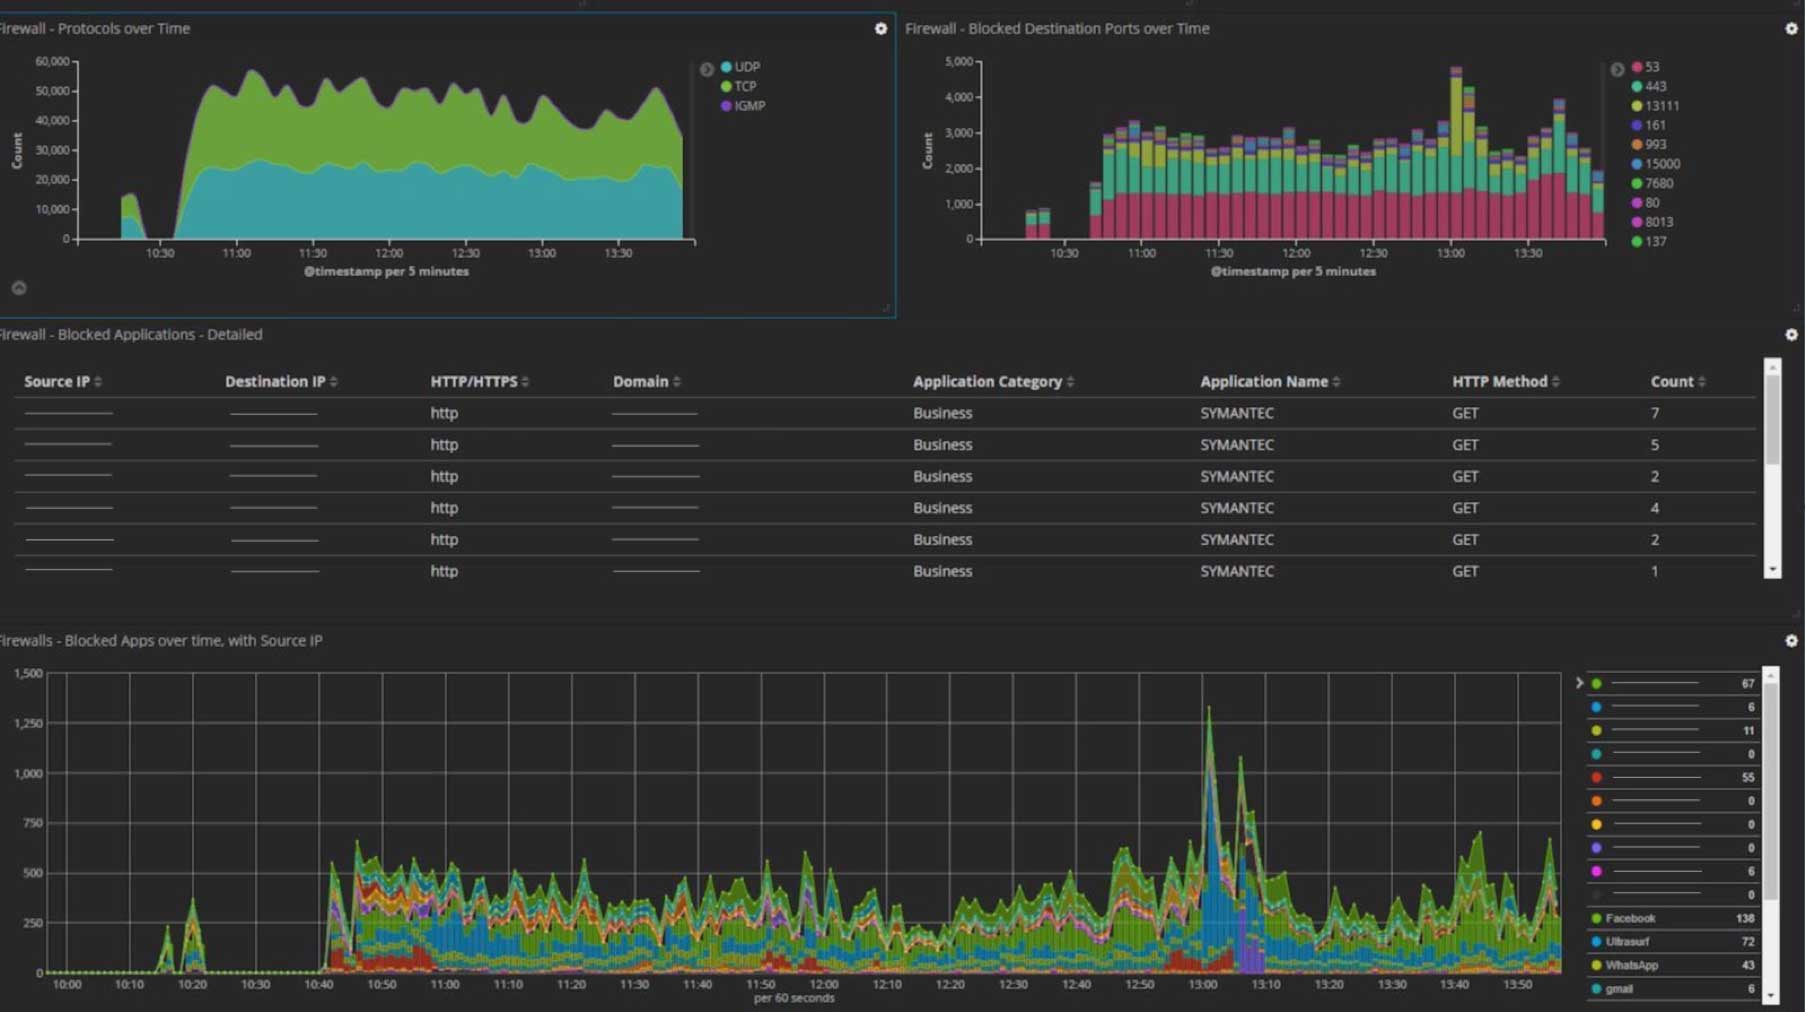
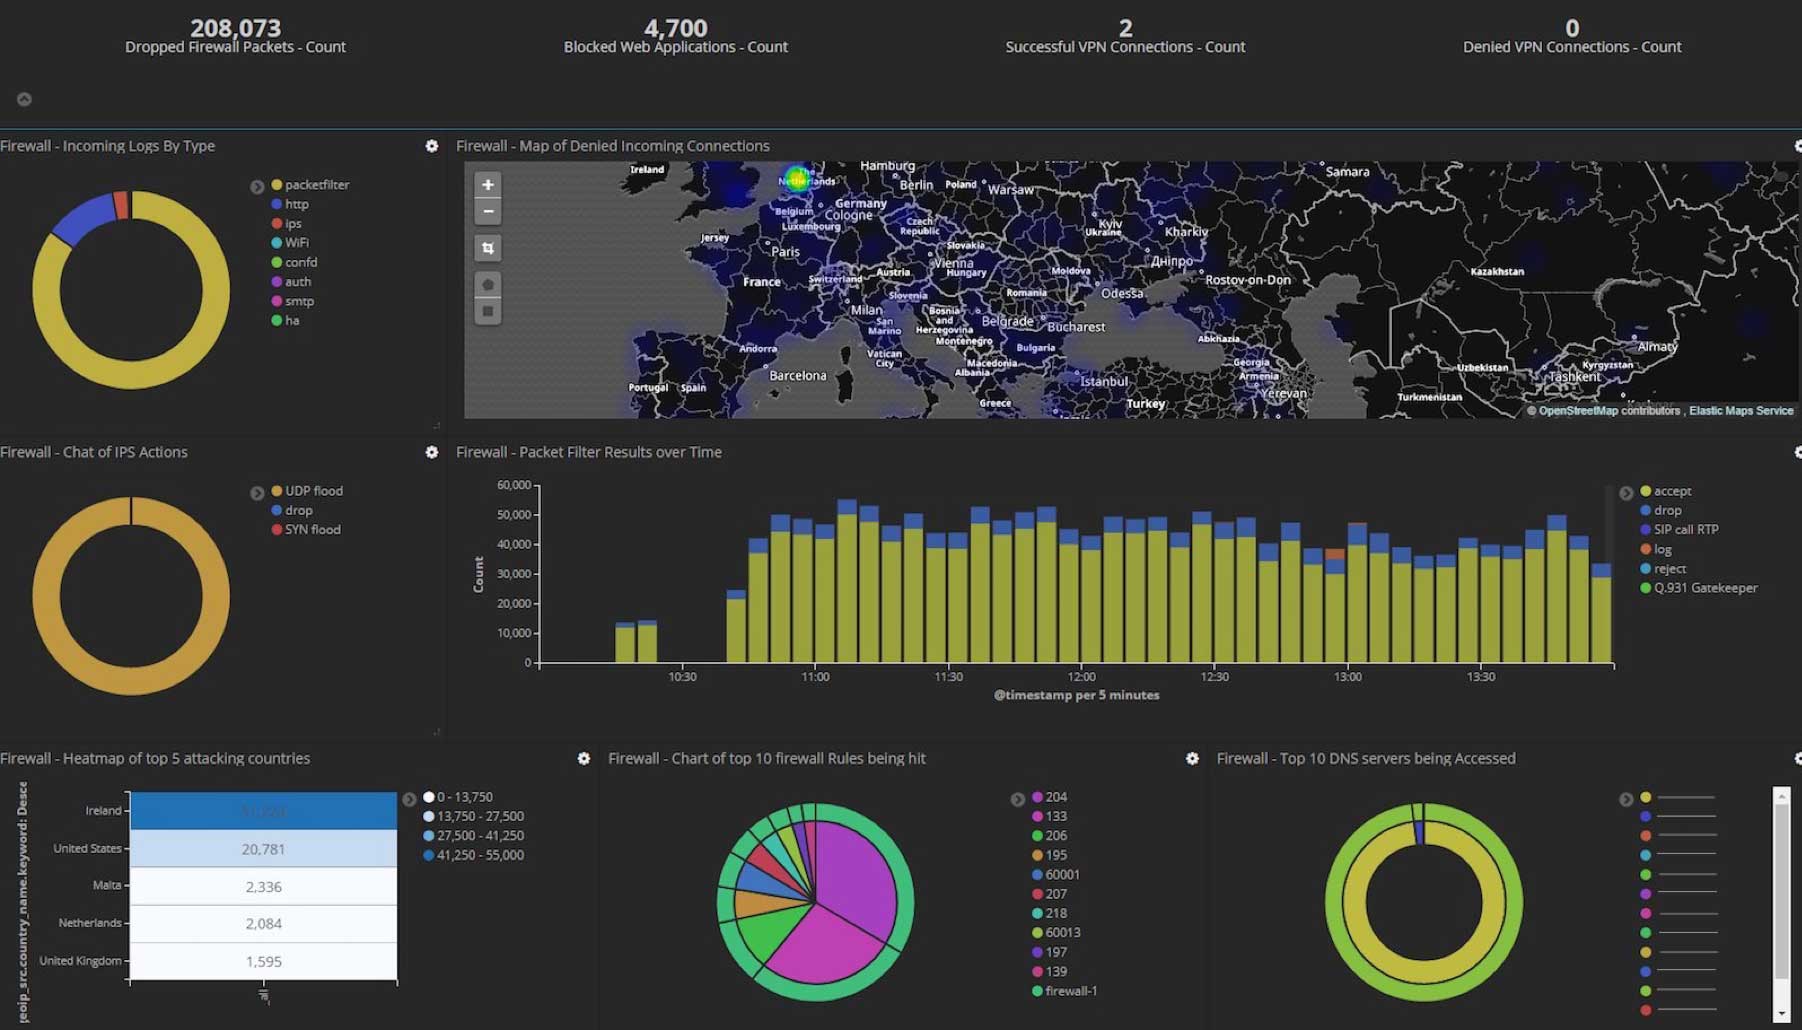
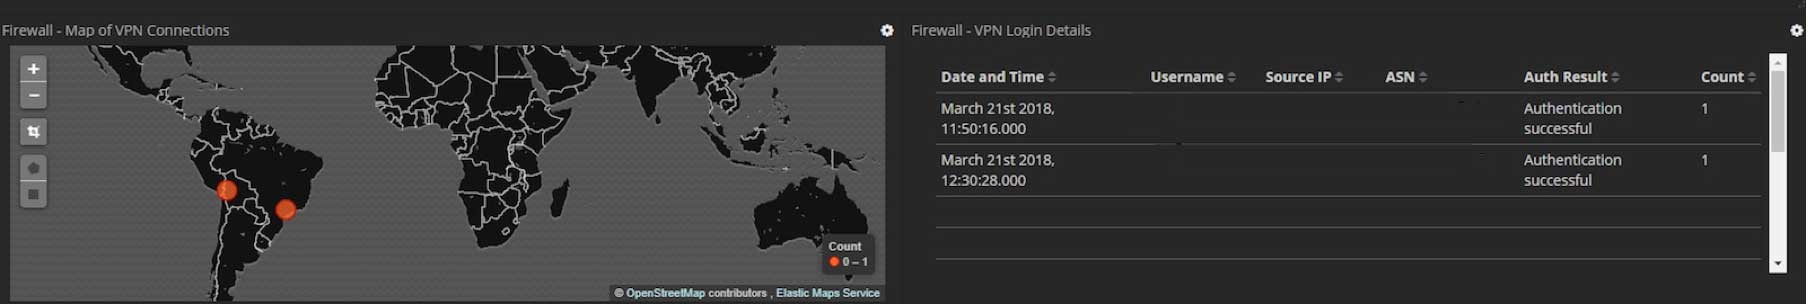
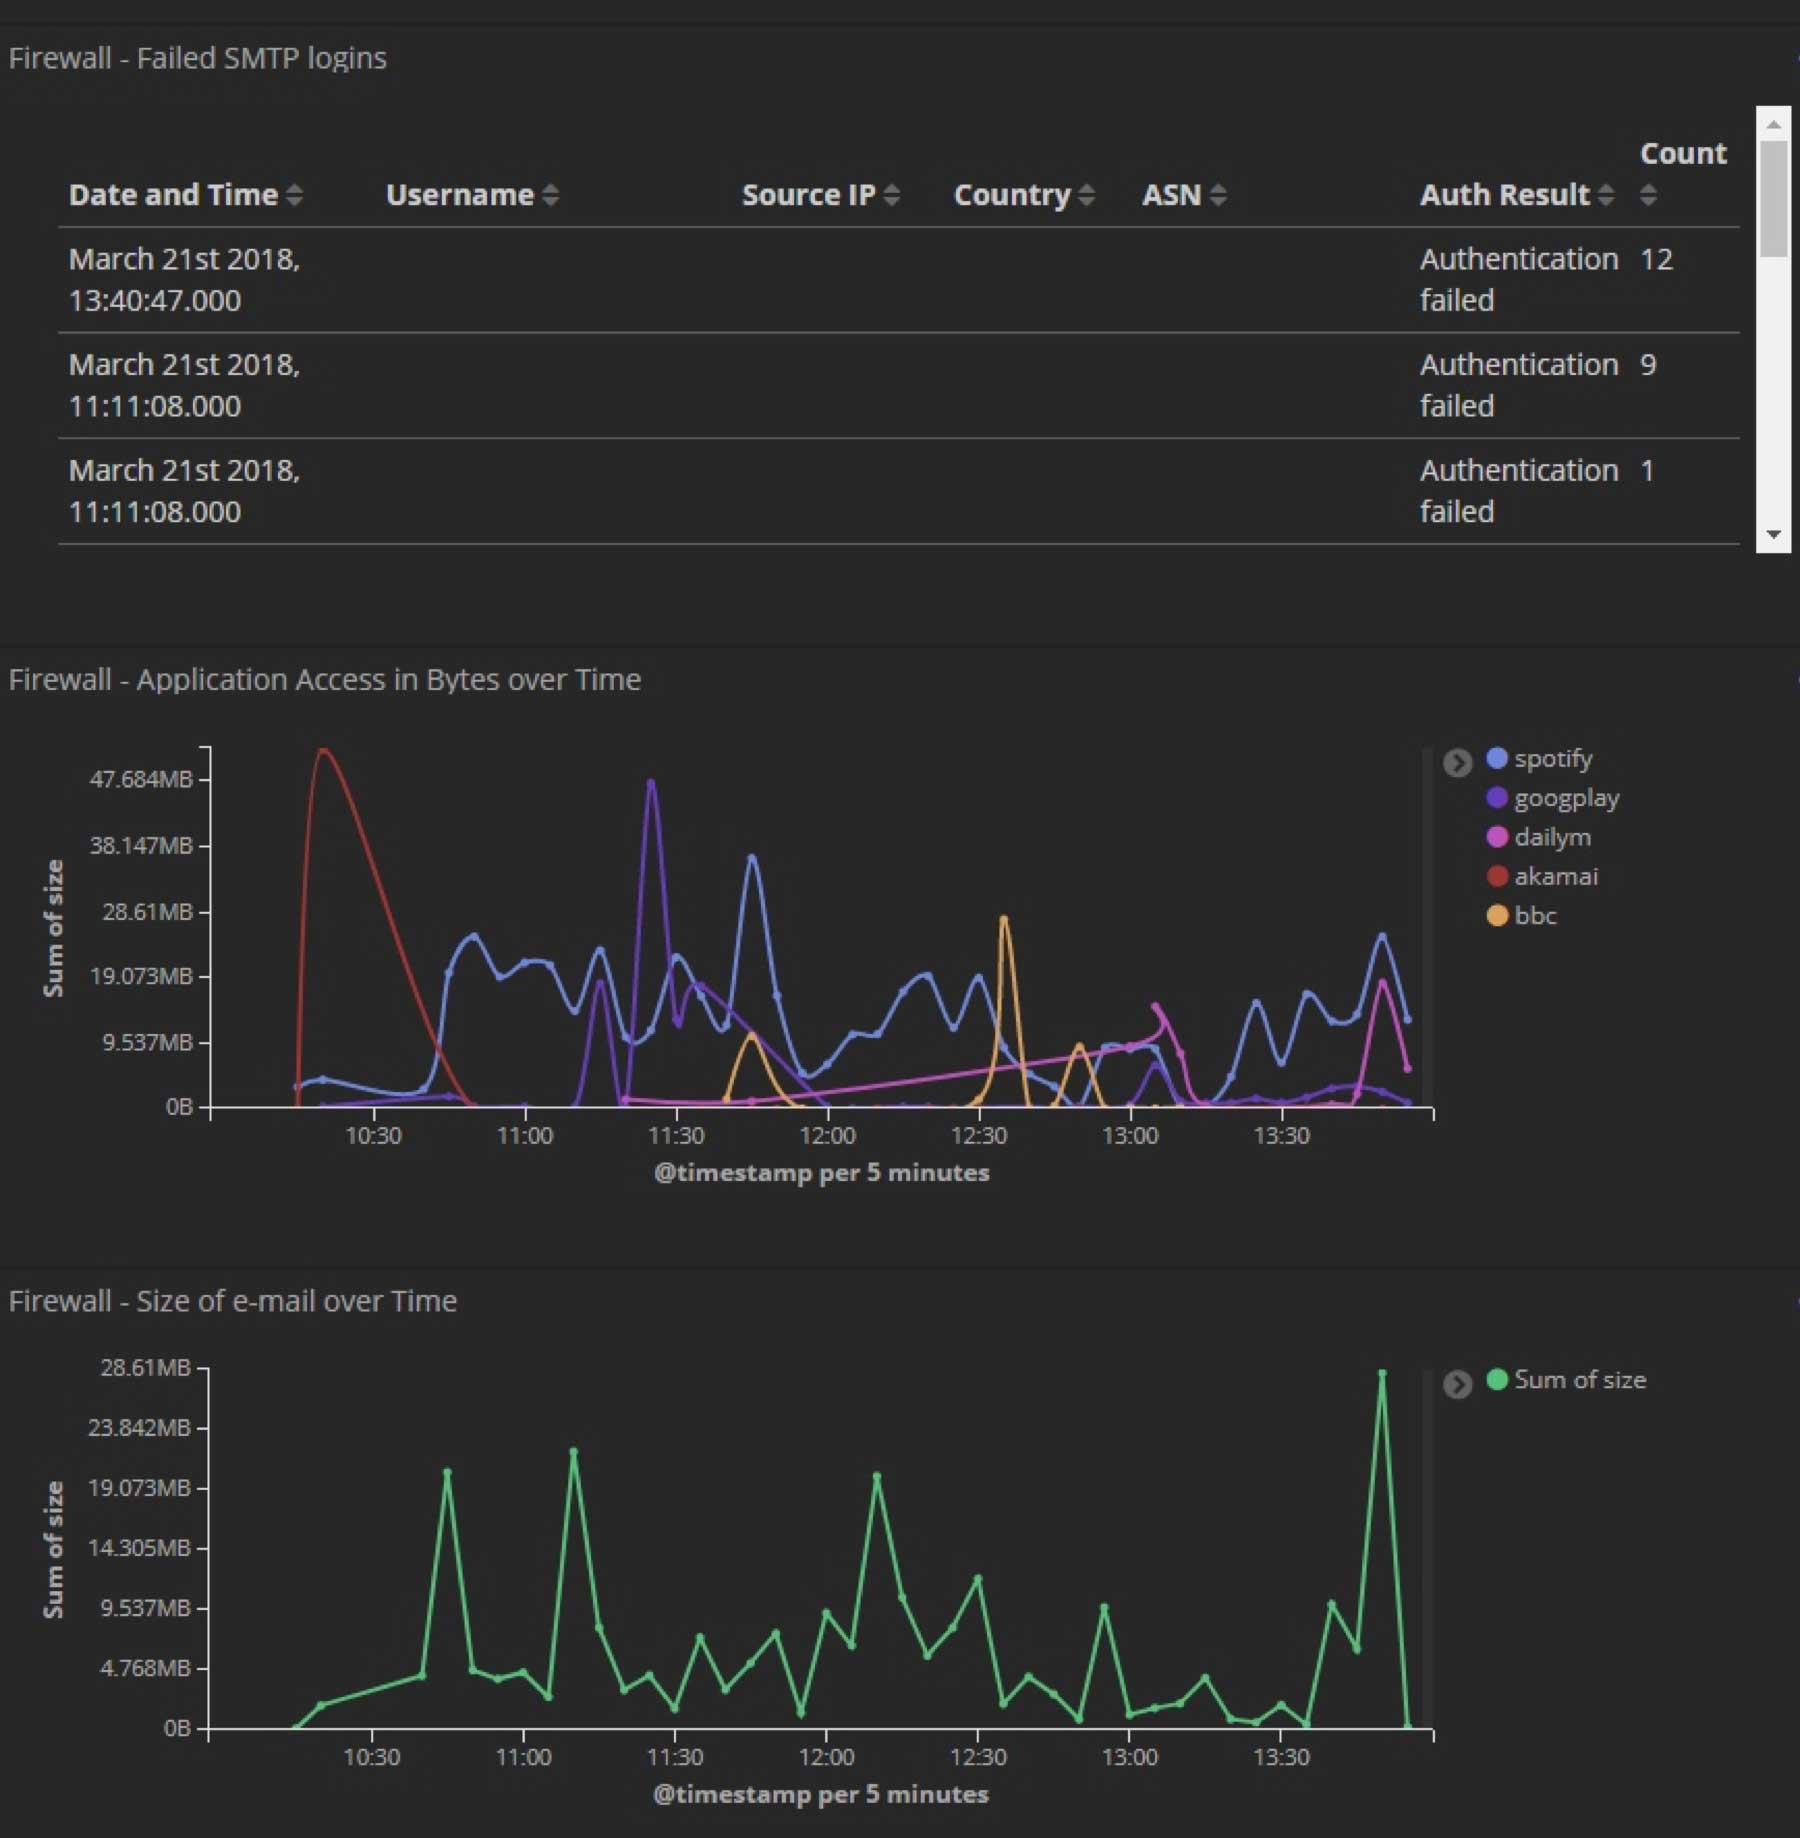
Now that I had all this data nicely parsed, I created custom dashboards to work alongside the inbuilt ones to highlight some of the enrichment features previously mentioned. Here are just a few examples of some of the custom Kibana dashboards we developed for the POC (all sensitive data has been removed):
Additionally, I added some other nifty integrations for the demo to show how simple it is to add data into Elastic. At the end of the day, it's just another index. One example of this was an integration with the popular service "Have I been Pwned" by Troy Hunt. The service provides a very handy REST API, which allows you to query if an email address is detected in publicised data breaches. A watch was created to alert us to any new entries for our domain.
Alerting
The idea behind the alerting framework in the POC (to later be used in production) was to have everything actionable through Slack. Below are some examples of the manipulated data within the Slackbot. Everything an analyst needs to kick off an investigation is included. The data used was gathered by different Beats and the parsed network device logs via Logstash.
Some of the datasets included:
- SMTP relay logs, authentication logs and packetfilter logs from our Firewalls
- DNS requests at a packet level, using Packetbeat
- SSH/SFTP logs, using a combination of Wazuh and Filebeat
- A list of processes and their states, using Metricbeat
- Outbound network socket monitoring, using Auditbeat on *nix systems
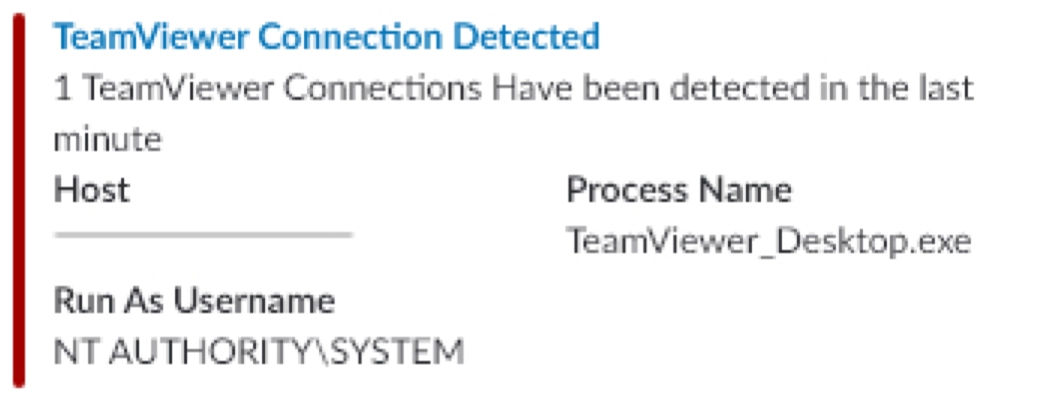
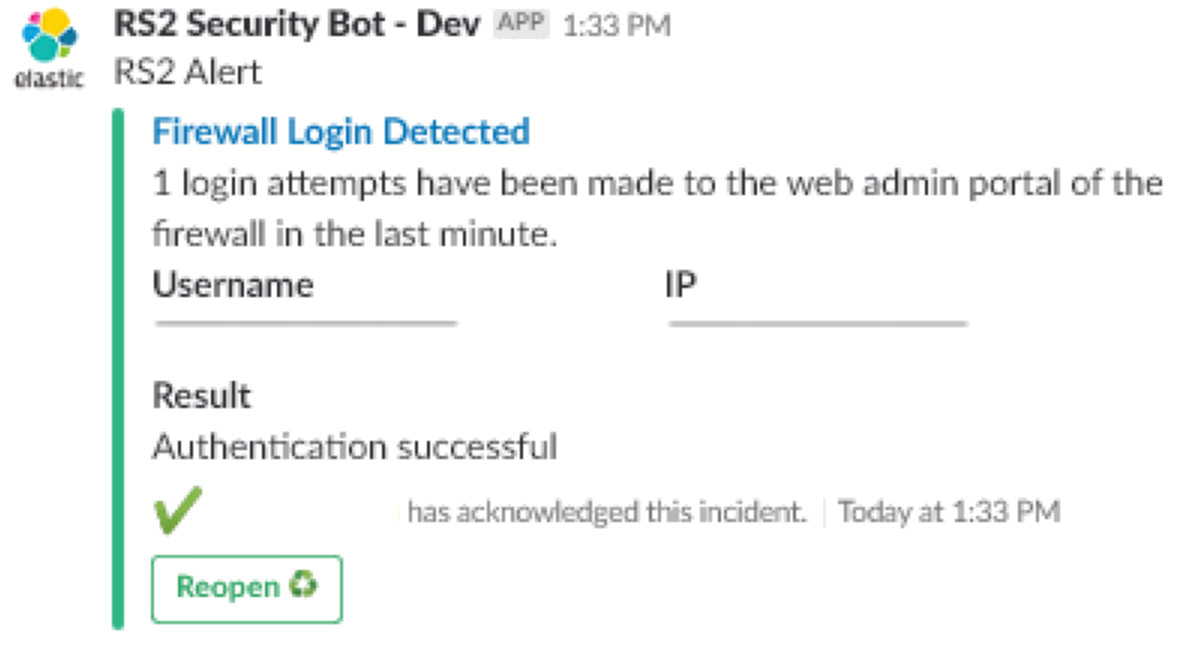
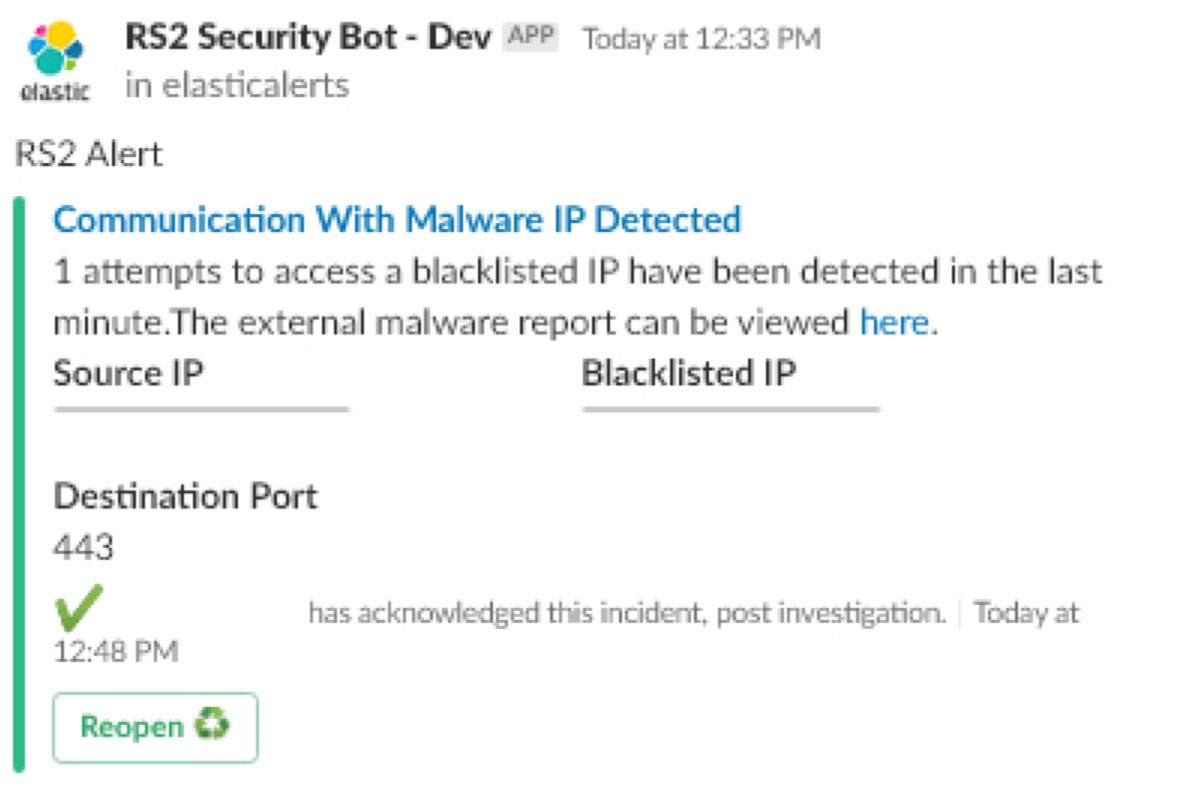
Here are just a few examples of some of the Slackbot alerts we developed for the POC (all sensitive data has been removed):
- TeamViewer Connection Alert
- Firewall Login Alert
- Malware Alert
The Results
Needless to say, the POC was extremely successful and we got approval to move to production. To reiterate, the main points that got us through this POC so smoothly:
- The exceptional ease and speed of using Elastic Cloud and everything it encompasses (integrated backups out of the box, resiliency and high availability, bundled X-Pack for our size of deployment)
- The ability to take in any data and turn it into something useful and actionable very quickly (the POC, from start to finish, took about 3 full days to implement, including all the tasks mentioned in this post – parsing, dashboards, enrichment, the alerting framework, so on and so forth)
- The fact that this could be done in parallel to all existing processes, without interruption
Dealing with Upgrades
After a few weeks in production, there was an update released by Elastic. Having previously upgraded large Elastic deployments with X-Pack, I was very curious to see how this was carried out by their cloud platform. It turned out to be as simple as selecting the new version in a dropdown menu. Everything else was done automatically, without any interruptions.
Conclusion
Our journey with Elastic obviously did not end here. We are constantly adding more data sources, more enrichment (like correlation with our HR systems to get user vacation data, and physical access systems to know if someone is and should be in the building or not) and adding alerts on the fly based on newly discovered threats and malicious activity. We are also working on integrating with additional internal tools that we use.
We are excited about the future of security analytics with Elastic. With every update, Elastic releases additional components that make the lives of analysts easier, and their jobs more satisfactory. Additionally, we are equally as excited for the upcoming upgrades to Elastic Cloud. Without a doubt, RS2 will continue to benefit from the extensive feature sets, not just for security analytics, but throughout the entire organisation.