How to find anomalies in the sea of Splunk Zeek data


 Share on Twitter
Share on Twitter

 Share on LinkedIn
Share on LinkedIn

 Share on Facebook
Share on Facebook

 Share by Email
Share by Email

 Print this page
Print
Do you think you may have Indicators of Compromise (IOCs) floating around in the sea of your Splunk deployment’s Zeek data? Are you concerned that you may not learn about anomalous behavior until it’s too late? If so, then keep reading to learn how Elastic® can help — but first, let me explain the history behind this.
Splunk is good at getting data into the platform, specifically unstructured data from log files and API endpoints. It was built on the design principle of schema on read. The benefit to the schema on read design principle is that it theoretically allows you to quickly onboard any unstructured data source so that you can search it, analyze the results, and subsequently perform some action. The tradeoff that’s realized with schema on read is that it inherently adds latency to the search, and there is a latency penalty that’s incurred on each and every time you search for something. Additionally, the more complex your schema, the more data you search, and the longer you have to wait for the results. It was a revolutionary design at its inception when there was not a common schema for log files, but that has now changed.
Elastic is committing our Elastic Common Schema (ECS) to the OpenTelemetry project. The goal is to converge ECS and OTel Semantic Conventions into a single open schema for metrics, traces, and now logs that is maintained by OpenTelemetry. This common schema will ultimately provide both cost and performance benefits to customers. However, we do realize the benefit of schema on read as it relates to custom log files and current data onboarding workflows, which is why we have been working on a solution called ES|QL to solve those problems.
Now for the fun stuff! I’m going to show you how to use the Elastic Agent Zeek integration to pull in Zeek sourcetypes from your Splunk deployment.
Getting started with the Elastic Agent Zeek integration
It’s a relatively simple process to ingest data to Elastic via Splunk, and we have documented how to get started with data from Splunk. However, the value is not just getting the data into Elastic — the value is that you’ll be able to run built-in anomaly detection jobs on that data with just a few clicks to set up.
Before I get started, it must be noted that pulling data from Splunk’s API is not the most efficient way to get Zeek data into Elastic, but it is a quick and easy way for you to show value to your organization as part of a proof of concept event. Let’s break this down into three simple steps.
Splunk API access and sourcetype data: I’ll show you how to set up a time-bound token that allows access to the Splunk API and how to capture the Zeek sourcetypes that are needed for the Elastic Agent integration.
Elastic Agent Zeek integration configuration and verification: We’ll use the sourcetypes that were captured from the Splunk deployment to configure the integration, and then we’ll verify that the data is coming in and we’re able to search for the data as well as view the default Zeek dashboard.
Preconfigured machine learning (ML) anomaly detection jobs setup: We’ll set up preconfigured ML jobs for anomaly detection and review results in Elastic’s Anomaly Explorer.
Splunk API access and sourcetype data
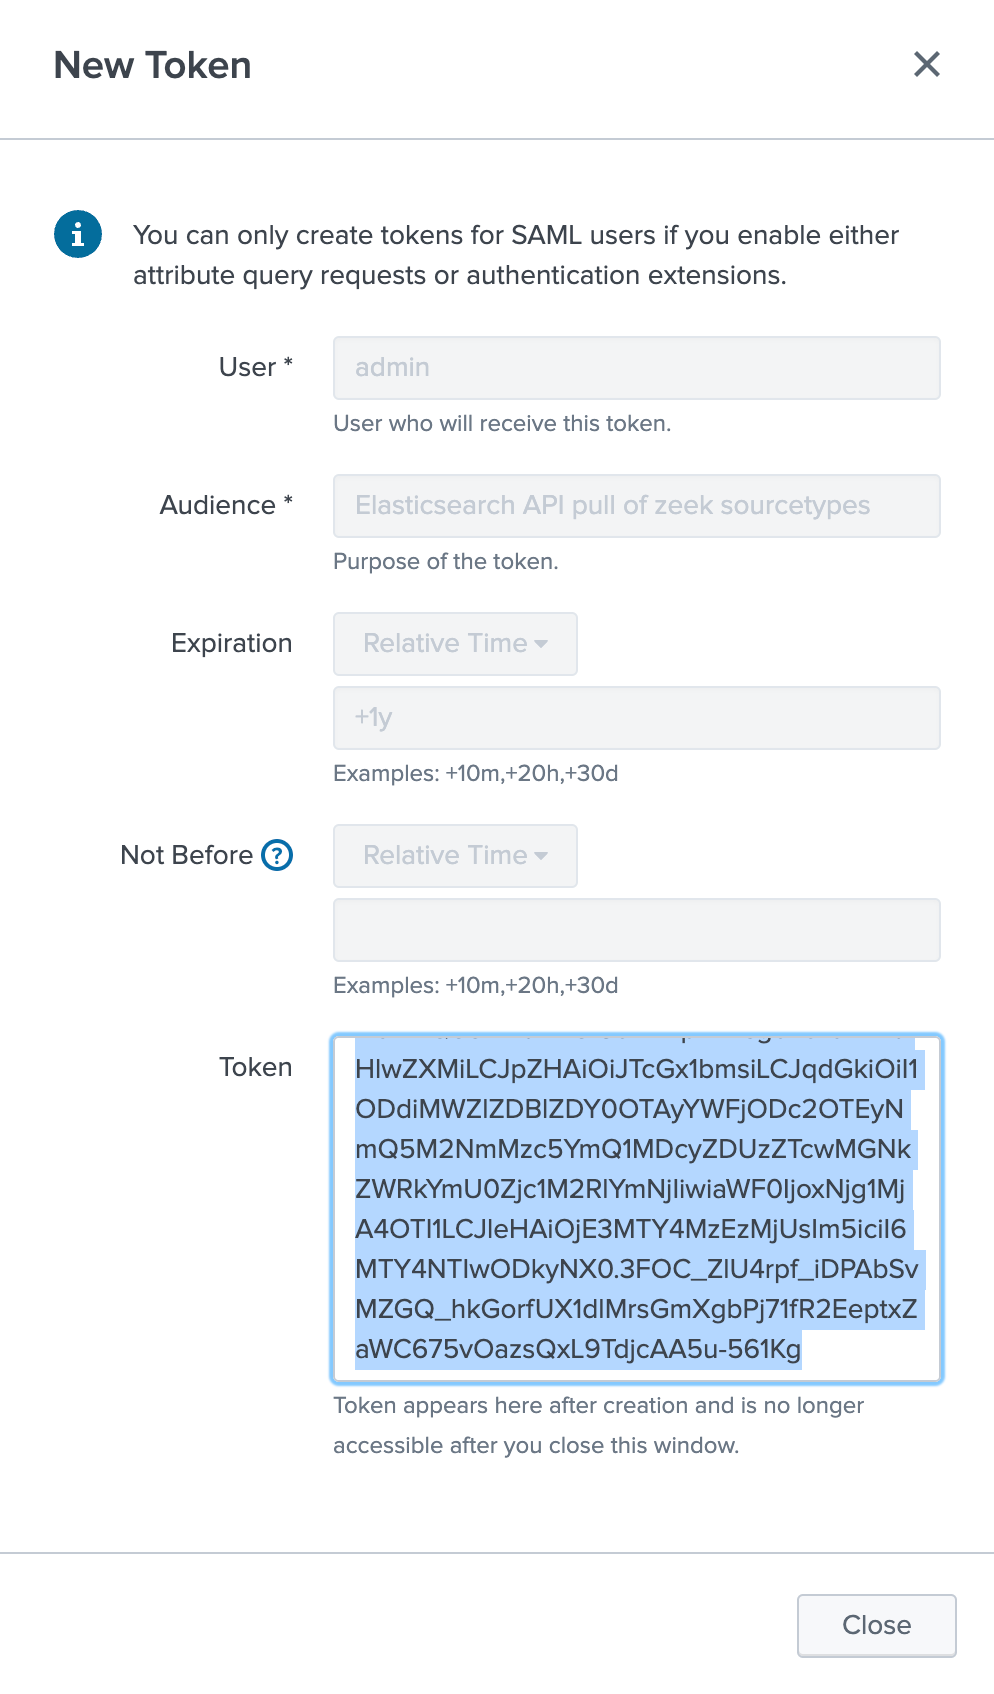
Log in to Splunk and create a new token for API access. Before you create the token, ensure that the user that the token is created for has access to where the Zeek data is indexed. You’ll need to provide the user, a purpose for the token, and an expiration date and then select Create. I’m using admin for this illustration, but you’ll likely use a user that has restricted access. Once the token appears, copy and save it as you’ll need it for an input to the Elastic Agent Zeek integration.
The next step is to capture the names of the Zeek sourcetypes that are defined in your deployment. The sourcetype names can be different per deployment depending on how the data was onboarded, so it’s important to capture the name as defined in your deployment. In my deployment, I have Zeek data getting sent to a Zeek index, so I’m simply searching for the data in the Zeek index and selecting the sourcetypes in that index.
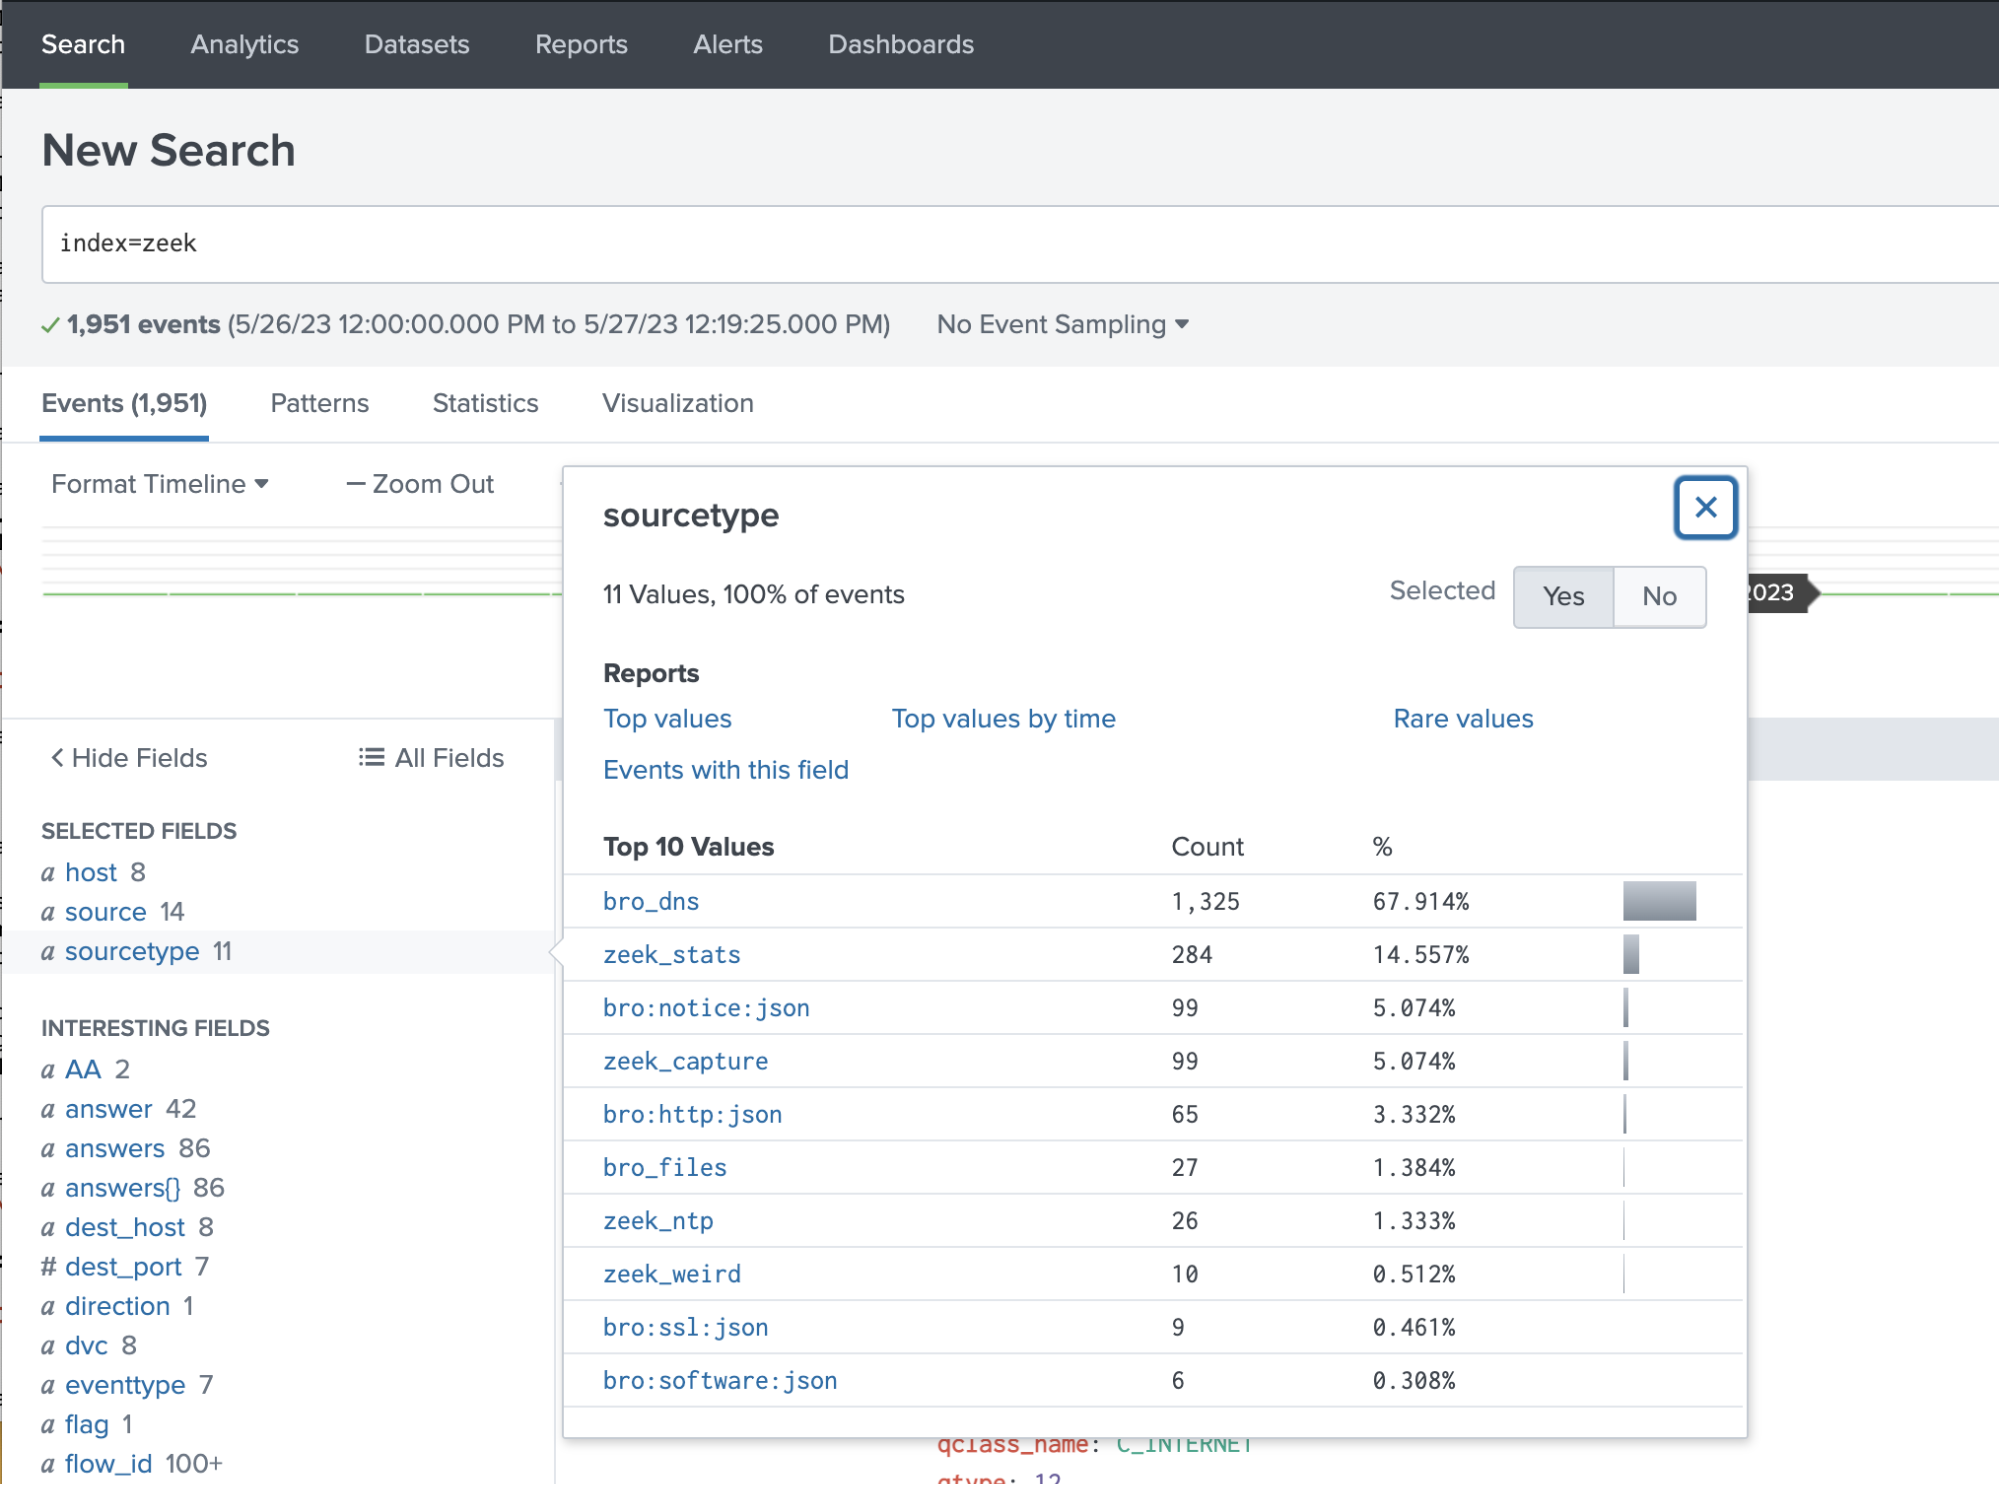
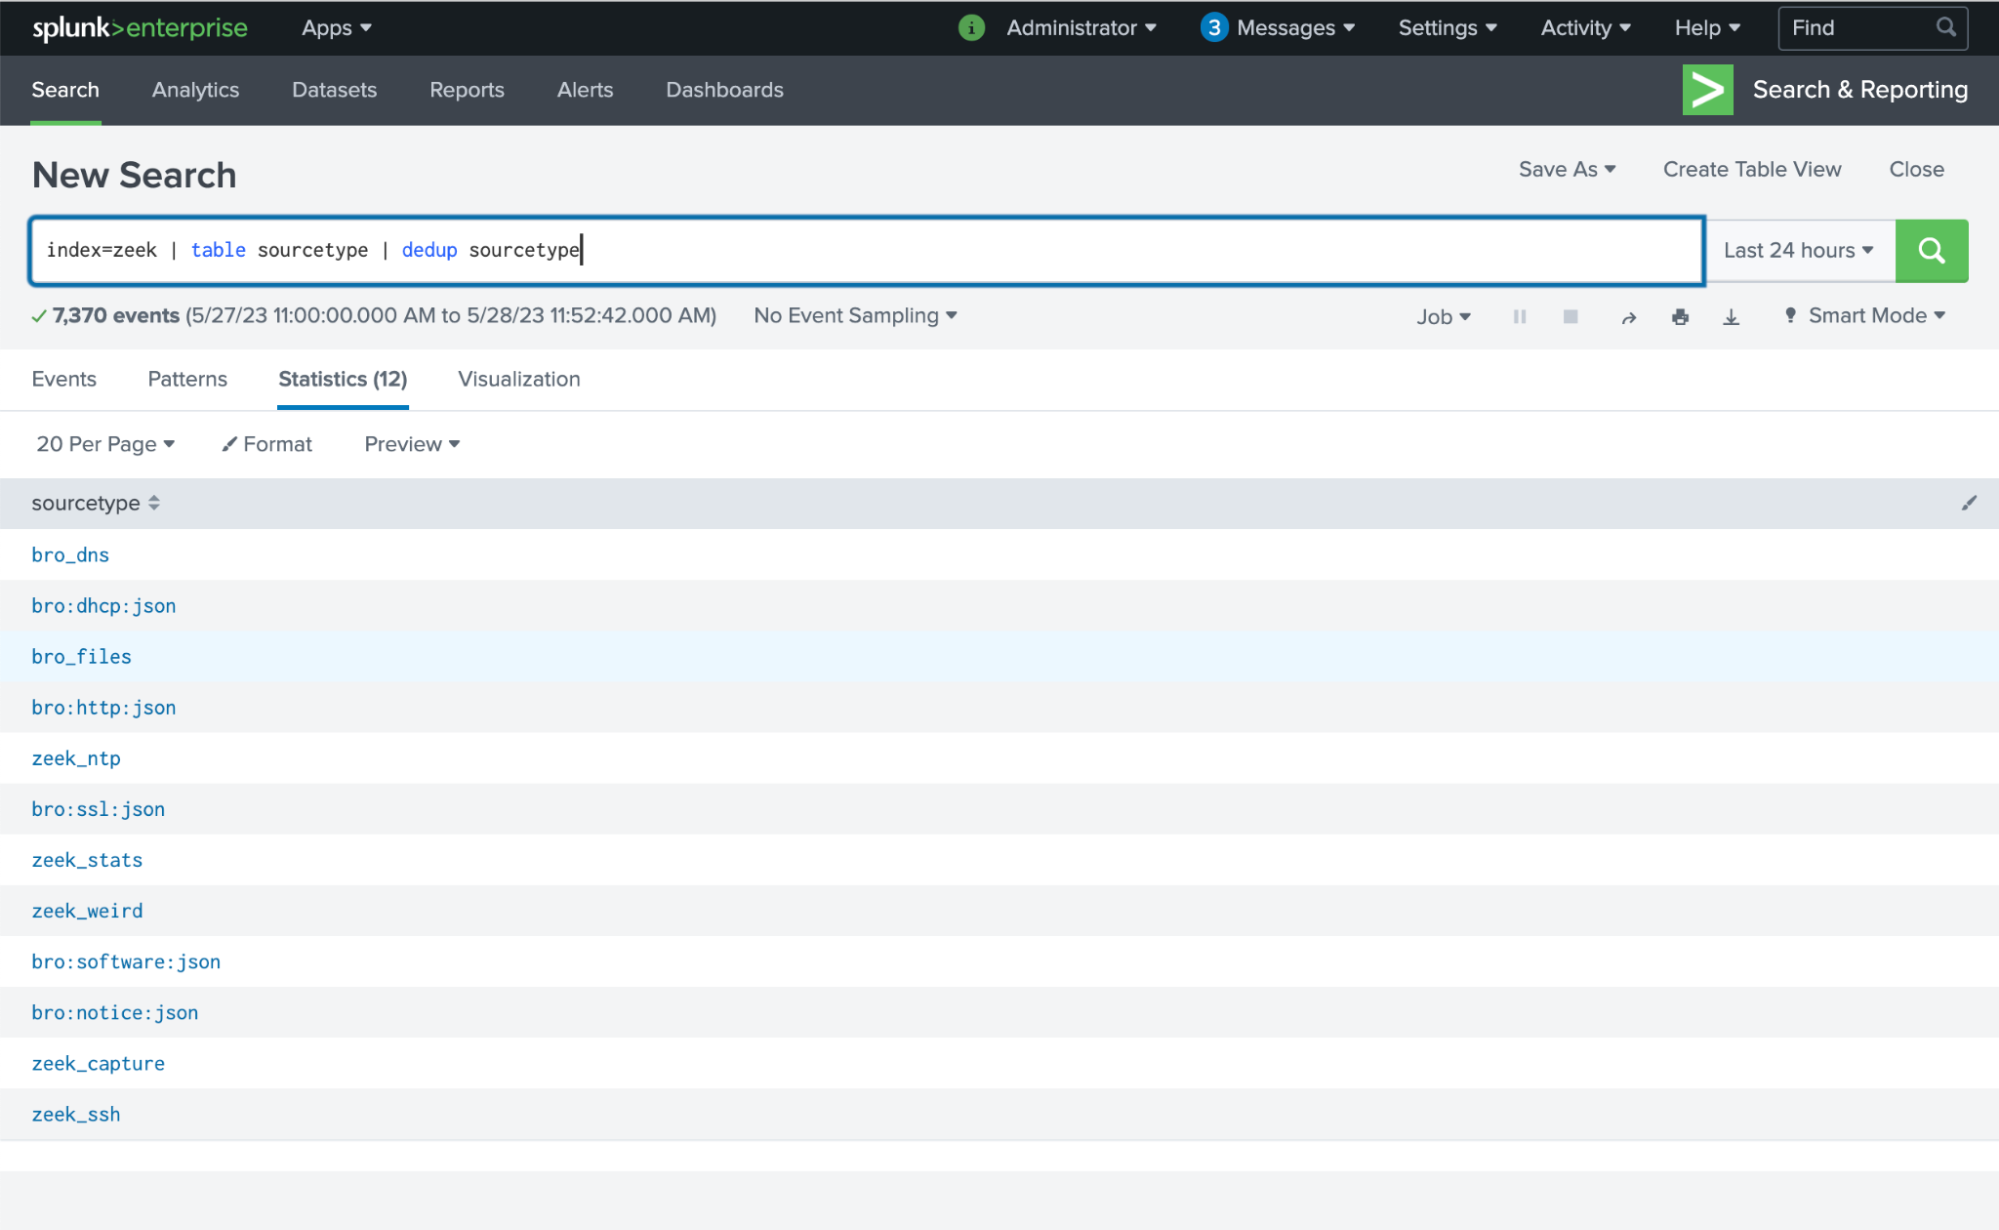
However, this only shows the top 10 sourcetypes, so if you have more like I do, then create a SPL command to put the sourcetypes in a table. Save the names of these sourcetypes.
Elastic Agent Zeek configuration and verification
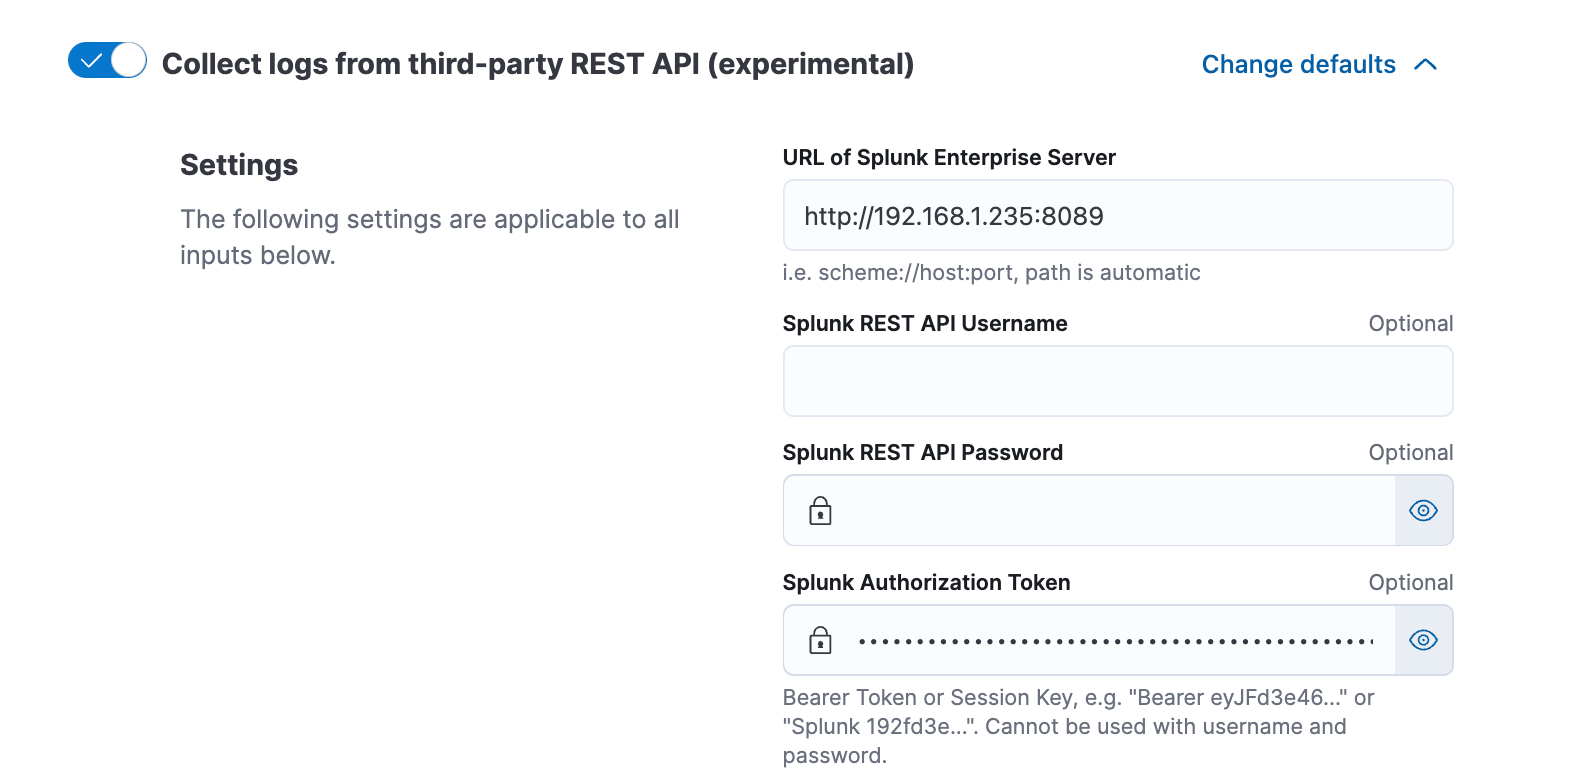
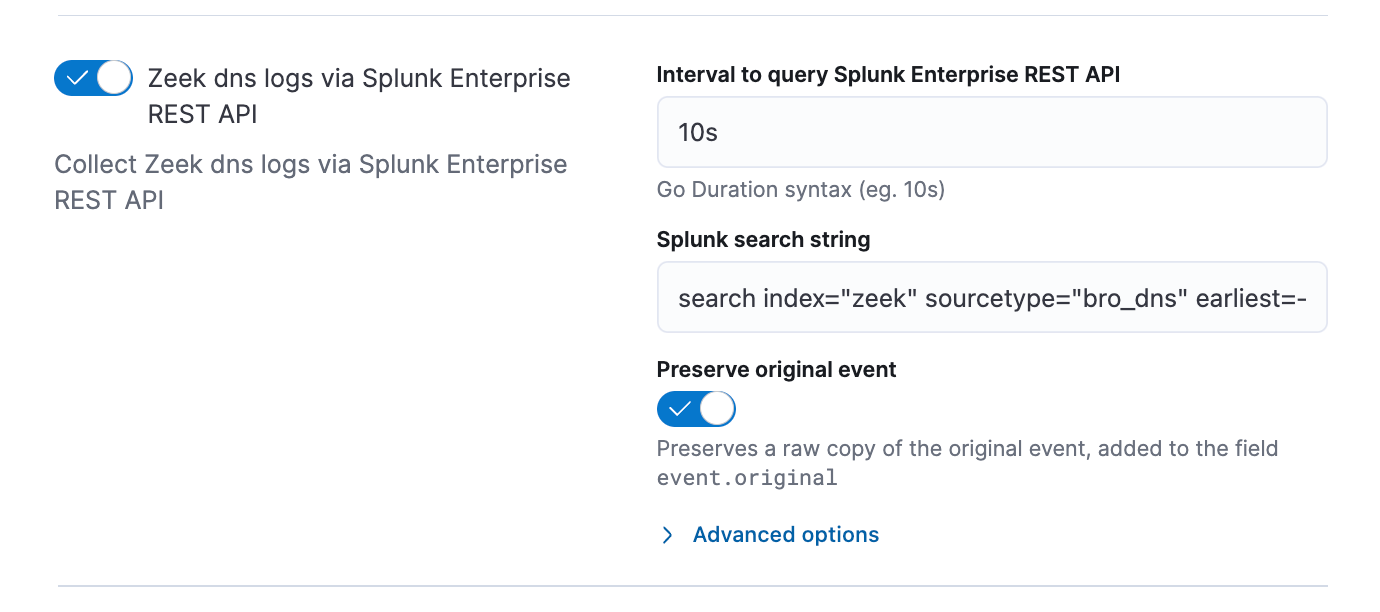
The first step here is to install a Fleet managed Elastic Agent with a policy that includes the Zeek integration. Navigate to the integration settings and enable “Collect logs from third-party REST API (experimental).” Enter the settings for your Splunk URL and port number along with the authorization token that you created to access the Splunk API.
For each of the sourcetypes that you have ingested into your Splunk deployment, enable the selector and update the Splunk search string to match the search that you want to send to Splunk. The search needs to include sourcetype name, and it may need to include the index name depending on the default index settings the Splunk user assigned along with a time modifier. At a minimum enable DNS, Http, and SSL logs, and then save the integration changes.
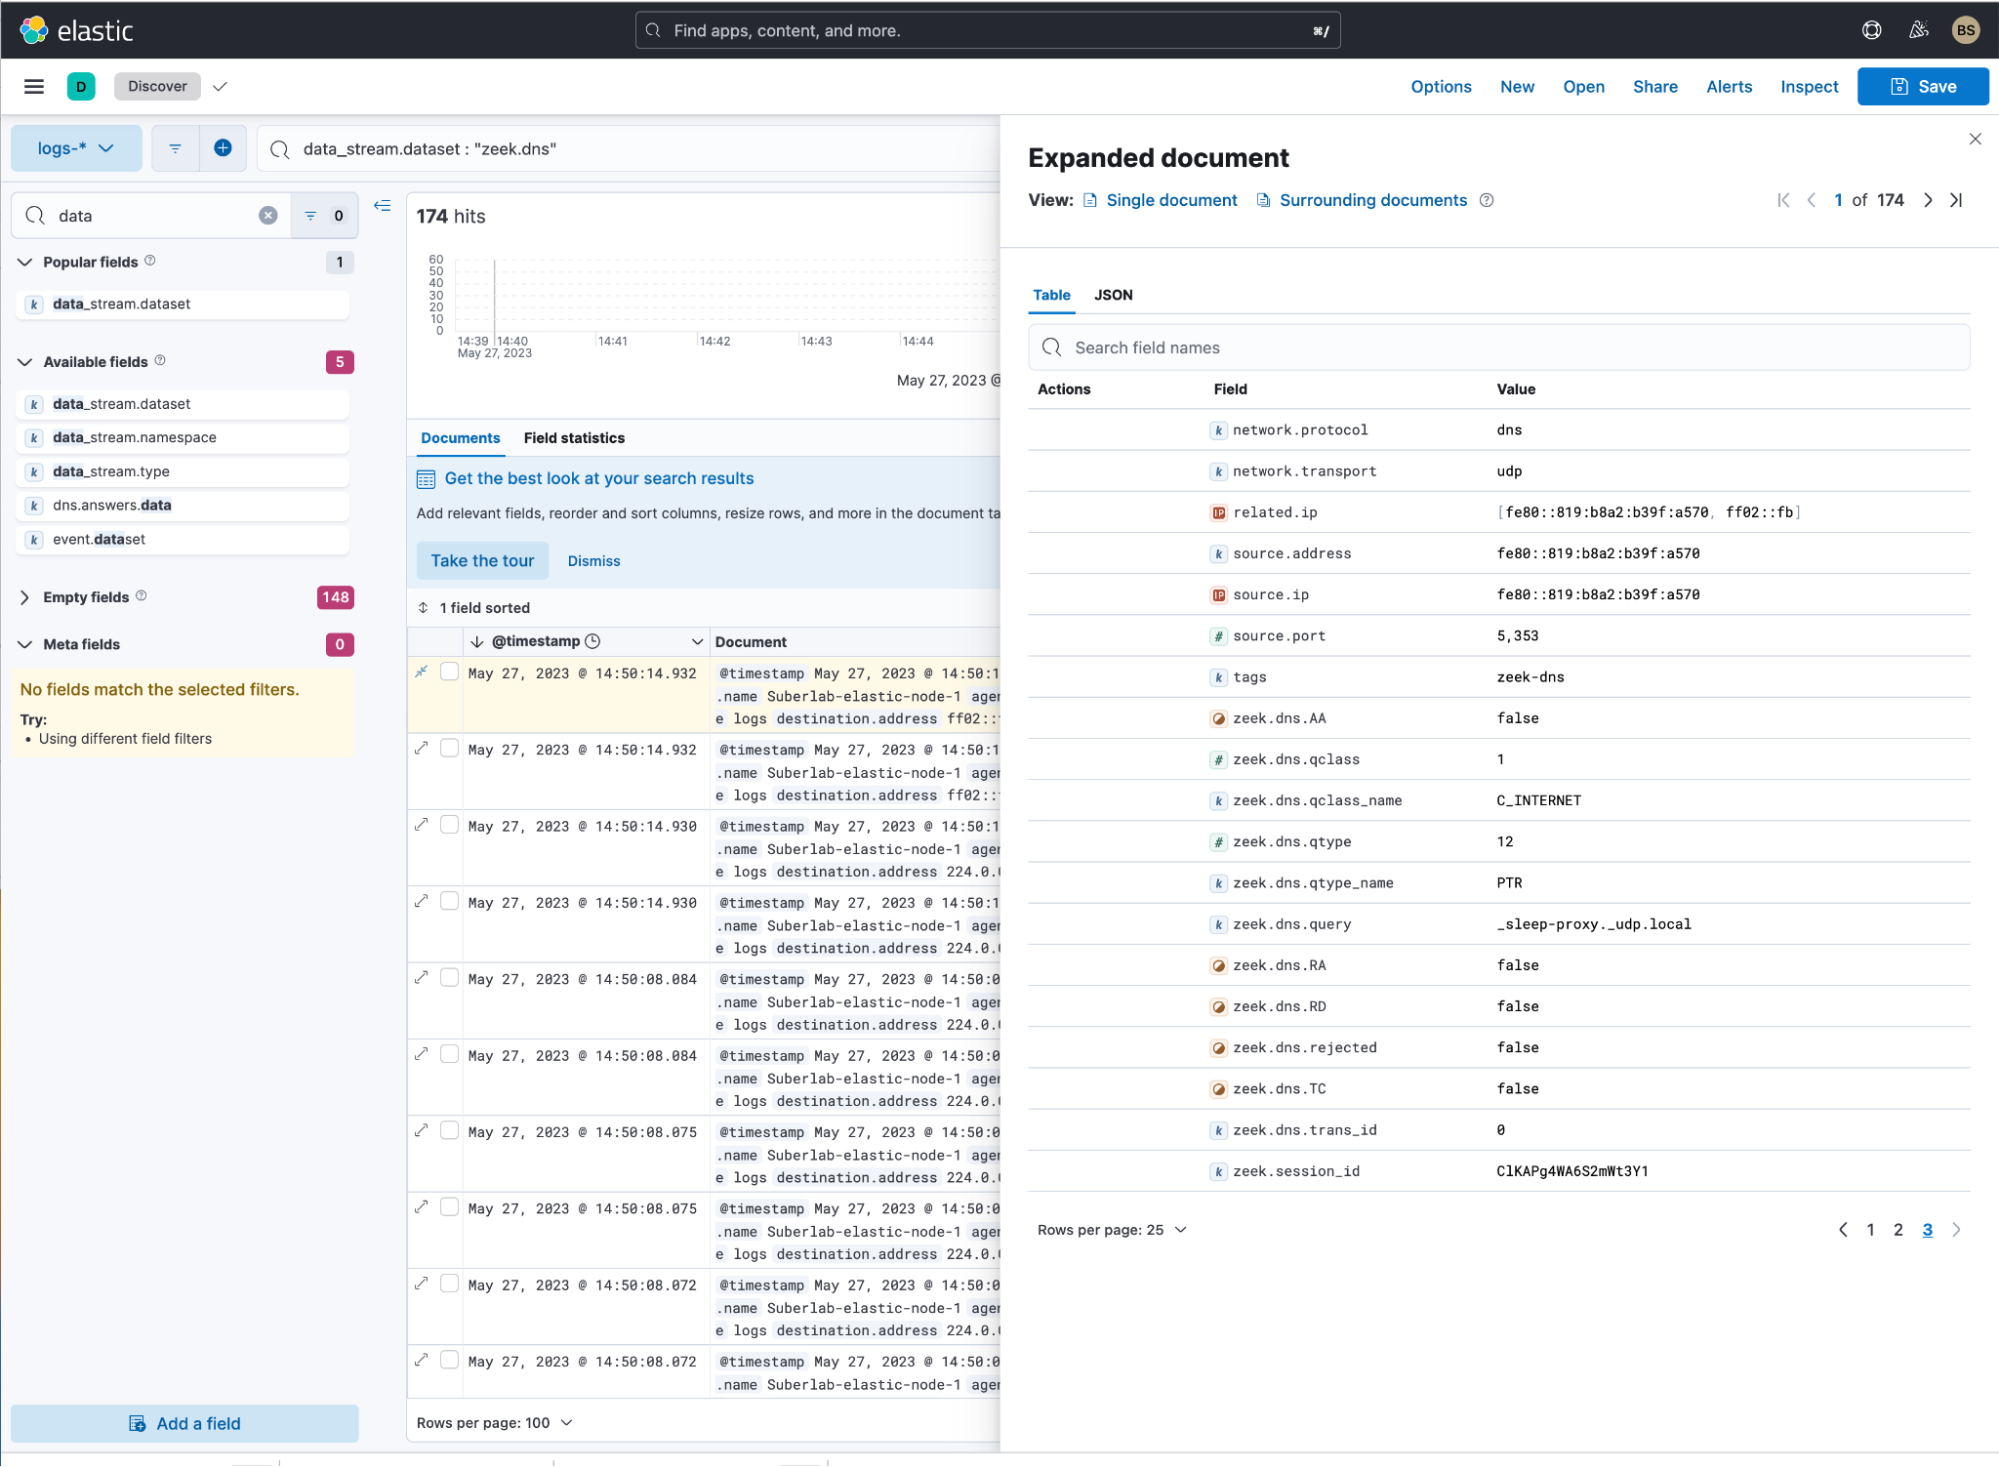
Data should be getting ingested into Elastic now. To verify that the data is being ingested, navigate to Discover and search for one of the datastream data set names. I’ve searched for zeek.dns and I see that the docs are now coming into an Elastic index. Check all of the sourcetypes you enabled.
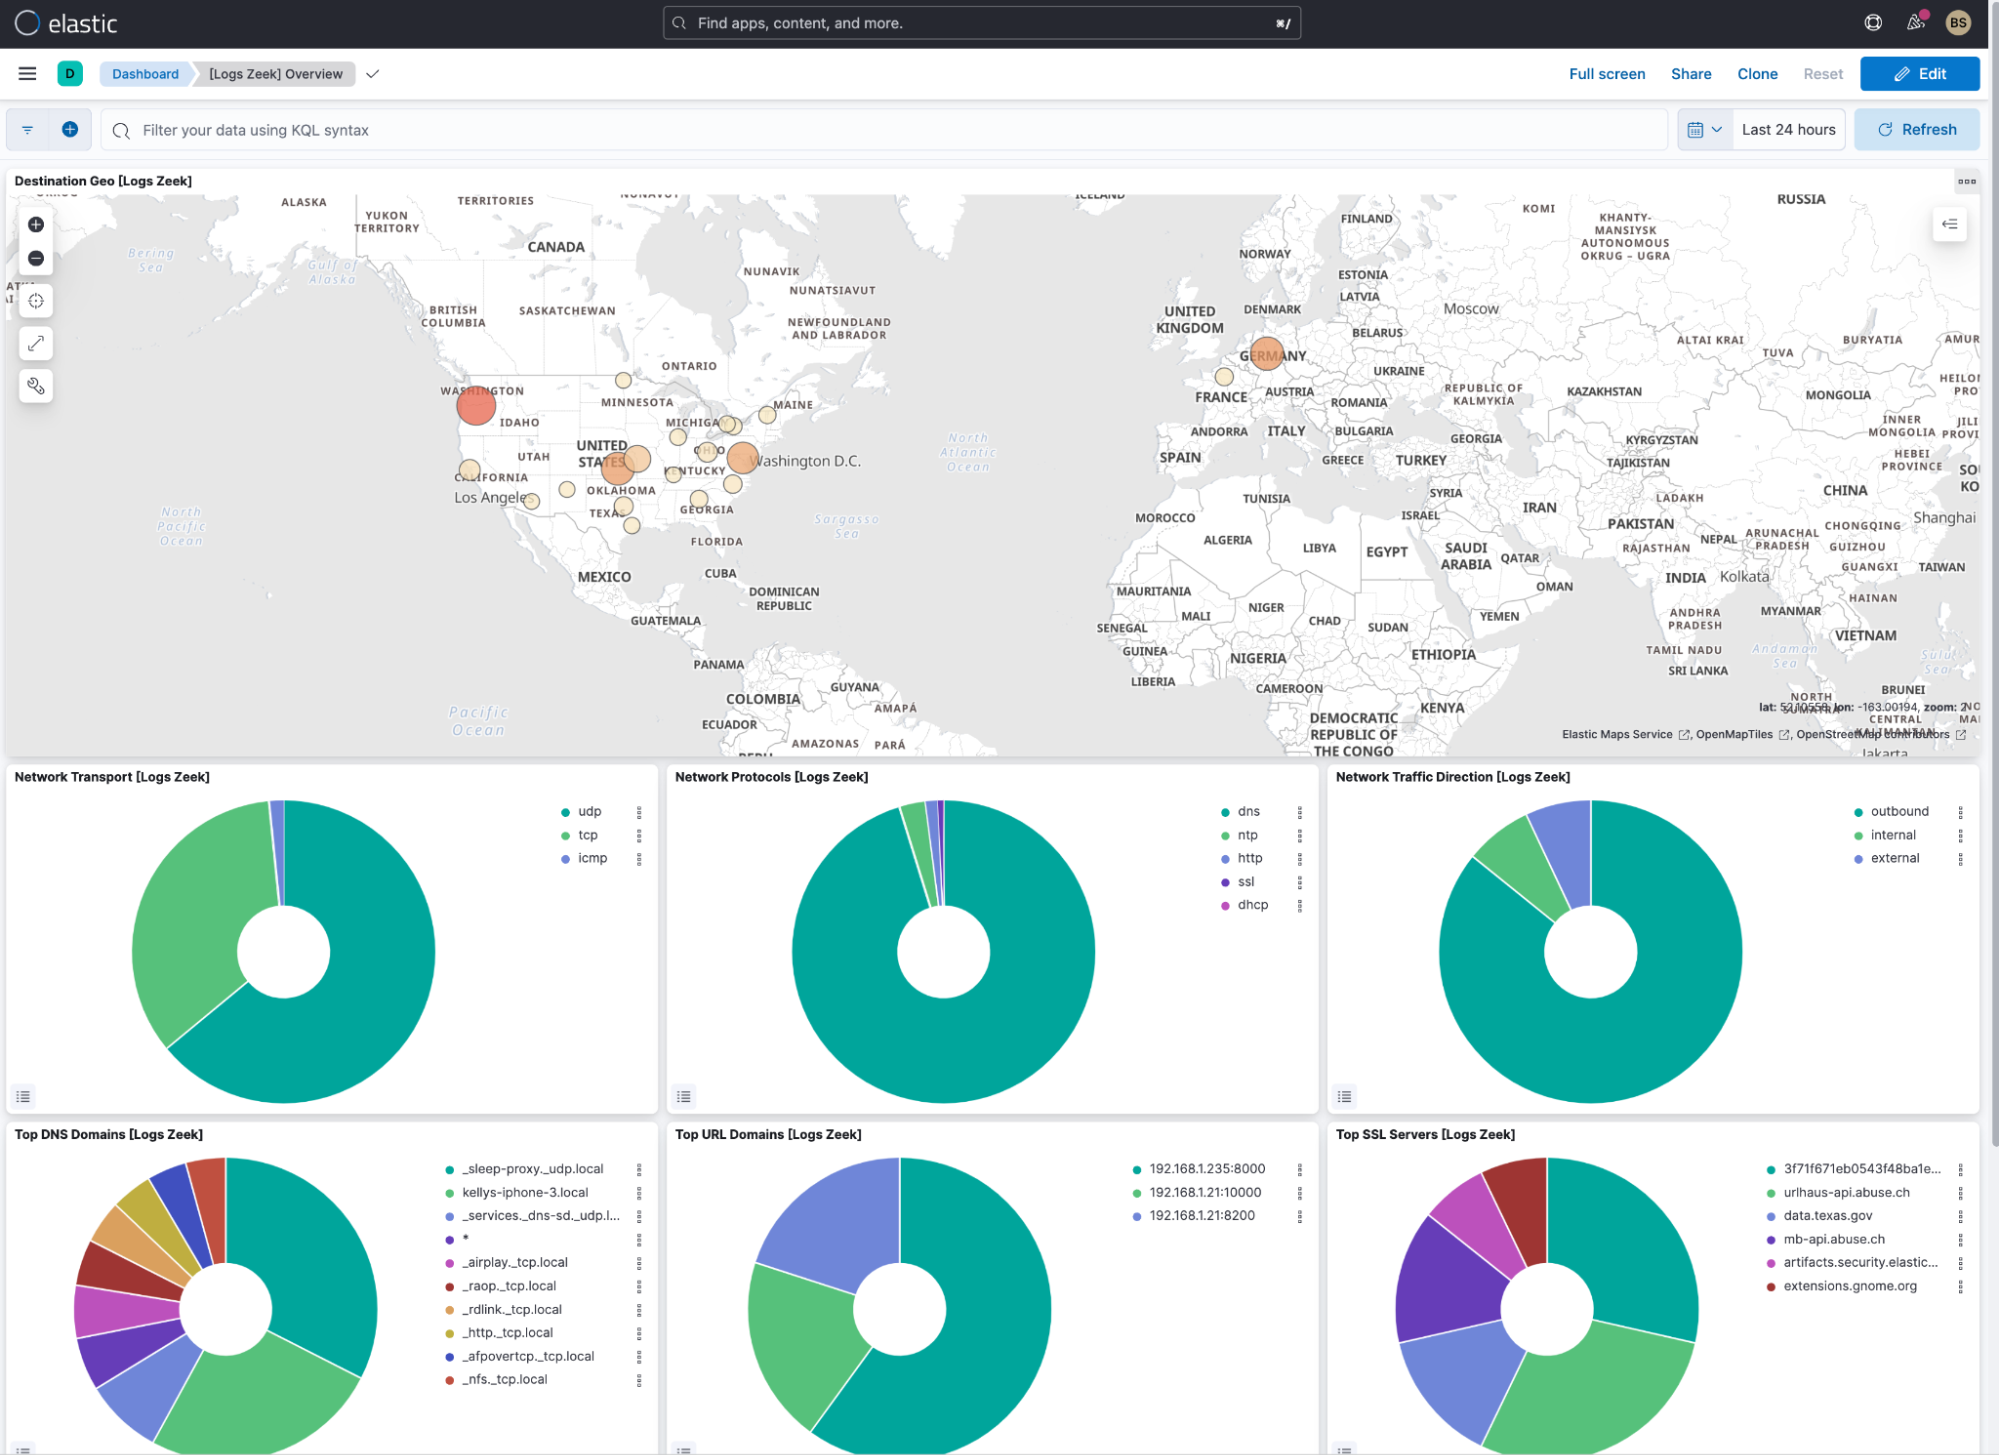
You can also check the Zeek Overview dashboard, which is an asset that automatically gets installed with the Zeek integration. If data is not getting ingested, check the Elastic Agent logs at Fleet -> Agents -> <host>, then select elastic_agent.filebeat data set with loglevel error, warning, and debug set.
Preconfigured machine learning anomaly detection jobs setup
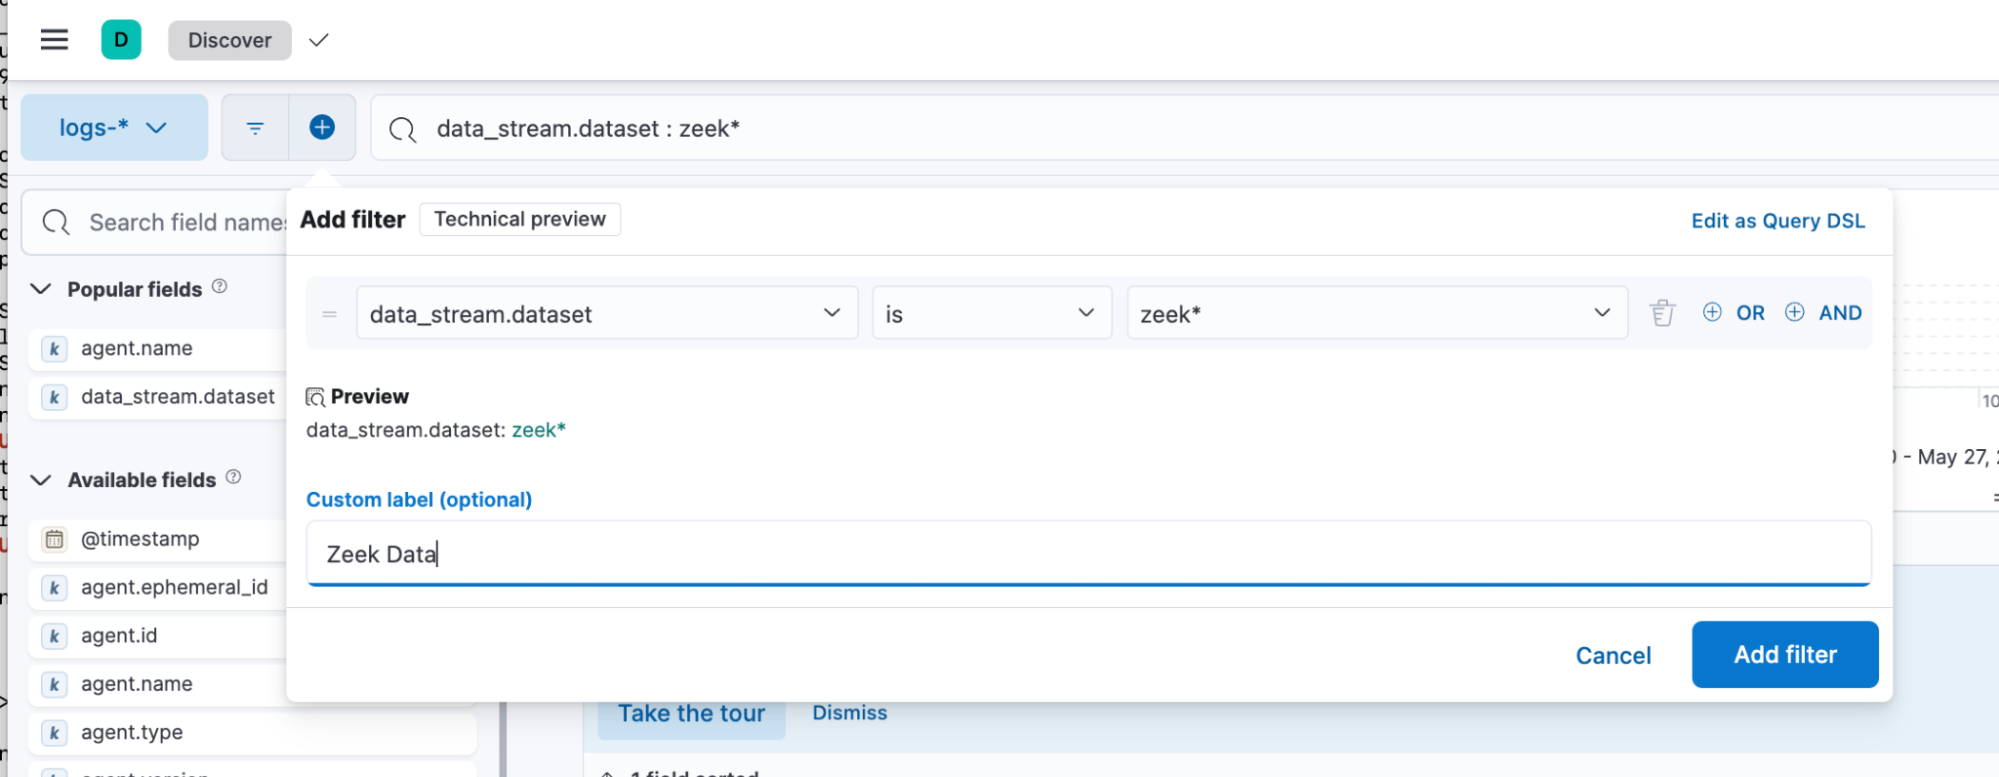
Now that we’ve verified the data is being ingested, let's start getting the data ready for the ML job. The ML job could be fed a Data View or a saved search. I’m going to filter the data so that I’m only feeding it relevant data, so let’s create a filter that only includes Zeek data sets.
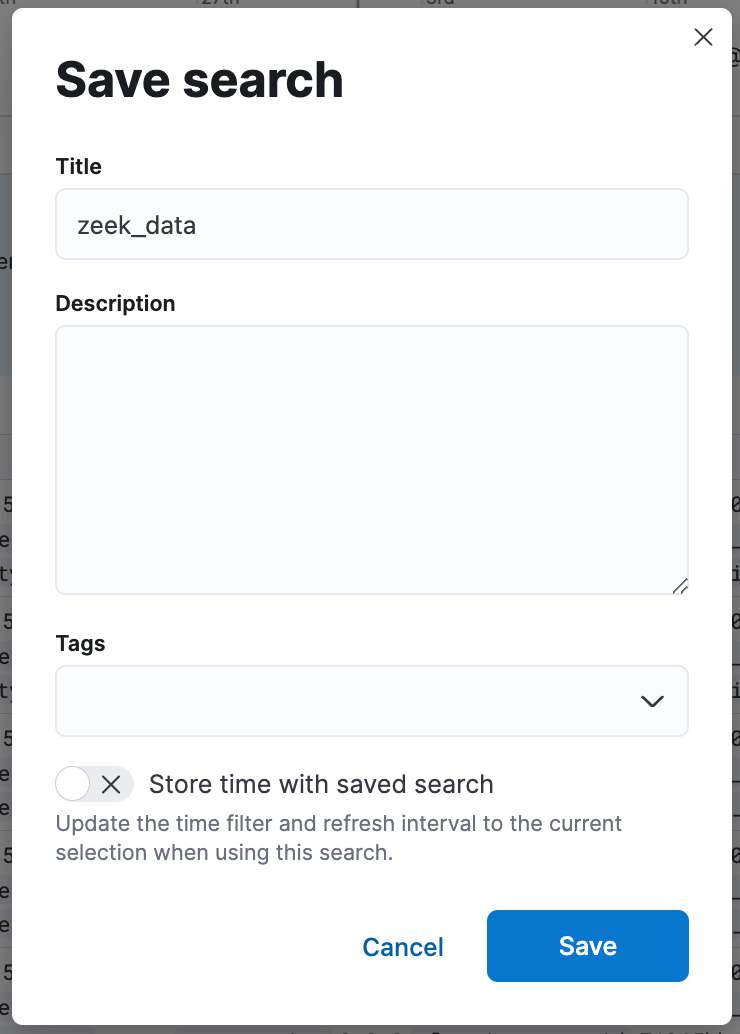
Once the filter is created, you can save the search and give it a name.
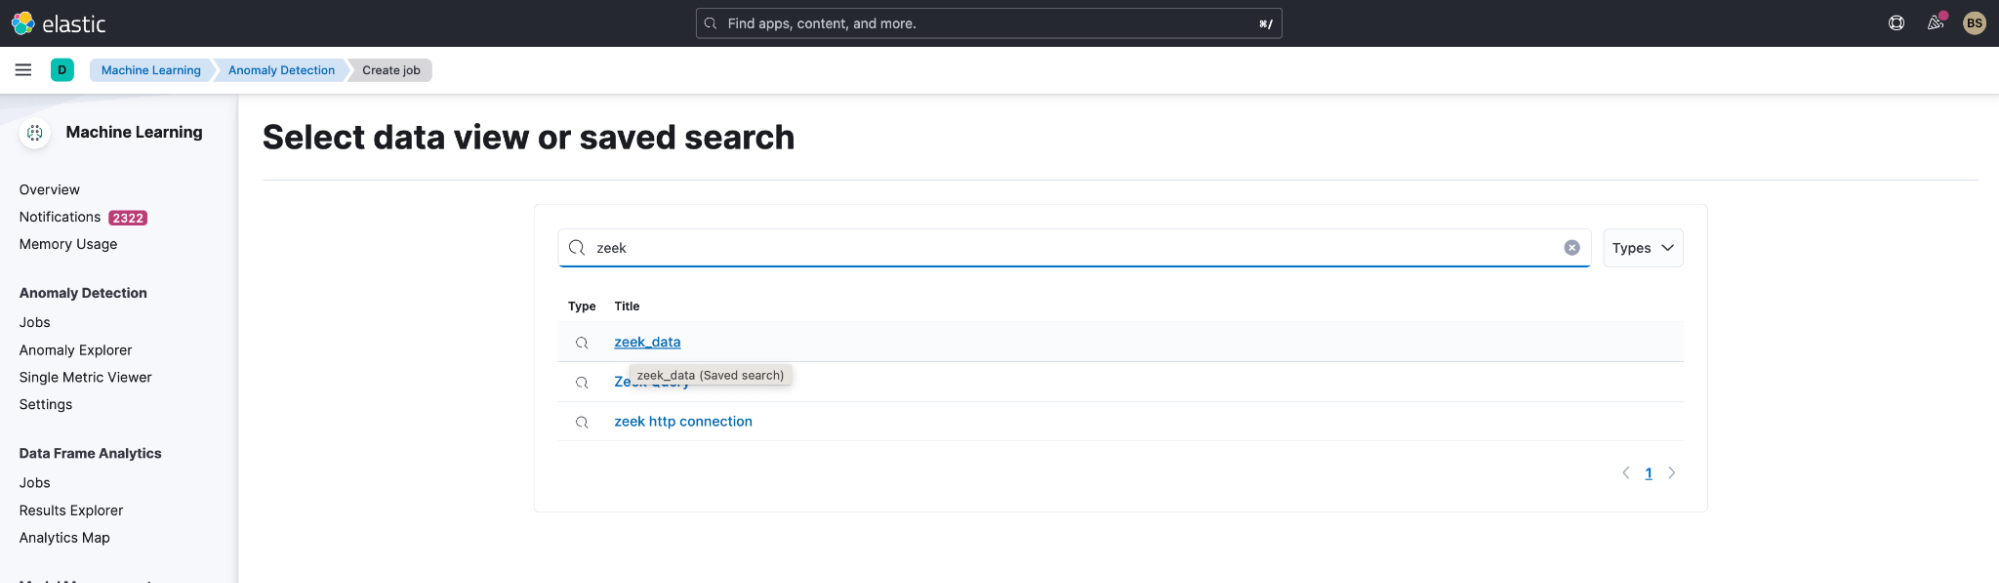
Now let’s navigate to the machine learning application to create a new job. Select Machine Learning -> Jobs -> Create job. Search for the saved search that you created previously and select it.
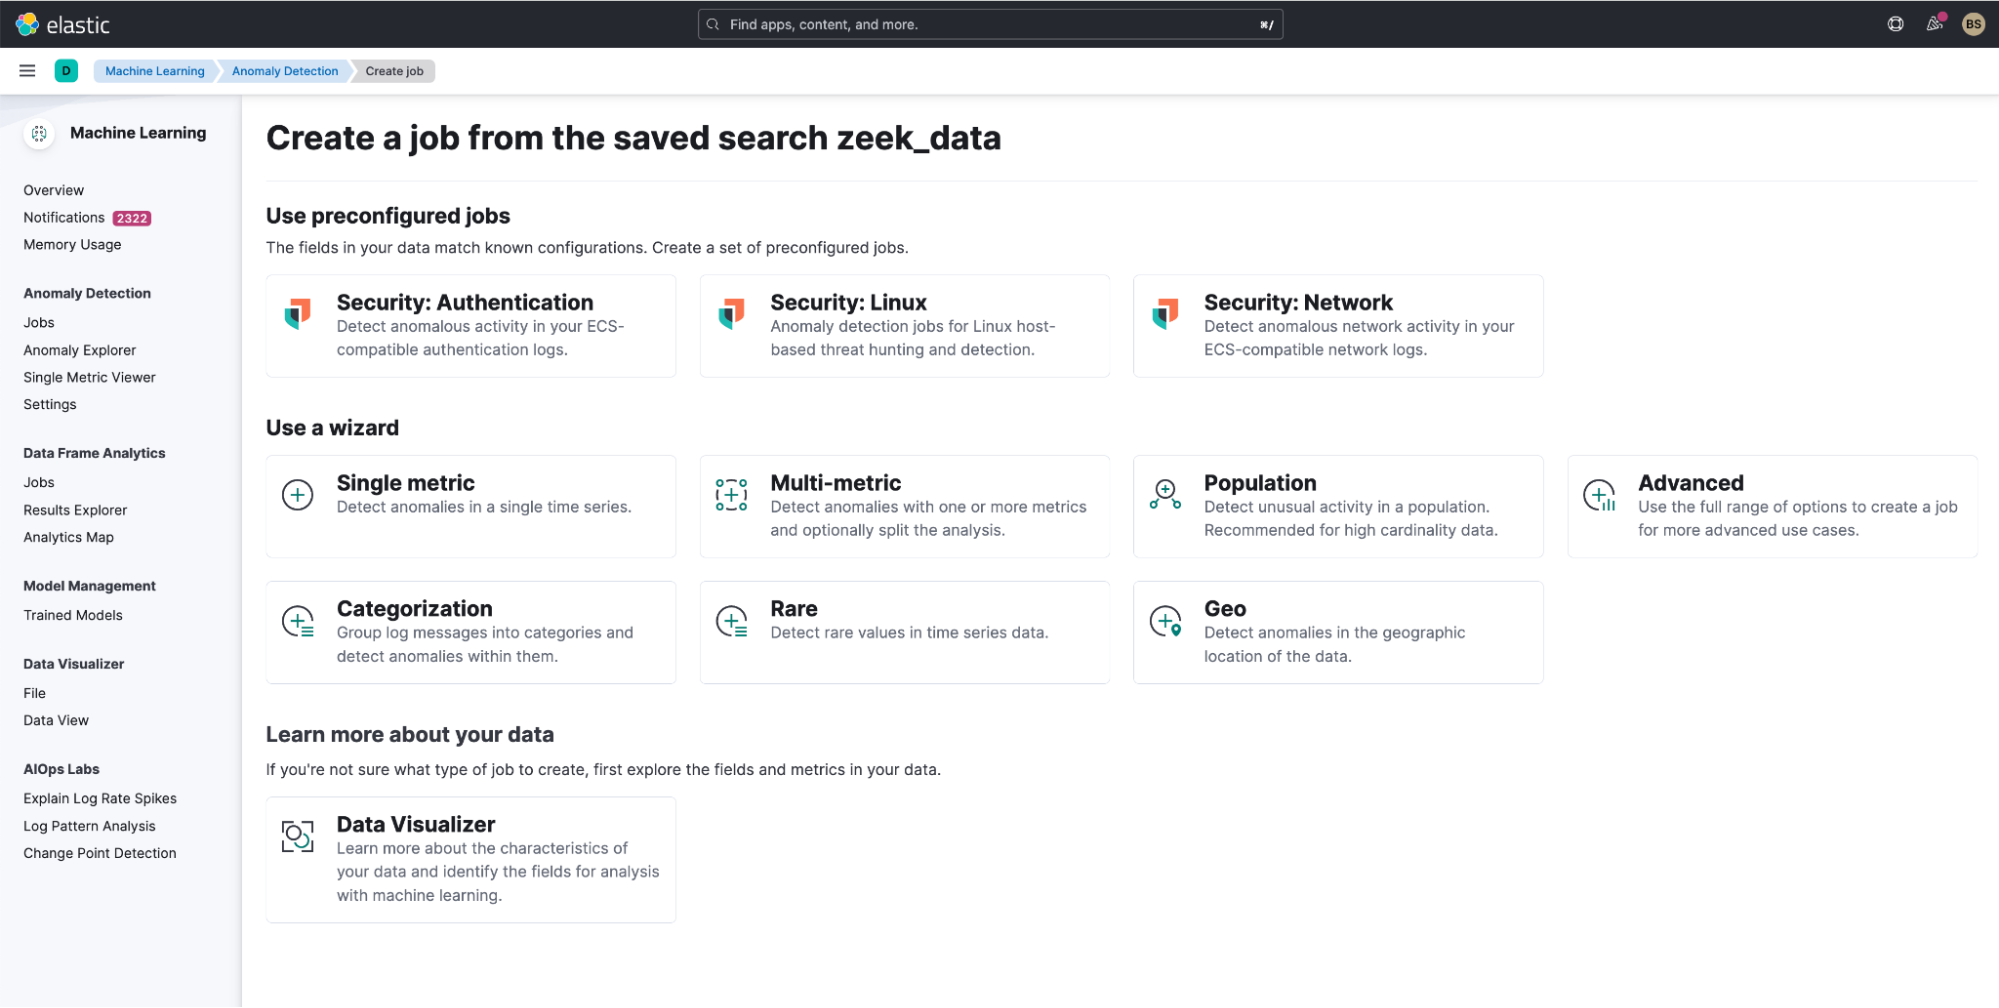
Once the saved search has been selected, you’ll then see a menu of jobs that you’re able to create. The pre-configured jobs include a datafeed that contains a query, which searches the data that you feed the ML job from the saved search. If results are returned, then the ML app will only display the jobs that are available to run based on the data that was provided, making it very simple to get started. I’m interested in network anomalies, so I have selected the “Security:Network” tile.
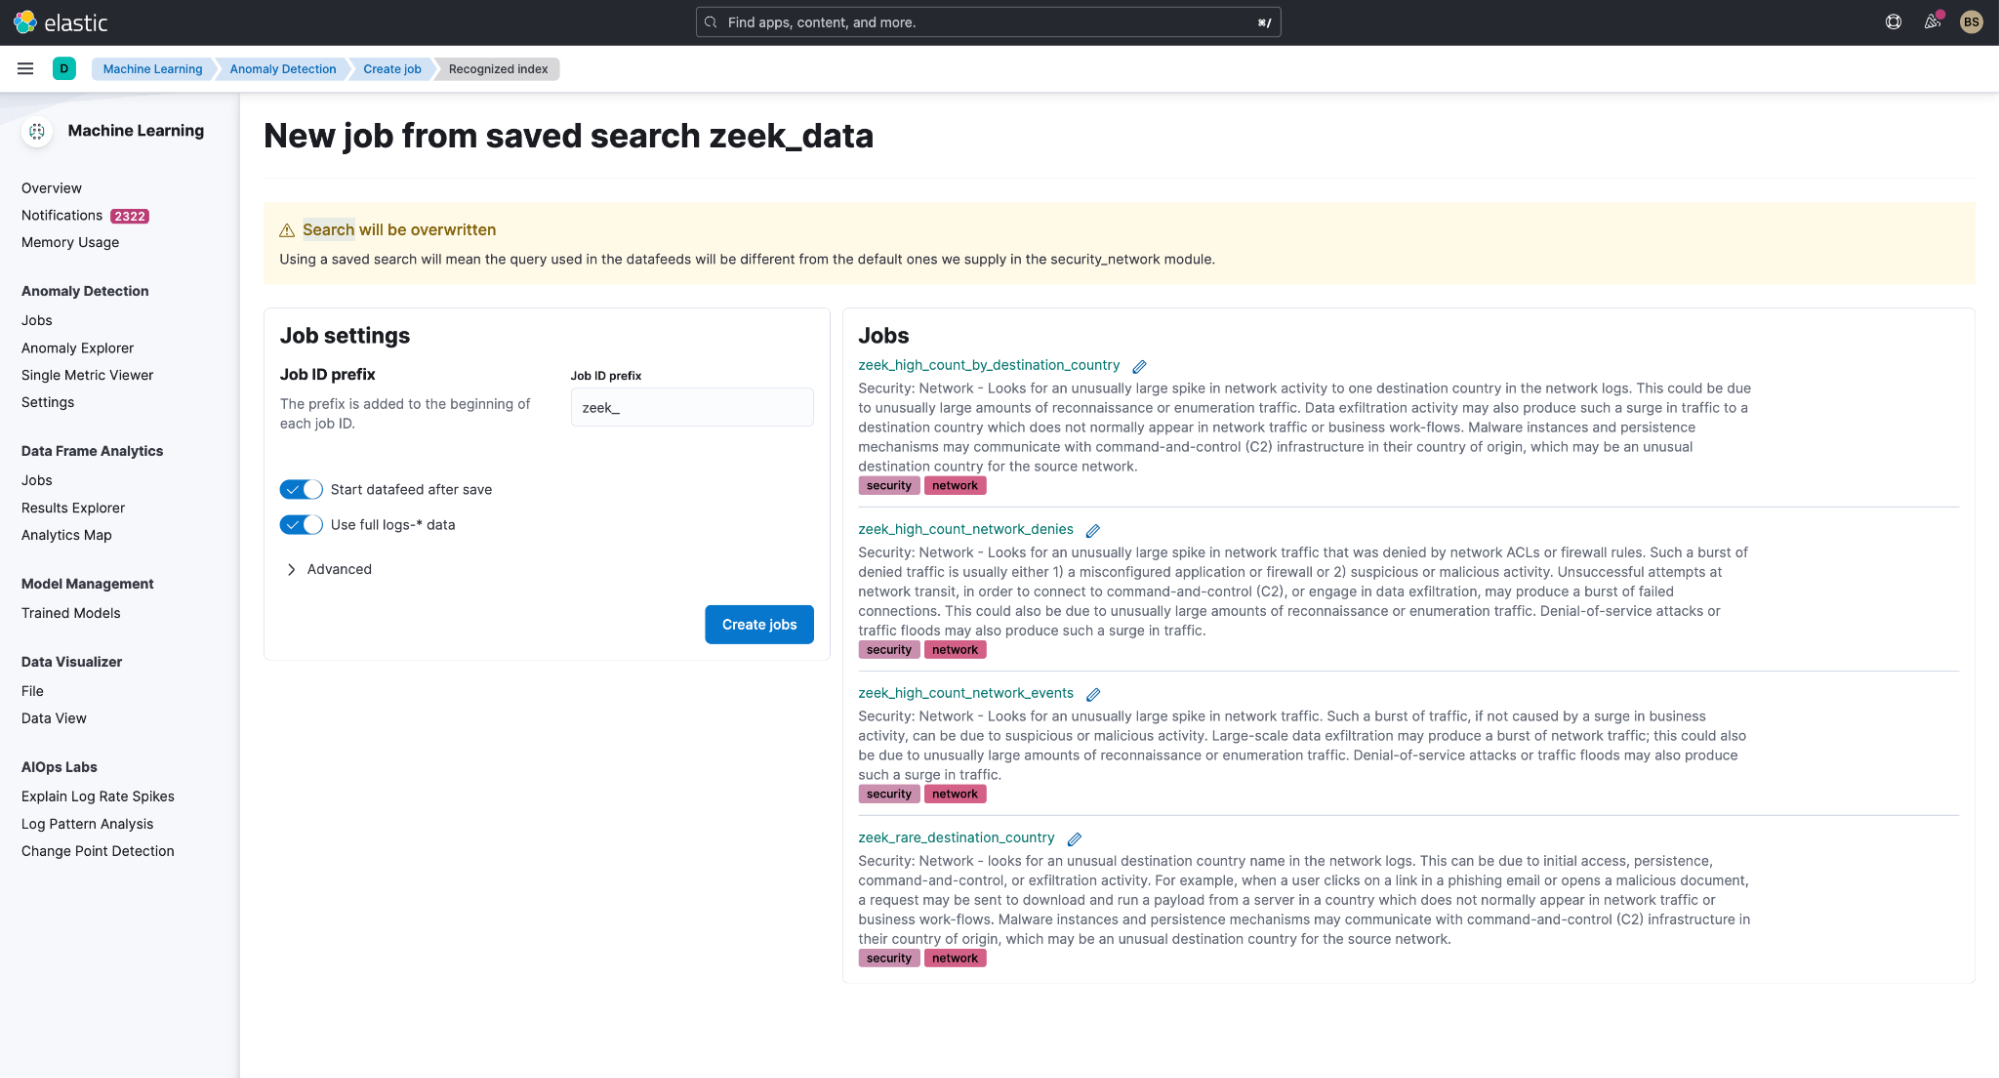
Provide the job settings a prefix name, enable the datafeed, and enable the use of the logs-* data. For large ML anomaly detection, jobs you’ll want to use a dedicated results index that’s configured in the “Advanced” section. Select “Create jobs” and once the jobs are created, select “View Results.”
The results will be viewed from the Anomaly Explorer view, which will show the top 10 most anomalous influencers for the ML jobs. This view includes an anomaly timeline with swim lanes for each anomaly detection job. The swim lanes can illustrate, at a glance, if there is anomalous activity based on a color coded anomaly score. Obtain additional context about the anomaly by viewing the Anomalies table where you view the detector, along with influencers and a description that includes the impact.
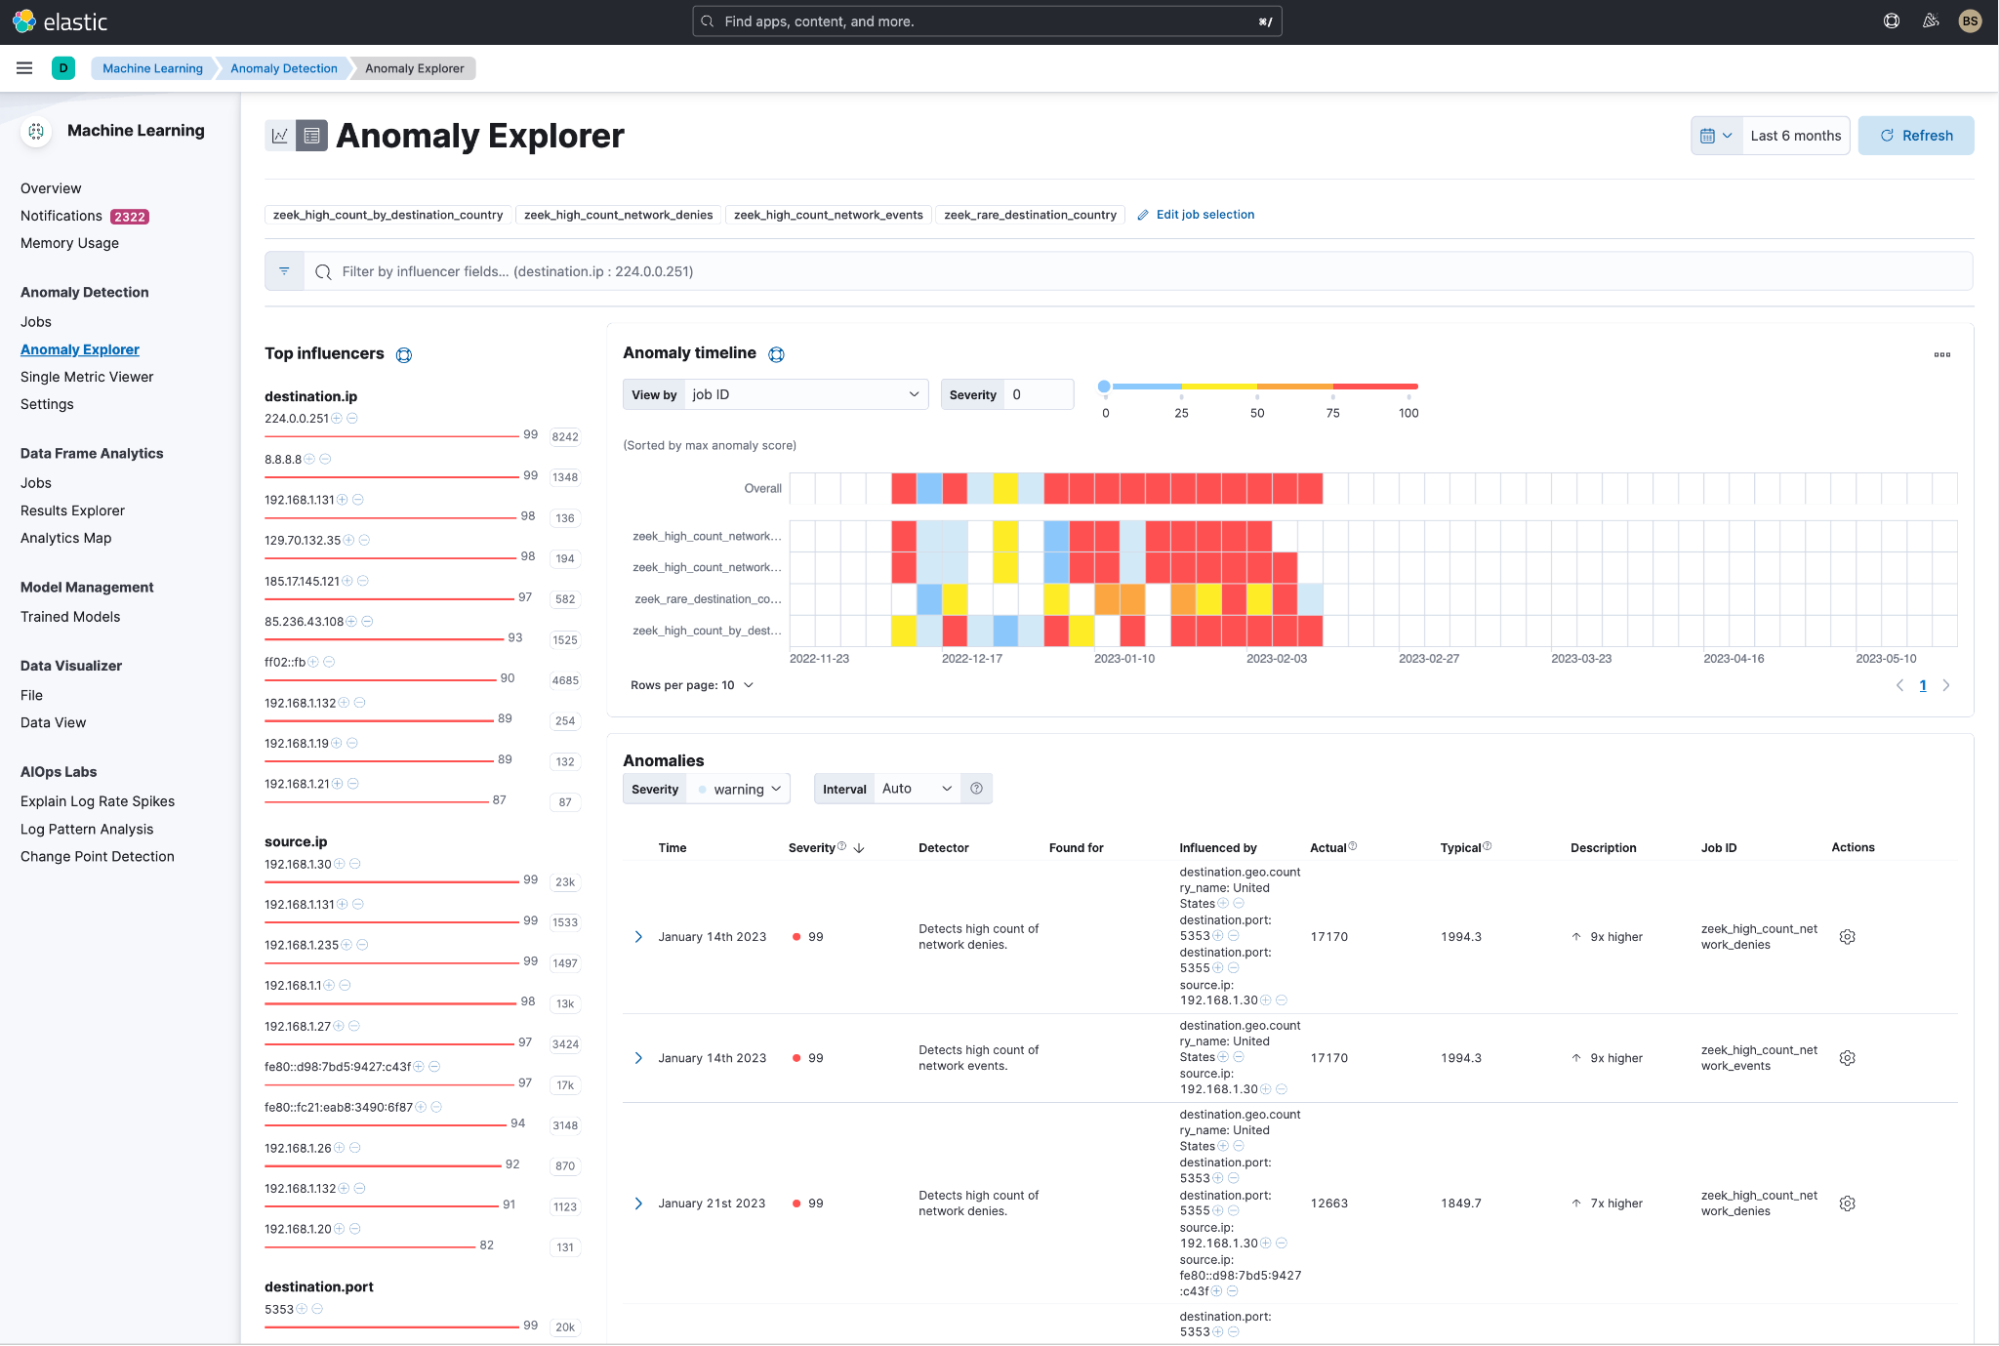
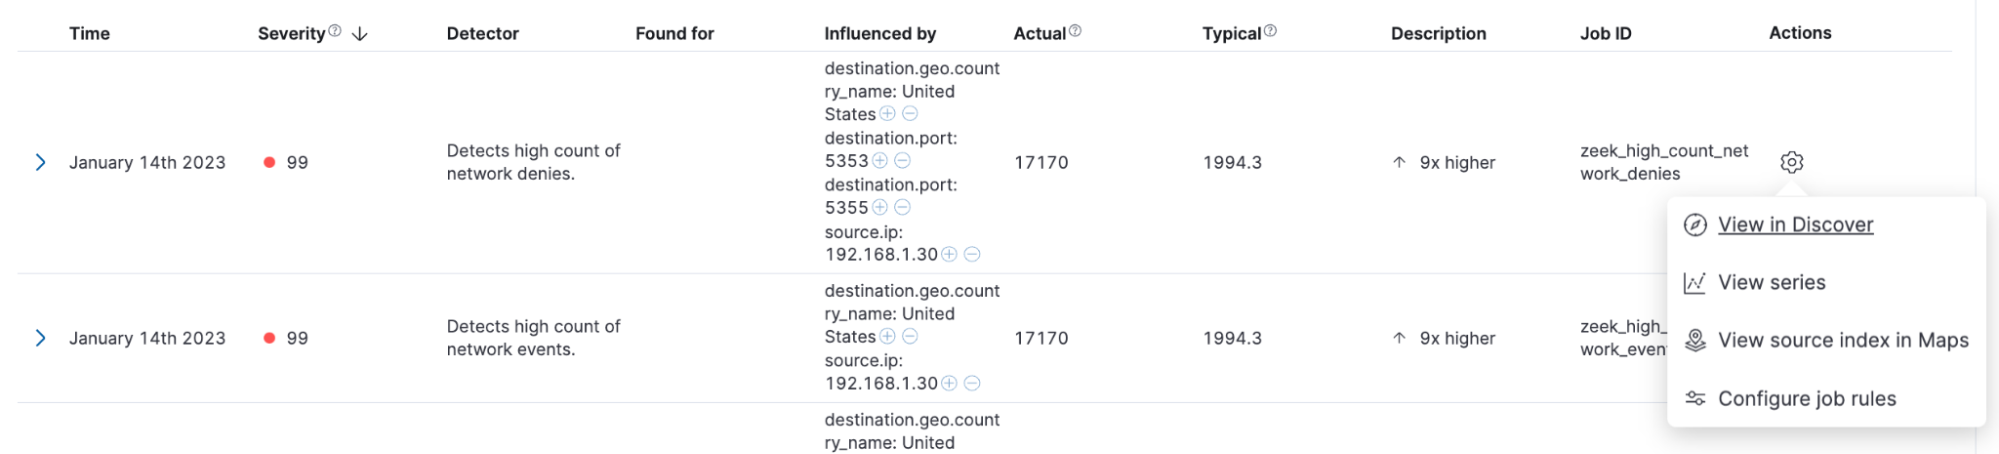
If you need to find the needle in the haystack, then you can drill down and “View in Discover” to view the documents that sourced the anomaly.
Additionally, you can drill down into “View series,” which in this example goes into the “Single Metric Viewer” for the detector “Detects high count of network denies.” There is a time series analysis of the count of the denies, and you can easily see an anomaly that stands out with an anomaly score of 99.
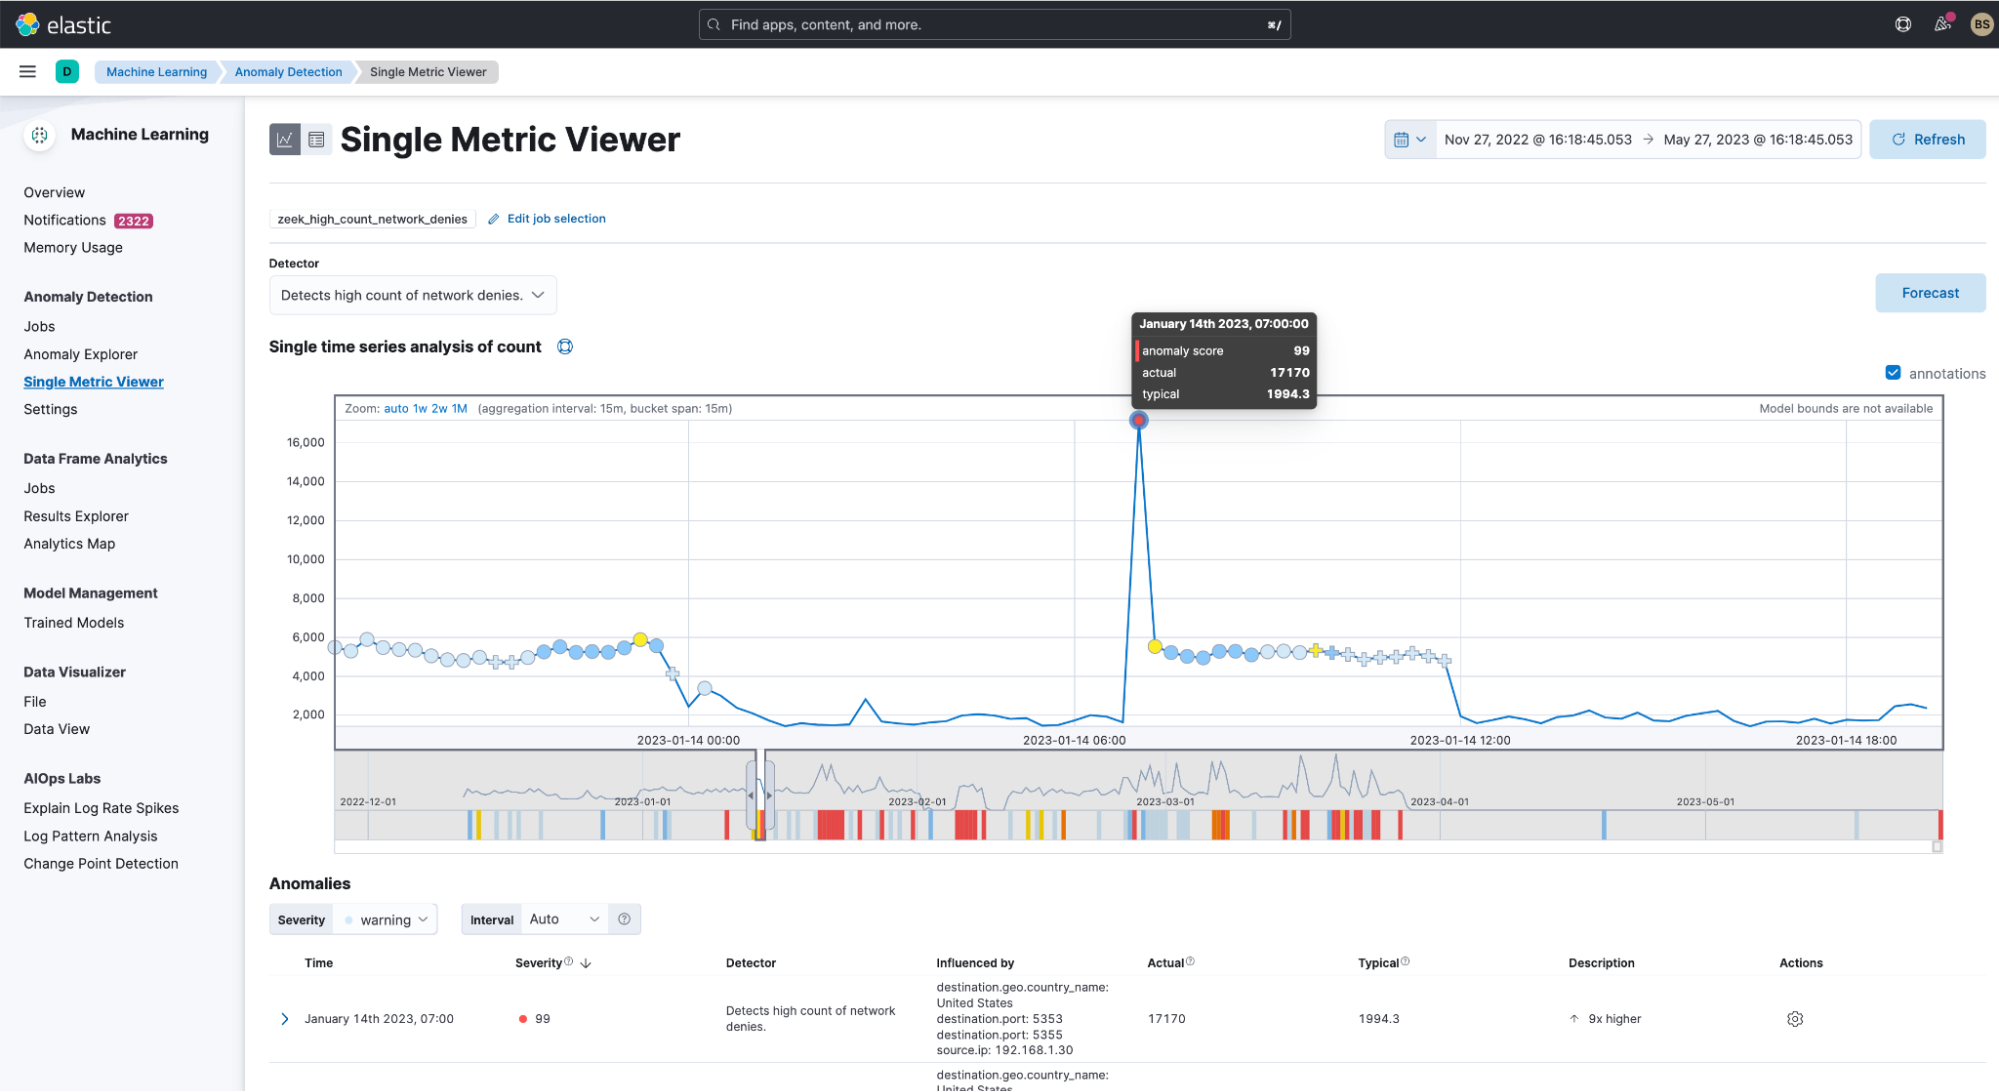
This shows that this clearly is anomalous behavior and something that I’d like to be alerted to in near real time.
Summary
Take advantage of Elastic’s ability to detect anomalous behavior in the sea of Splunk data using pre-built anomaly detection jobs. In addition to the Zeek integration, you can also pull Apache, AWS CloudTrail, Nginx, and Windows data into Elastic.
Review our documentation on getting started with data from Splunk along with a tutorial on getting started with anomaly detection with the Elastic machine learning application.
The release and timing of any features or functionality described in this post remain at Elastic's sole discretion. Any features or functionality not currently available may not be delivered on time or at all.
Share
- Share on Twitter
Share on Twitter
- Share on LinkedIn
Share on LinkedIn
- Share on Facebook
Share on Facebook
- Share by Email
Share by Email
- Print this page
Print