Agent Builder is available now GA. Get started with an Elastic Cloud Trial, and check out the documentation for Agent Builder here.
Every Elastic Agent Builder conversation already generates a full OpenTelemetry trace. LLM calls, tool executions, token counts, all logged by default into Elasticsearch data streams you can query with ES|QL. Most teams don't look at this data until something breaks, which means they're sitting on usage trends, latency bottlenecks, and cost signals they could have caught earlier. This post covers how to build token cost dashboards in Kibana, set alerts that fire when a conversation blows past 256,000 tokens, and use the waterfall timeline to see exactly where your agent spent its time.
What is an Agent Builder OTel trace and what does it capture?
When your agent runs, Agent Builder records everything that happened as an OpenTelemetry (OTel) trace. Think of a trace as a receipt for a single conversation turn. Every LLM request, tool call, and agent action is recorded as an individual span in Elasticsearch, which is a unit of work or operation. When opted in, additional details like user prompts, LLM responses, tool outputs, and conversation IDs are captured as structured span attributes on the chat span. All of this is scoped to your Kibana space.
How to enable agent tracing and privacy controls in Kibana
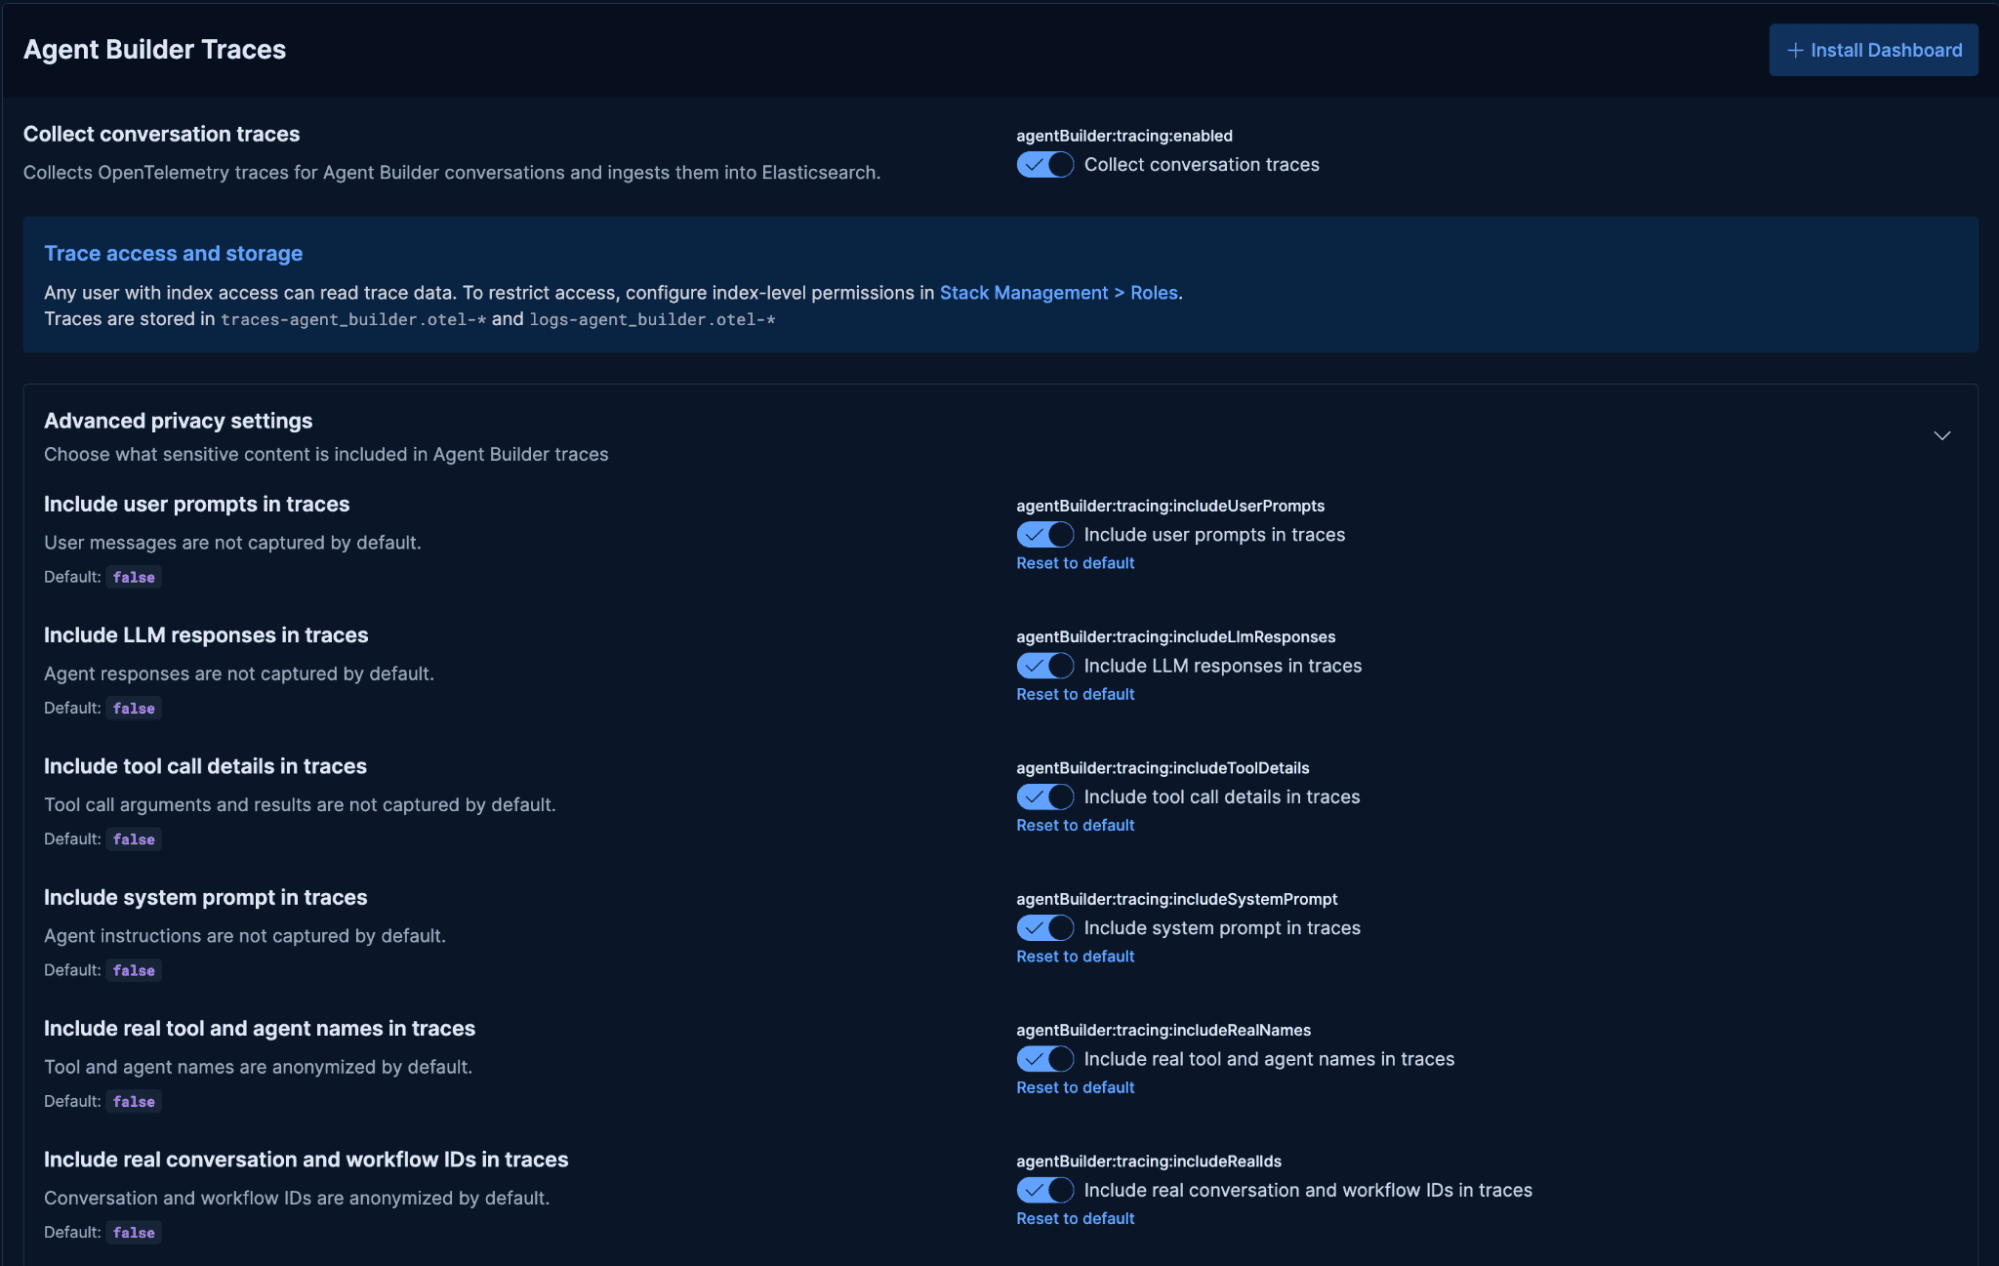
To begin capturing trace data, ensure the following toggles under Agent Traces in Gen AI Settings are active within your environment:
agentBuilder:tracing:enabled— This gen AI setting manages the collection of traces and is enabled by default.
Advanced privacy controls, located under the default tracing toggle, also let you collect message content. While prompts and tool outputs are masked by default, you may choose to enable them to support more robust traces:
agentBuilder:tracing:includeUserPromptsagentBuilder:tracing:includeLlmResponsesagentBuilder:tracing:includeToolDetailsagentBuilder:tracing:includeSystemPromptagentBuilder:tracing:includeRealNames: Retains real agent/tool names instead of anonymizing to customagentBuilder:tracing:includeRealIds: Retains the actual conversation identifiers instead of the default hashed versions. This means trace data collects original IDs, which can link traces to specific user sessions (PII).
Only enable these if you understand what data your agents handle and have appropriate data governance in place.
How Agent Builder stores OTel trace data in Elasticsearch
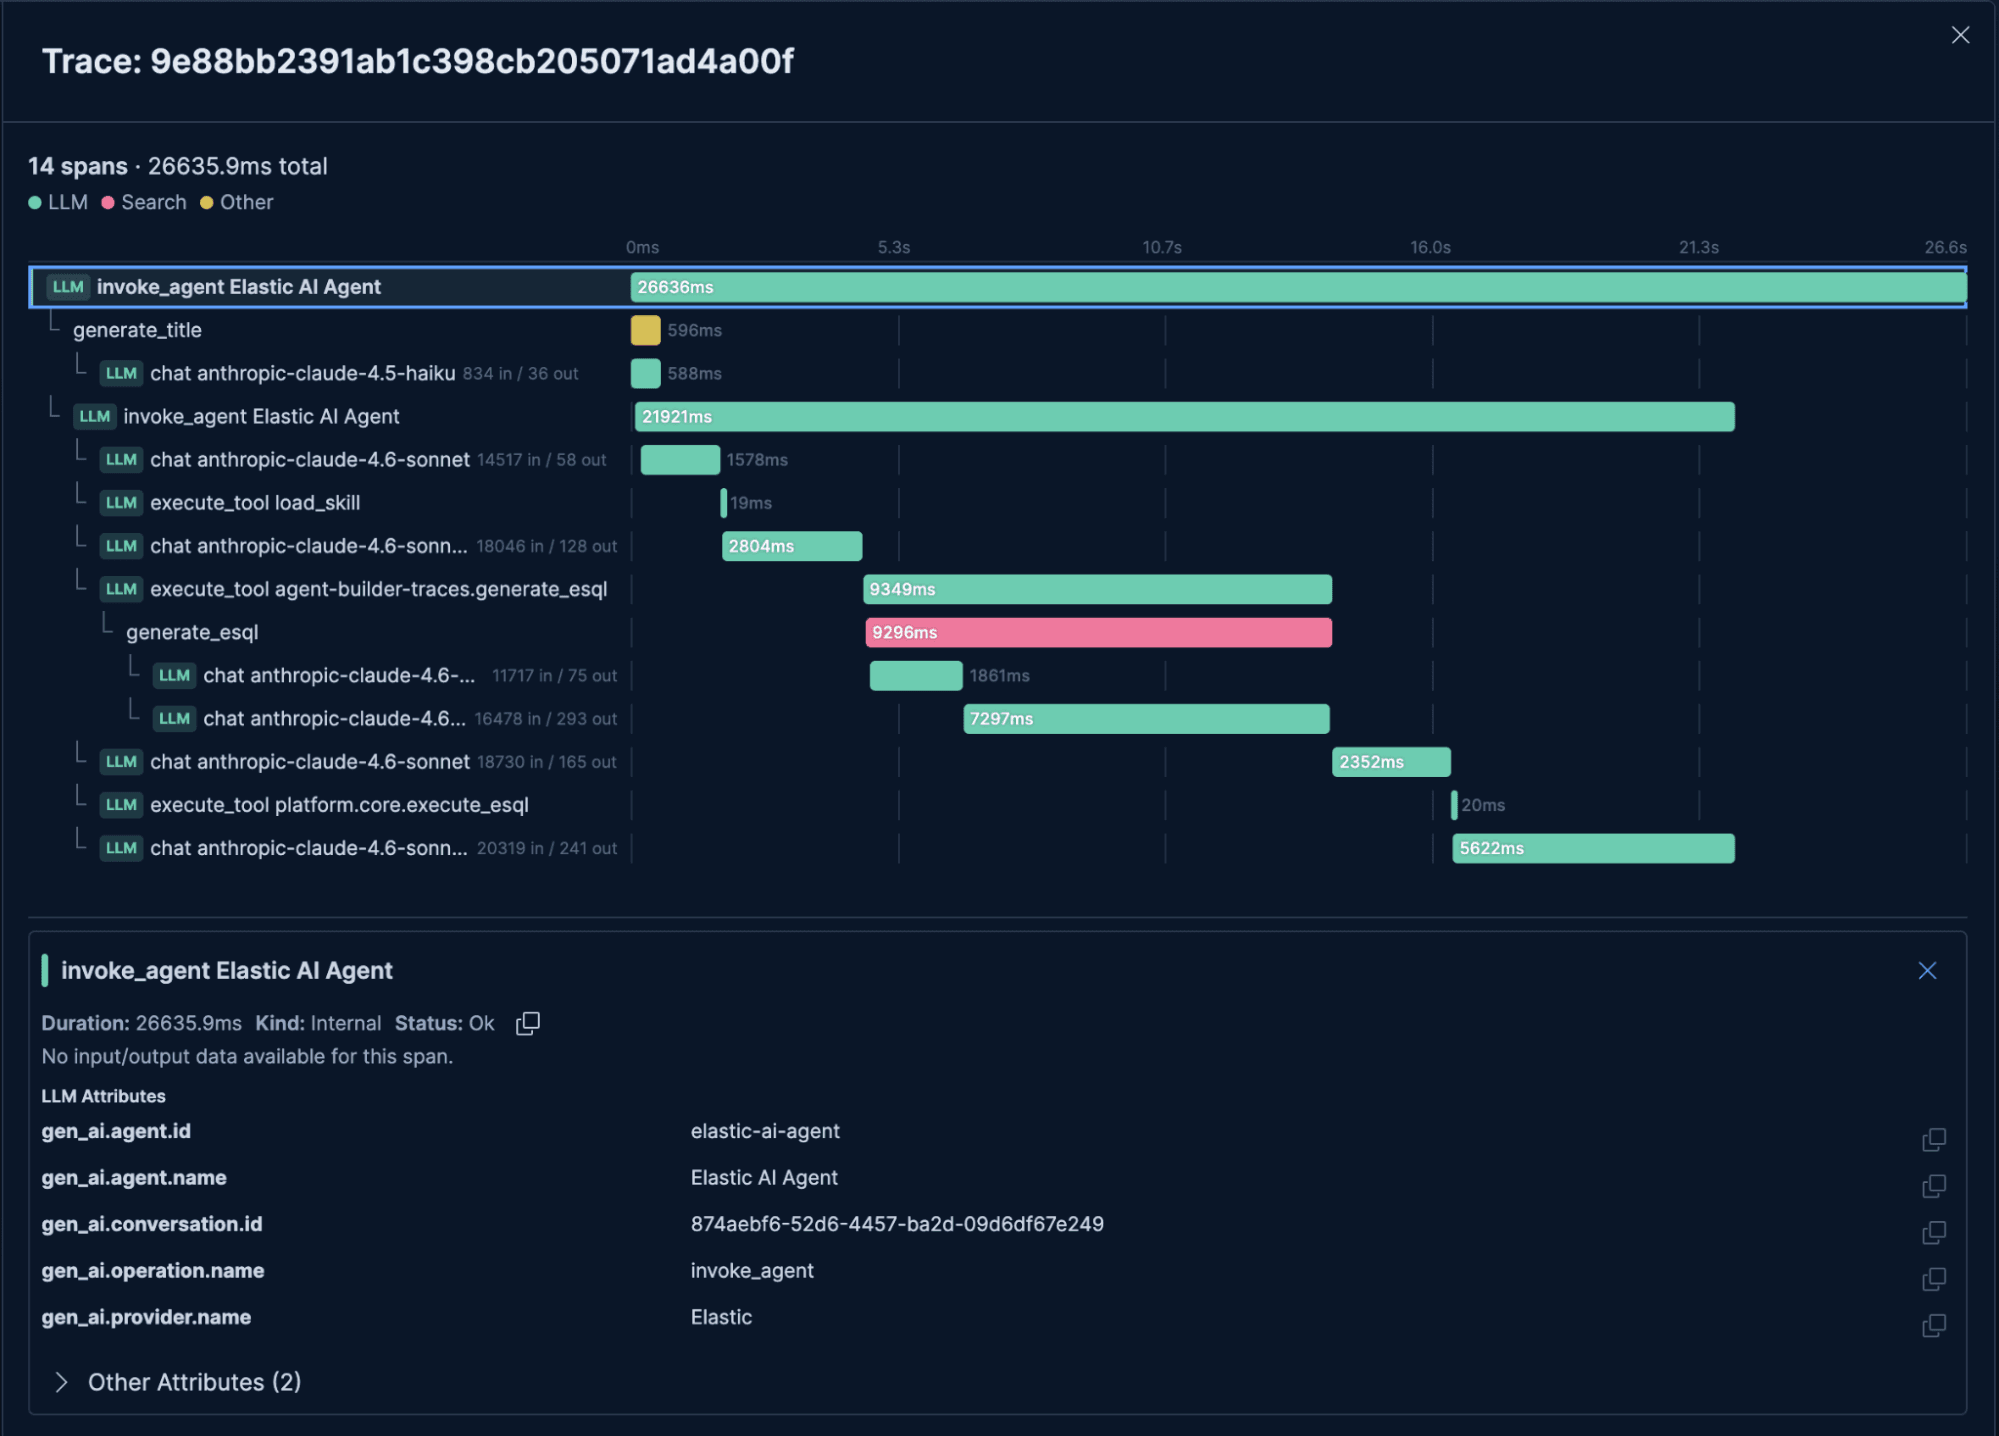
The Agent Builder utilizes OpenTelemetry semantic conventions. This results in a structured hierarchy of spans that provides a granular view of the agent's internal logic:
| Span | Type | What it captures |
|---|---|---|
| `invoke_agent <name>` | CHAIN | Full turn lifecycle, from user input to final reply |
| `invoke_agent <name>` | AGENT | Single agent execution: reasoning, tool calls, reply |
| `chat <model>` | LLM | One LLM request: model, latency, token counts |
| `execute_tool <toolName>` | TOOL | Tool invocation: arguments, duration, result |
Trace data is written to a dedicated data stream per Kibana space, keeping conversation data cleanly isolated. To query your traces in Discover, target the index for your space directly:
For the default space, that’s traces-agent_builder.otel-default. If the advanced privacy controls are turned on, then those span attributes will also be shipped to the traces data stream with the original spans. This index lets you query the raw message content to see what's actually being said in conversations. It is best practice to avoid using wildcards to prevent mixing data from unrelated spaces.
Agent Builder ships with a built-in skill called agent-builder-traces, installed automatically when agentBuilder:tracing:enabled is on. You can use it to ask questions directly about your trace data, making it easy to explore agent behavior without writing ES|QL from scratch.
How to debug agent behaviour with the OTel trace waterfall view
The trace waterfall shows every step of an Agent Builder session as a timeline. To open it, navigate to the specific turn in the conversation UI and select the trace icon.

This launches a waterfall timeline breaking down every step of your agent's execution. At the top level, you'll see the invoke_agent parent span with the full end-to-end duration of your agent run. Nested beneath it are chat spans, each representing a single LLM request and showing exactly how long the model took to respond. Alongside those are execute_tool spans, one per tool call, where you can see which tool was called, what arguments it received, and how long it ran. This allows you to trace the exact sequence your agent followed, pinpoint timing bottlenecks, and see where errors occurred.
How to build token cost dashboards from trace data
Discover gives you raw trace data, but most teams want answers to operational questions like "how many tokens did we burn today?", "which tool is called most often?", and "how many unique users interacted with the agent this week?". These would require a dashboard built directly against the trace data.
There is an Elastic-managed out-of-the-box dashboard called [Elastic] Agent Builder Overview that can be installed by clicking in the top-right corner of the Agent Traces section within GenAI Settings.

It contains basic details spanning Token Usage and Cost, Conversation Volume and Latency, Agent Execution, and Tool Call Frequency and Errors.
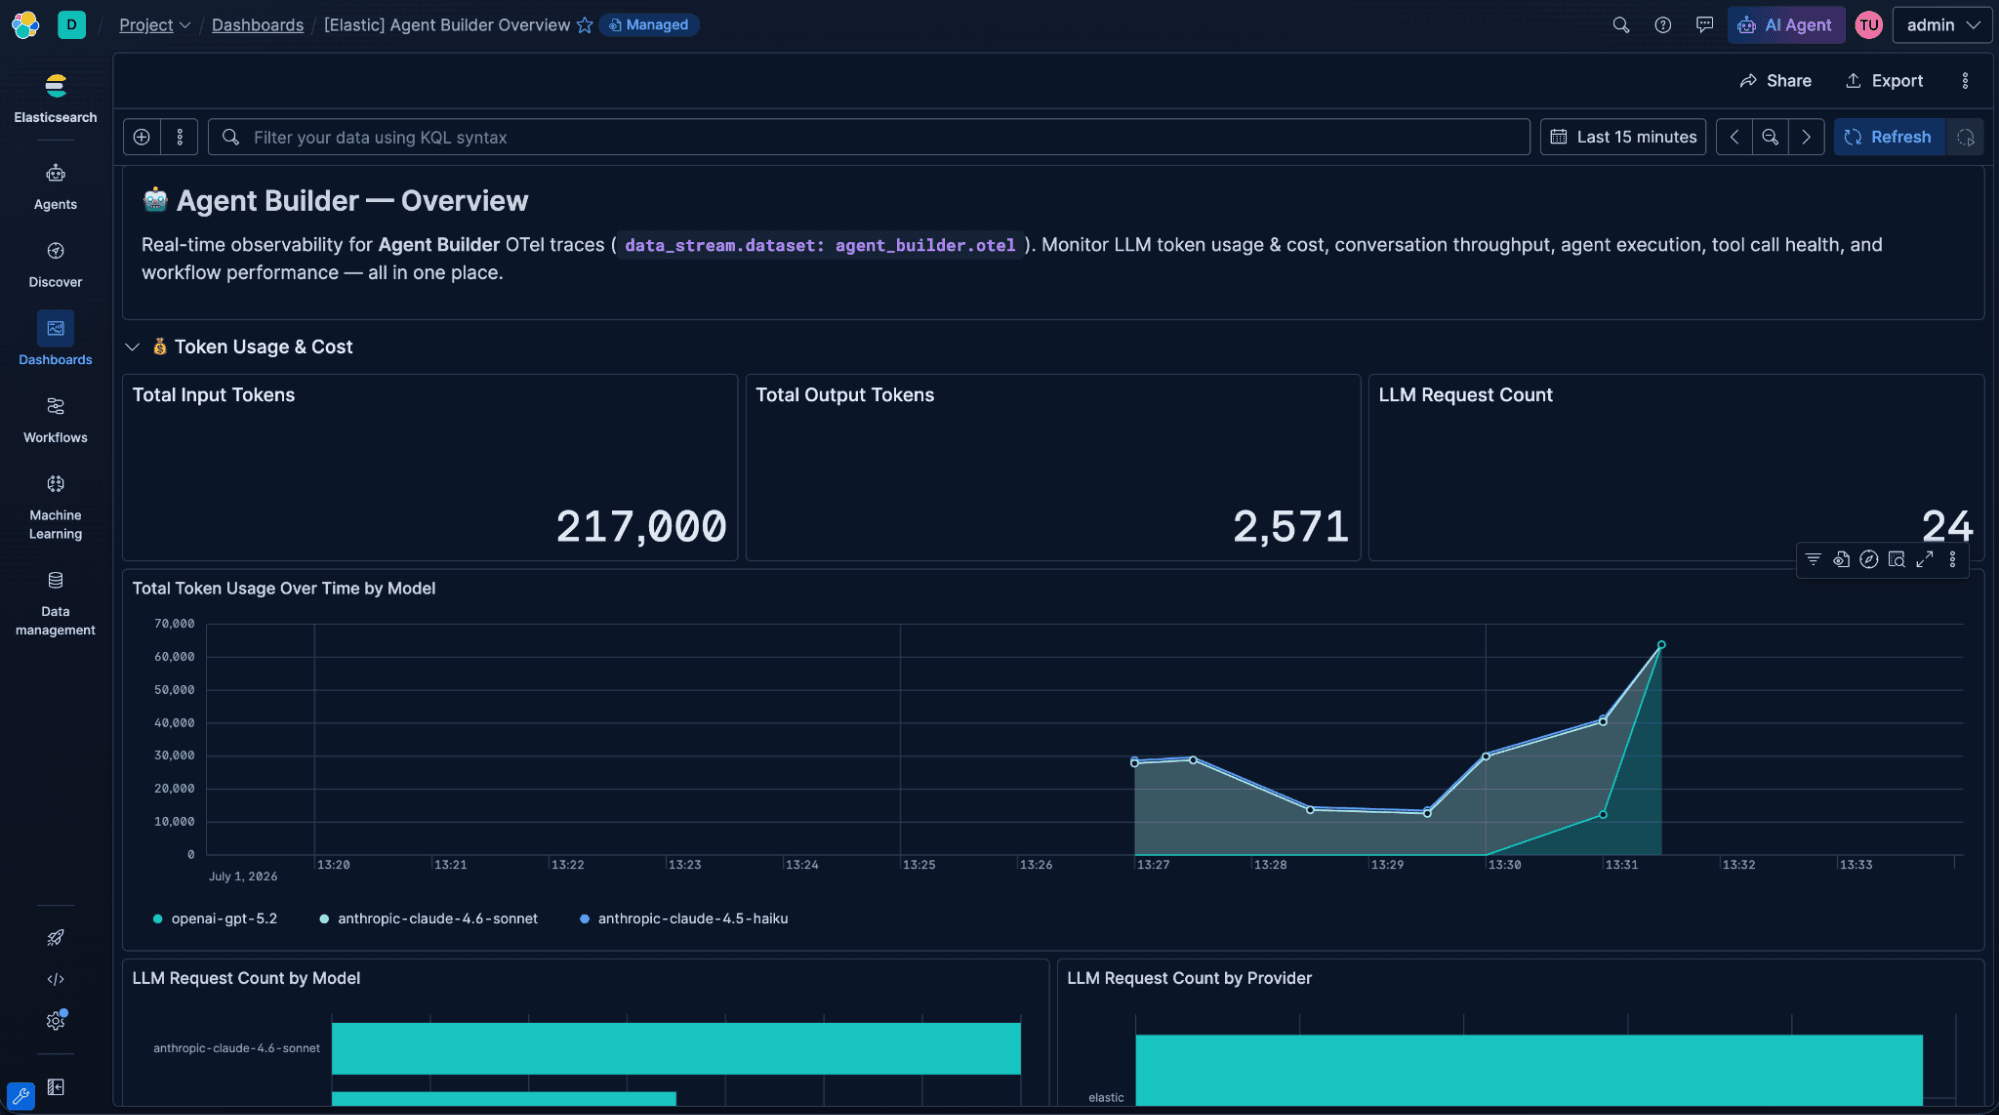
However, a custom dashboard may be more efficient. If you want something more tailored, build Lens panels directly against the OTel trace index. Some useful panels to start with:
- Most active conversations by token spend
create a horizontal bar chart against traces-agent_builder.otel-<space-id>. Set the x-axis to gen_ai.conversation.id and sort descending and limit to the top 10. Set the y-axis to a sum of gen_ai.usage.input_tokens plus gen_ai.usage.output_tokens. Input the formula as:
Conversations with the most LLM round-trips
Option to create this visualization with a simple ES|QL query that would look like:
There is also a dashboard-management skill that can be used to help create traces visualizations using natural language.
How to set token cost alerts for Agent Builder conversations
Token consumption is the most direct cost lever for LLM-based agents. A single runaway conversation can blow through your monthly budget before anyone notices.
Elastic alerting lets you define a threshold rule directly against the trace data. Navigate to Observability > Alerts > Manage Rules > Create Rule and select Elasticsearch query as the rule type.
A rule that fires when any single conversation exceeds 256,000 tokens looks like this as an ES|QL rule:
Set the schedule to run every 15 minutes and configure the action to send a Slack notification or open a PagerDuty incident. The gen_ai.conversation.id value in the alert payload gives you the exact conversation to inspect.
What’s coming next for Agent Builder observability
Agent traces give you visibility that goes far beyond debugging. Once you've built dashboards and configured alerts against Agent Builder trace data, you have a live pulse on how your agents are behaving in production. If you haven't already, spin up Agent Builder in your Kibana space, make sure tracing is enabled, and run a few conversations. Check Discover, pull up the waterfall view, and see what your agent is actually doing under the hood.
This is the first in a series of posts on Agent Builder observability. Coming up, we'll go deeper on using the agent-builder-traces skill to query your data conversationally, building custom evaluation pipelines from trace data, and using traces to feed conversation history back into your agents. Your agents have been keeping secrets. It's time to make them talk.
Related Content

July 28, 2026
One prompt, a complete workflow: Elastic's AI agent writes your automation for you
Elastic Workflows takes a plain-text prompt and generates YAML you can inspect, version and run against your Elasticsearch data. Now GA, with human-in-the-loop workflows in Slack, parallel execution, and 10 new connectors.
July 23, 2026
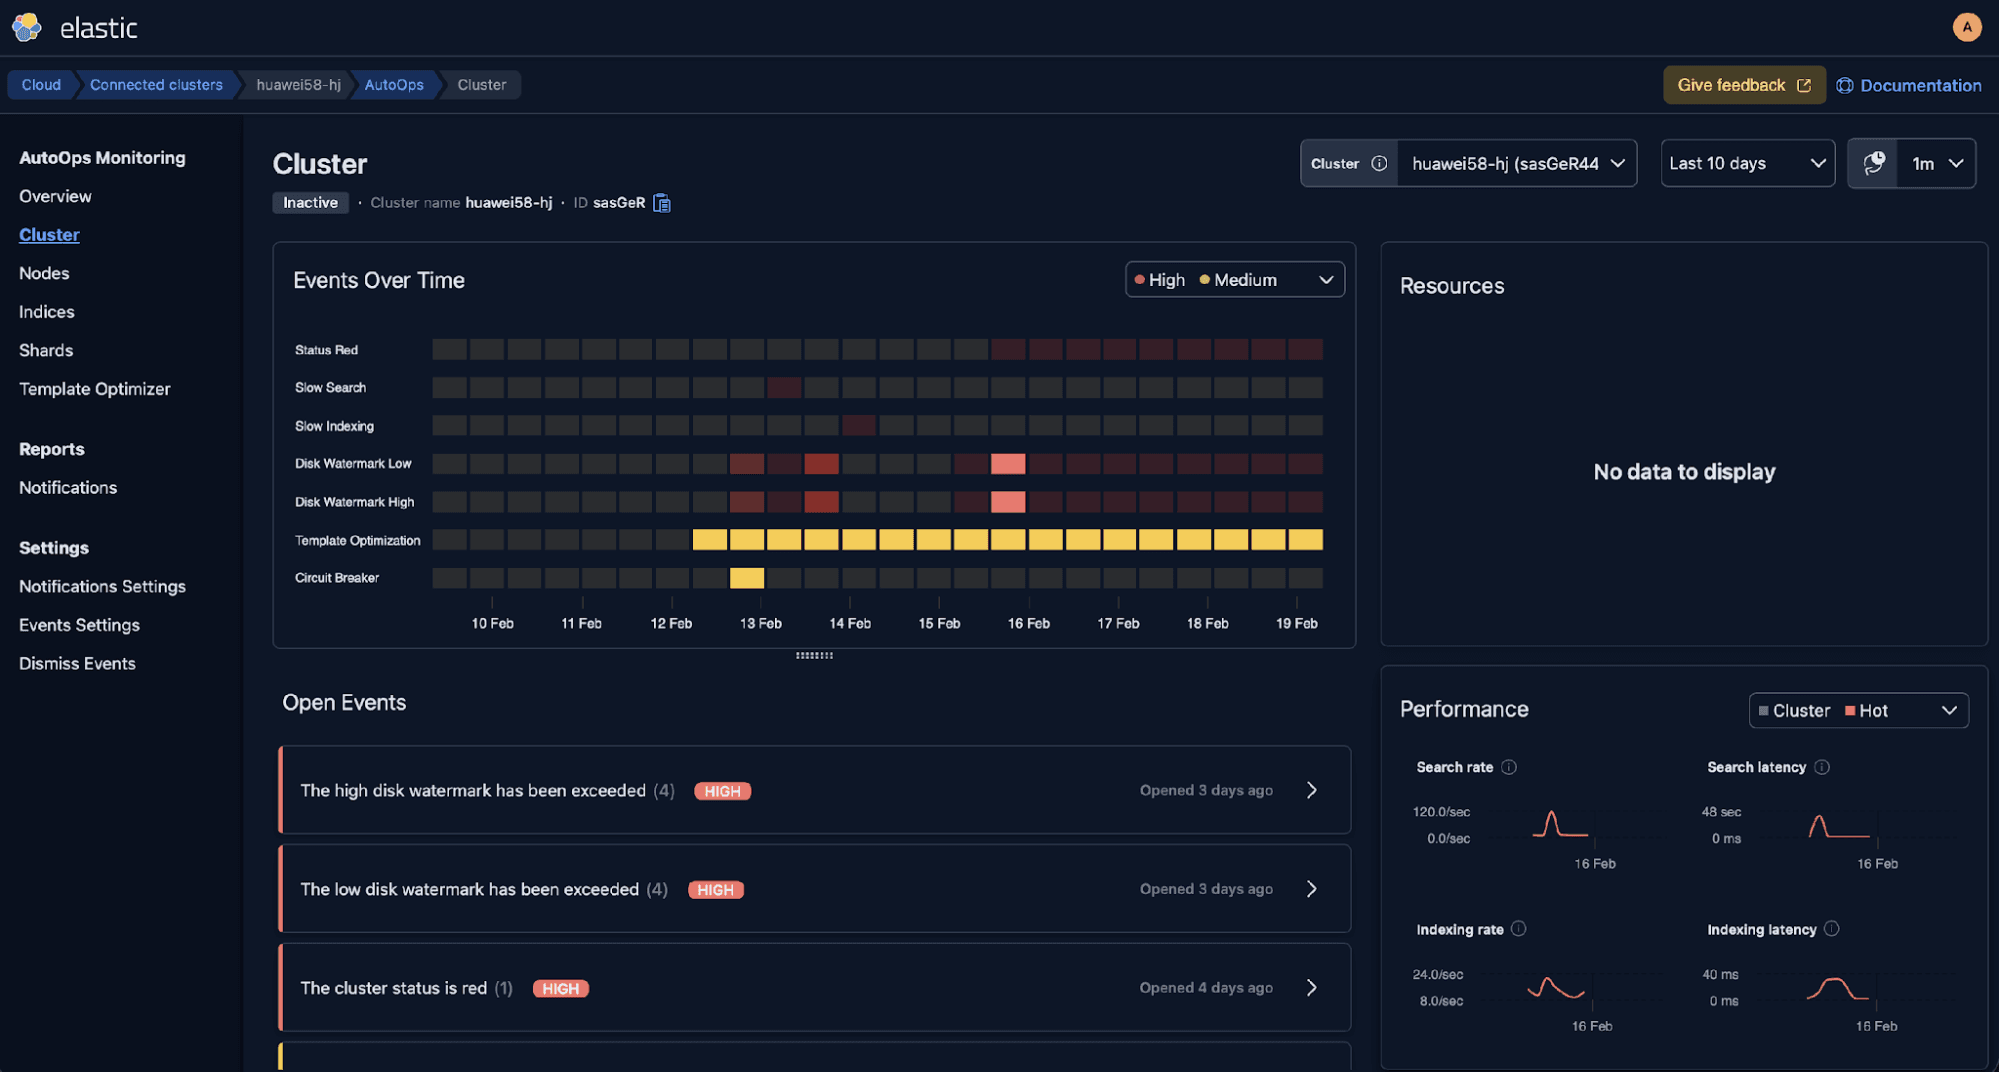
Faster Elasticsearch issue triage with redesigned AutoOps
AutoOps introduces clearer severity, updated page layouts, and simpler issue triage for Elastic Cloud Hosted deployments and Cloud Connect clusters.
July 20, 2026
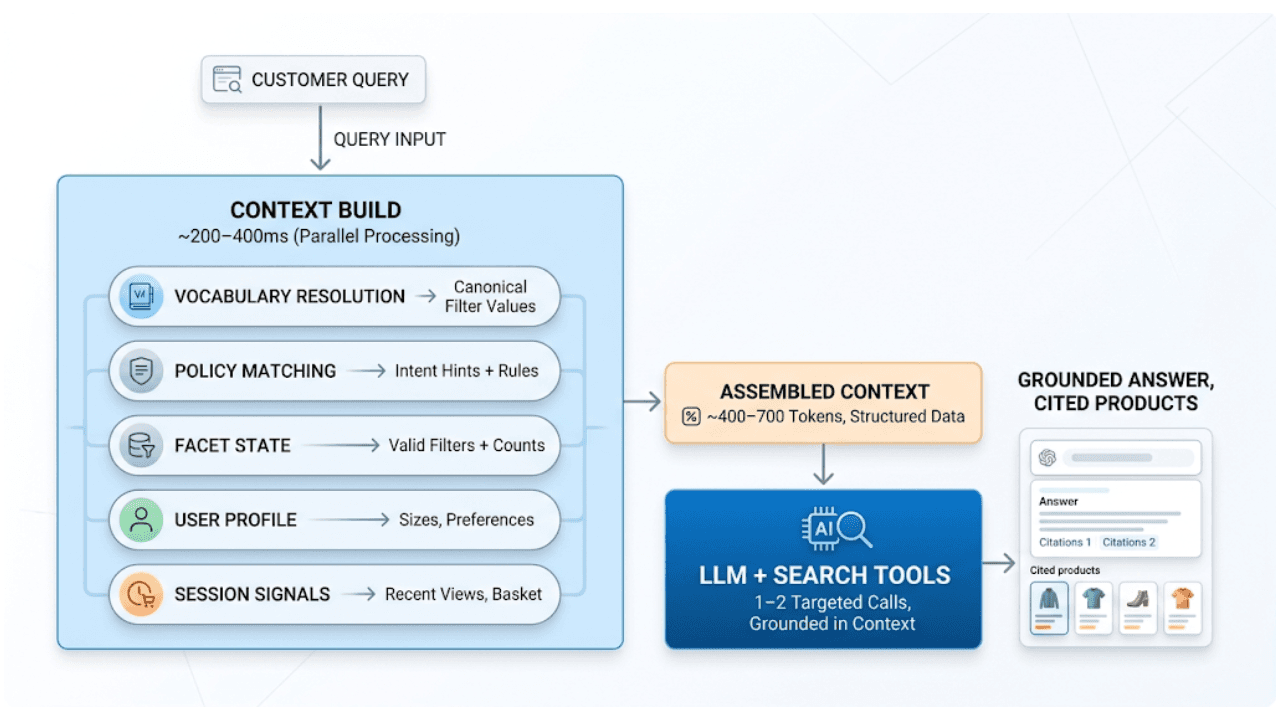
AI shopping agents: Why context comes before the query
AI shopping agents that guess at your vocabulary make expensive mistakes. Pre-computed catalog context stops the guessing before the first tool call.
July 15, 2026
98.9% faster queries, 4x more indexing throughput: a systematic Elasticsearch performance diagnosis
Use AutoOps, the Profile API and ES Rally together to find cluster hotspots, slow queries and index bottlenecks, with real benchmarks showing a 98.9% latency cut and 4x indexing gain.

July 7, 2026
Your compliance posture just got an upgrade: Elasticsearch now supports FIPS 140-3
Elastic 9.4 brings FIPS 140-3 support for Elasticsearch and Kibana to GA. Here's what changes for federal, defense and regulated deployments, and how to migrate from 140-2.