Test Elastic's leading-edge, out-of-the-box capabilities. Dive into our sample notebooks in the Elasticsearch Labs repo, start a free cloud trial, or try Elastic on your local machine now.
When tuning Elasticsearch for high-concurrency workloads, the standard approach is to maximize RAM to keep the working set of documents in memory to achieve low search latency. Consequently, best_compression is rarely considered for search workloads, as it is primarily viewed as a storage saving measure for Elastic Observability and Elastic Security use cases where storage efficiency takes priority.
In this blog, we demonstrate that when the dataset size significantly exceeds the OS page cache, best_compression improves search performance and resource efficiency by reducing the I/O bottleneck.
The setup
Our use case is a high-concurrency search application running on Elastic Cloud CPU optimized instances.
- Data volume: ~500 million documents
- Infrastructure: 6 Elastic Cloud (Elasticsearch service) instances (each instance: 1.76 TB storage | 60 GB RAM | 31.9 vCPU)
- Memory-to-storage ratio: ~5% of the total dataset fits into RAM
The symptoms: high latency
We observed that when the number of current requests spiked around 19:00, the search latency deteriorated significantly. As shown in Figure 1 and Figure 2, while traffic peaked around 400 requests per minute per Elasticsearch instance, the average query service time degraded to over 60ms.
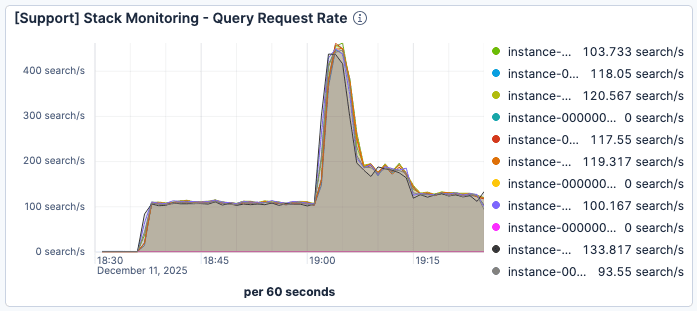
Figure 1. Requests per minute per Elasticsearch instance peaked just after 19:00 at about 400.
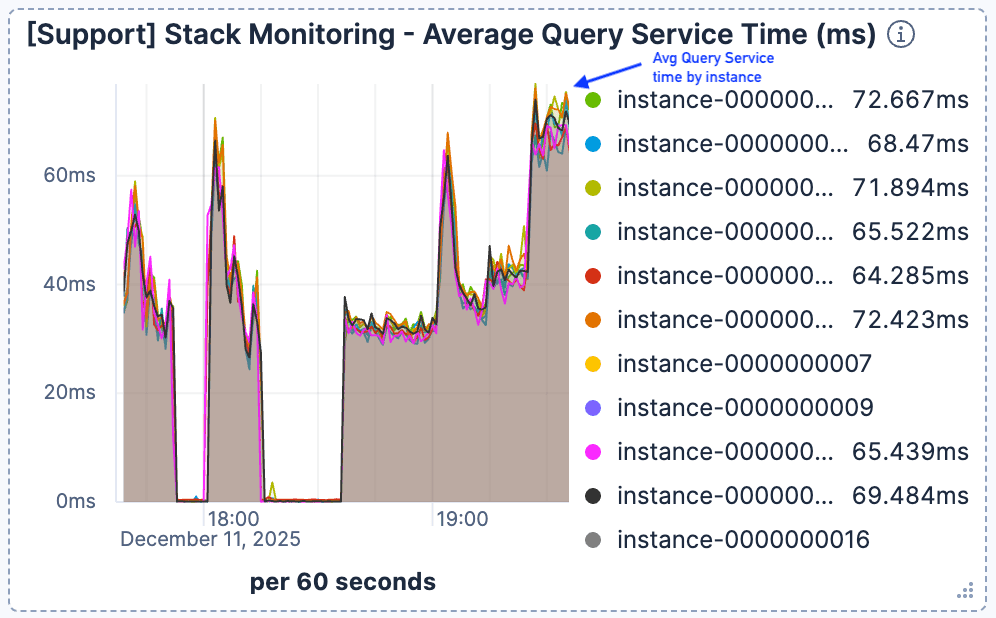
Figure 2. The average query service time started to spike and climbed to and stayed at >60ms.
The CPU usage remained relatively low after the initial connections handling, indicating that compute was not the bottleneck.
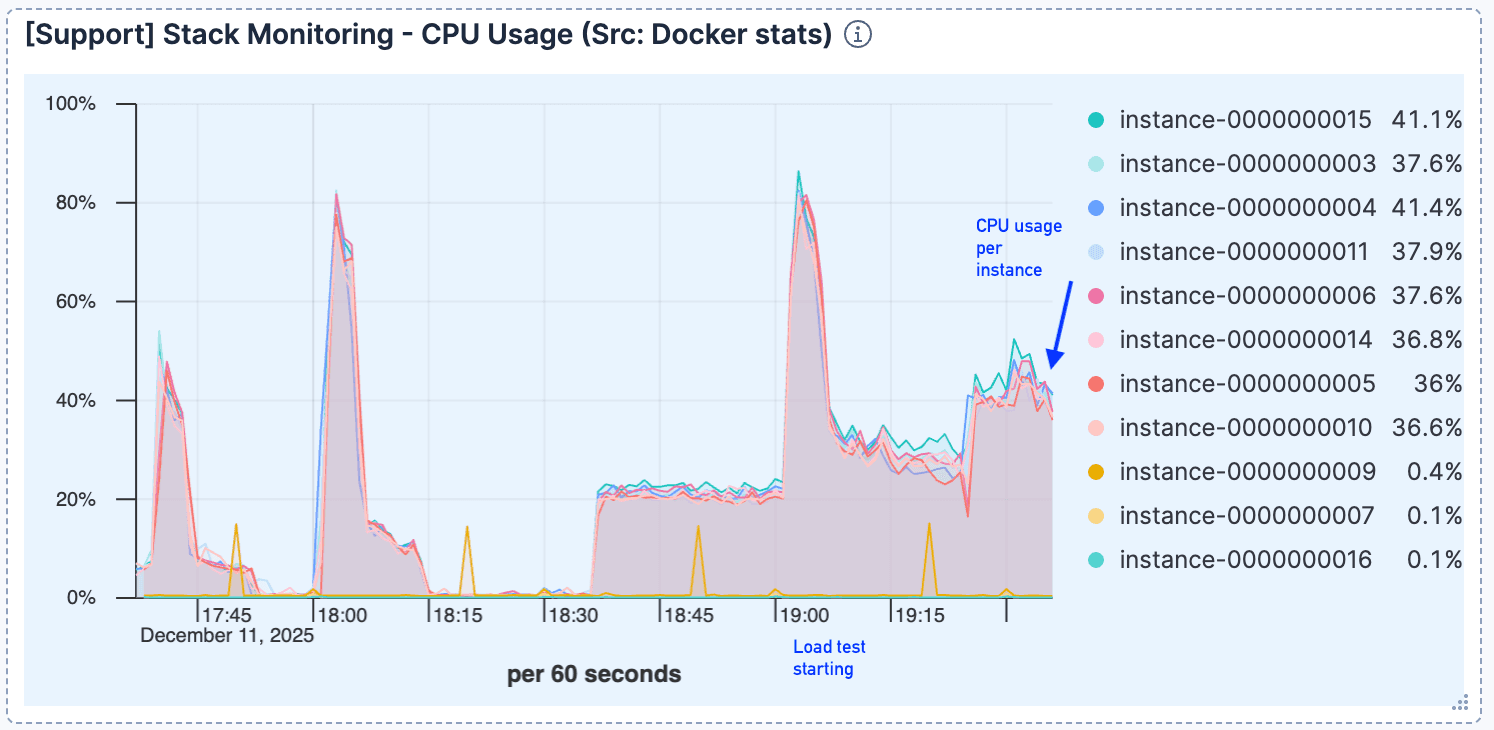
Figure 3. After the initial jump, CPU usage remains relatively low.
A strong correlation emerged between query volume and page faults. As requests increased, we observed a proportional rise in page faults, peaking around 400k/minute. This indicated that the active dataset could not fit in the page cache.
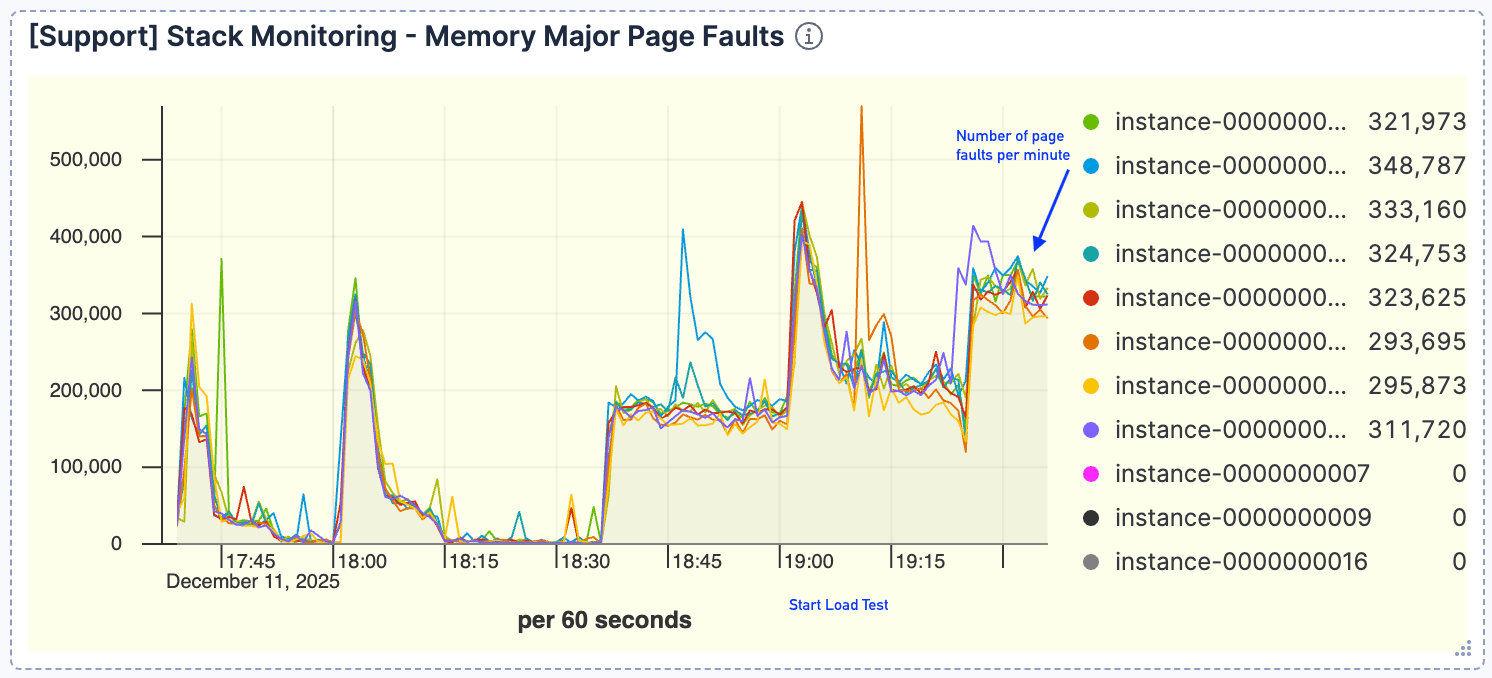
Figure 4. The number of page faults was high, peaking around 400k/minute.
Simultaneously, the JVM heap usage appeared to be normal and healthy. This ruled out garbage collection issues and confirmed the bottleneck was I/O.
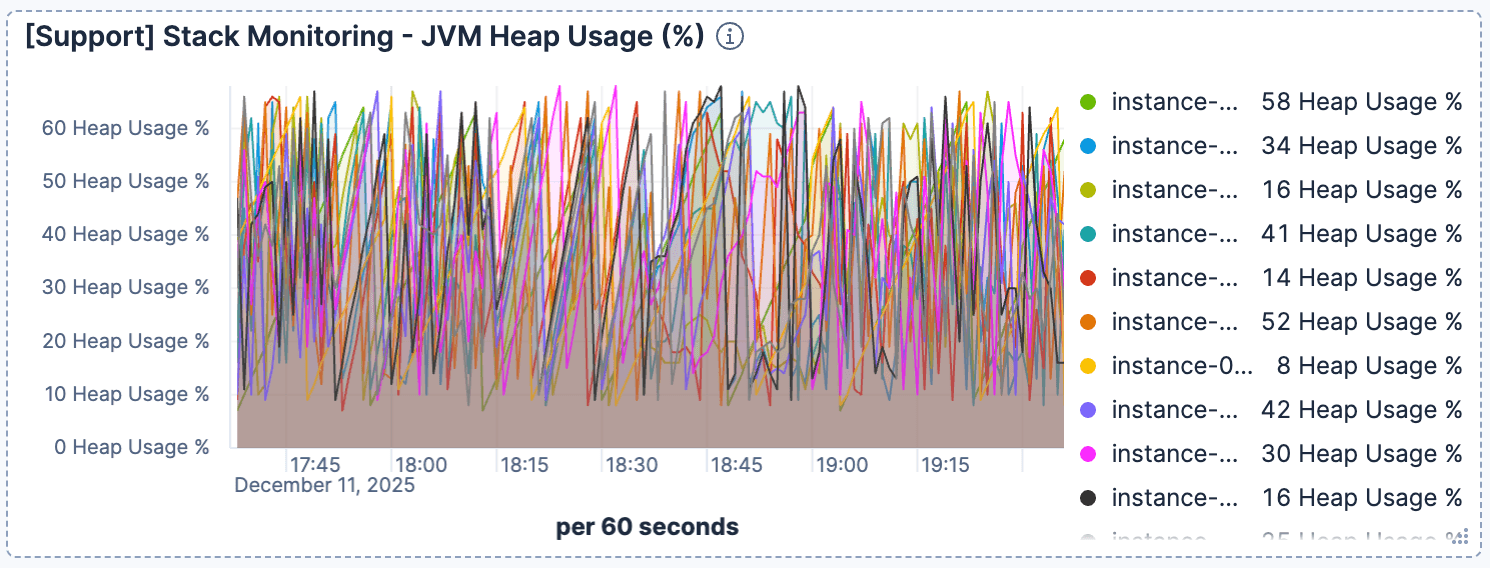
Figure 5. Heap usage remained flat.
The diagnosis: I/O bound
The system was I/O bound. Elasticsearch relies on the OS page cache to serve index data from memory. When the index is too large for the cache, queries trigger expensive disk reads. While the typical solution is to scale horizontally (add nodes/RAM), we wanted to exhaust efficiency improvements on our existing resources first.
The fix
By default, Elasticsearch uses LZ4 compression for its index segments, striking a balance between speed and size. We hypothesized that switching to best_compression (which uses zstd) would reduce the size of indices. A smaller footprint allows a larger percentage of the index to fit in the page cache, trading a negligible increase in CPU (for decompression) for a reduction in disk I/O.
To enable best_compression, we reindexed the data with the index setting index.codec: best_compression. Alternatively, the same result could be achieved by closing the index, resetting the index codec to best_compression, and then performing a segment merge.
The results
The results confirmed our hypothesis: improved storage efficiency directly translated into a substantial boost in search performance with no accompanying increase in CPU utilization.
Applying best_compression reduced the index size by approximately 25%. While less than the reduction seen in repetitive log data, this 25% reduction effectively increased our page cache capacity by the same margin.
During the next load test (starting at 17:00), the traffic was even higher, peaking at 500 requests per minute per Elasticsearch node.
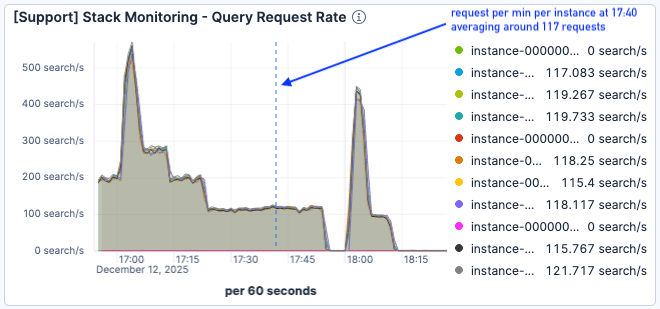
Figure 6. The load test started around 17:00.
Despite the higher load, the CPU utilization was lower than in the previous run. The elevated usage in the earlier test was likely due to the overhead of excessive page fault handling and disk I/O management.
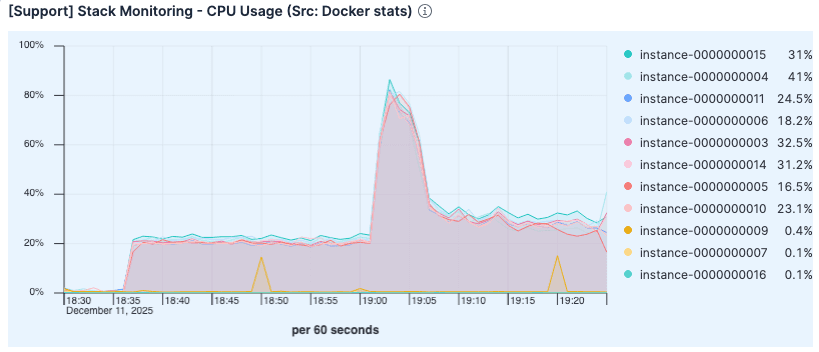
Figure 7. CPU utilization was lower than the previous run.
Crucially, page faults dropped significantly. Even at higher throughput, faults hovered around <200k per minute, compared to >300k in the baseline test.
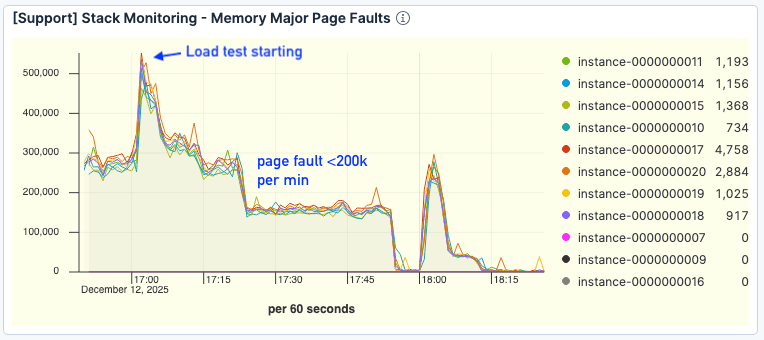
Figure 8. Number of page faults saw a significant improvement.
Although the page fault results were still less than optimal, query service time was cut by about 50%, hovering below 30ms even under heavier load.
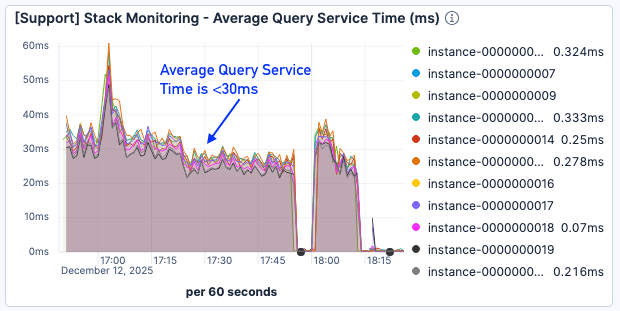
Figure 9. Average query service time was <30ms.
The conclusion: best_compression for search
For search use cases where data volume exceeds available physical memory, best_compression is a potent performance-tuning lever.
The conventional solution to cache misses is to scale out to increase RAM. However, by reducing the index footprint, we achieved the same goal: maximizing the document count in the page cache. Our next step is to explore index sorting to further optimize storage and squeeze even more performance out of our existing resources.
Related Content

July 9, 2026
Why Elasticsearch is becoming a columnar database
Elasticsearch is becoming a first-class columnar database. Columnar Mode ships in 9.5, storing data once alongside the existing modes and cutting storage footprints while speeding up analytical queries.

July 7, 2026
Your compliance posture just got an upgrade: Elasticsearch now supports FIPS 140-3
Elastic 9.4 brings FIPS 140-3 support for Elasticsearch and Kibana to GA. Here's what changes for federal, defense and regulated deployments, and how to migrate from 140-2.

July 2, 2026
A simdvec deep-dive: How Elasticsearch uses neural-net and video-codec CPU instructions for vector search
Four ways Elasticsearch's vector search engine reuses neural-network, video-codec and cryptography CPU instructions for up to 6x speedups; with the math, the failed attempts and the benchmarks.

June 29, 2026
Bringing it together: How we rebuilt Elasticsearch as a columnar metrics engine; 6.6x less storage, 160x faster queries
Elasticsearch metrics in version 9.4 run on a fully columnar engine: 6.6x less storage, 160x faster queries, native PromQL and OTel support.

June 11, 2026
How Elasticsearch cut metrics storage by 41% by dropping sequence numbers after replication
Find out how Elasticsearch trims sequence numbers at merge time to cut TSDS storage by 41%, what you give up, and why it's safe for metrics workloads.