Service monitoring and availability made simple with Elastic Uptime and Heartbeat
In the world of IT, availability can mean a lot of things. Your website is available if it is up, responding in a timely manner, sending the correct headers, and serving a valid certificate. Your network is available if the correct hosts are online, responding to ICMP pings, and responding to TCP requests on specific ports. Your API endpoint is available if it returns the correct values when sent specific requests. And your development team’s productivity is available when GitHub is online and able to accept pull requests.
Elastic Uptime (powered by Heartbeat) allows us to track that availability and more. In this blog, we’ll take a look at how it works, how you can easily monitor your apps and services directly from Kibana, and how you can combine that uptime data with logs, metrics, and traces for unified visibility across your entire ecosystem in Elastic Observability.
Navigating Elastic Uptime
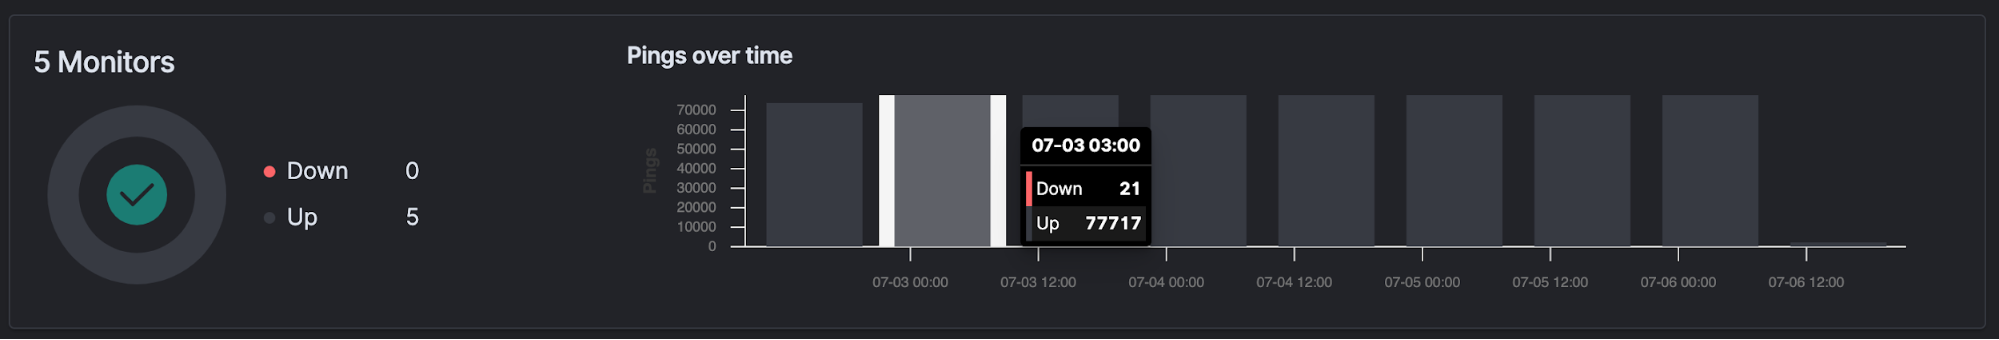
Let’s start with the Elastic Uptime interface. Uptime is designed to provide you with an overview of all the services that you are monitoring. Each endpoint, URL, or service is referred to as a monitor. On the top row of the app, there is a count of monitors as well as a breakdown of how many services are up and how many are down. A histogram shows a count of “Pings over time” with a breakdown of Up and Down counts per time bucket.
Below that is a table with information about each monitor, including the URI, TLS certificate expiration time (if applicable), and mini date sparklines of downtimes.
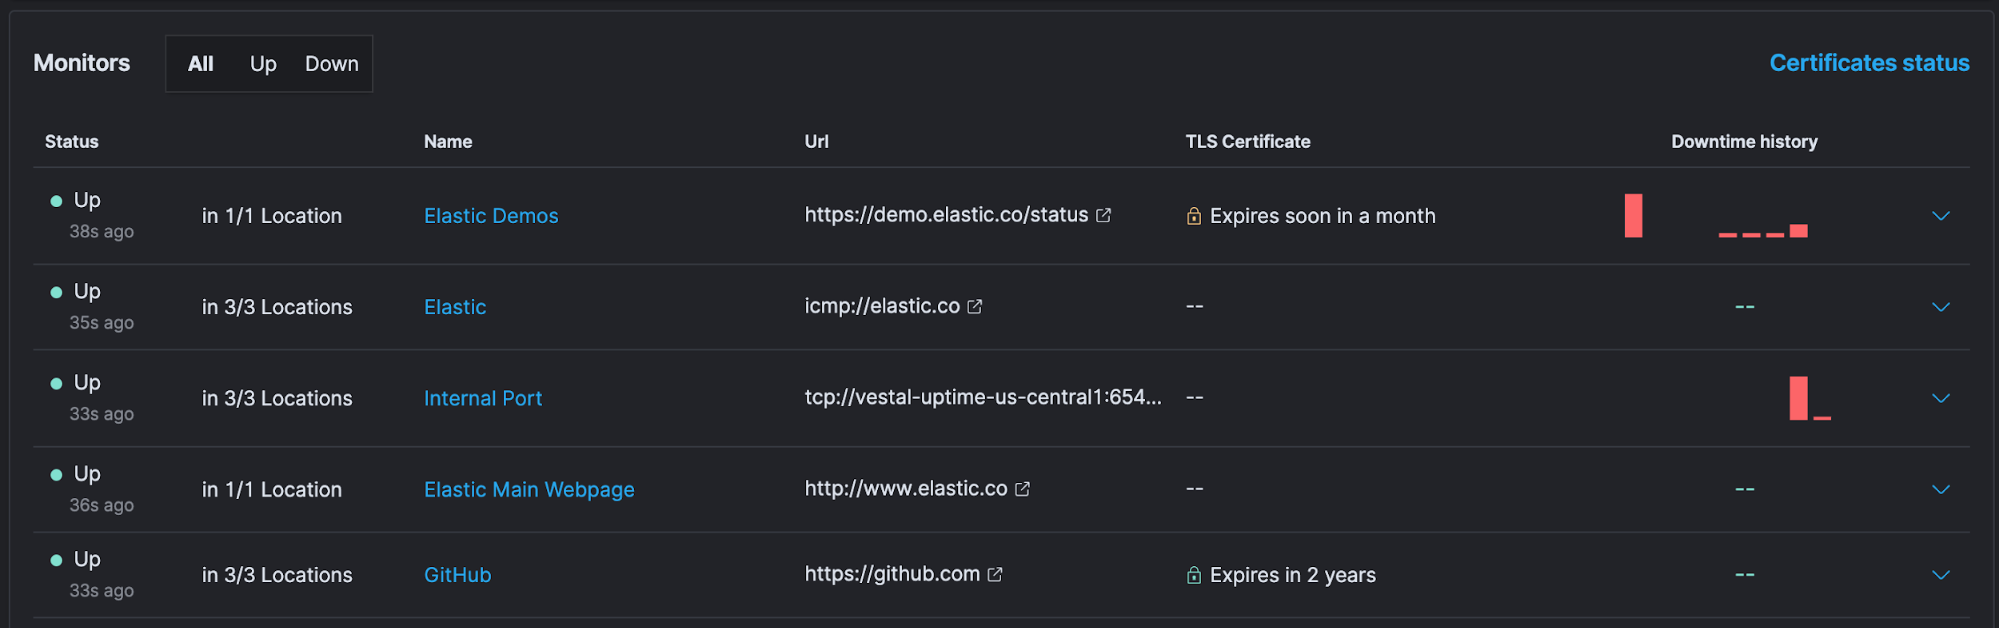
Also, at the top of this table, you can click on Certificates status to easily view information about certificates that are being monitored.
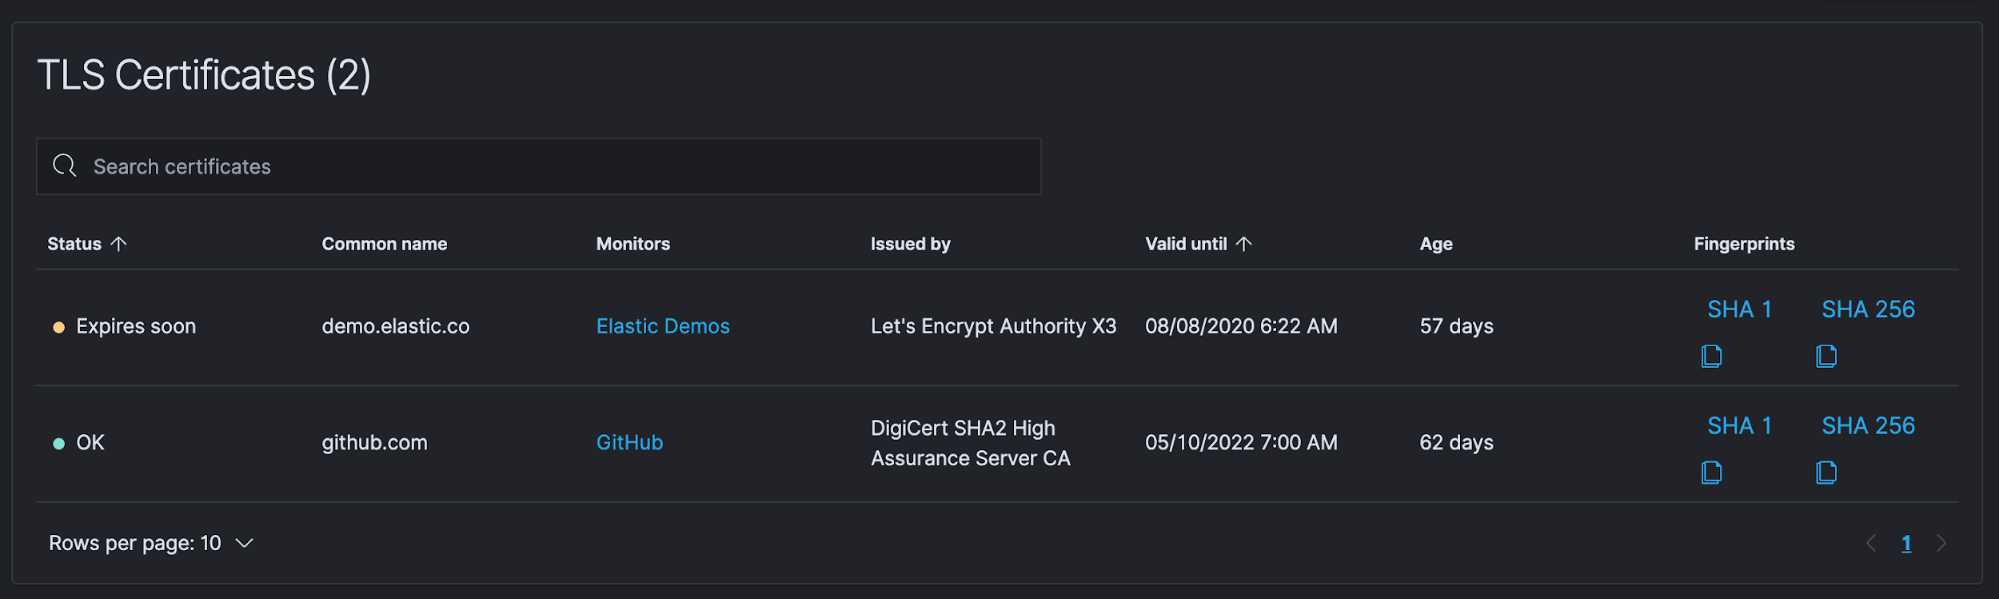
Keeping your site certificates up to date is a simple process, but one that can easily be forgotten. When certificates expire it can cost companies millions of dollars. According to a recent report, enterprises lose an average of $11.1 million from a single unexpected certificate expiration event, and 71% of organizations don’t know how many keys and certificates they have.
With Elastic Uptime, you can configure expiration/age thresholds and then automatically collect a site’s certificate information — especially their expiration dates. You can then enable alerting (covered in an upcoming post) when a cert is close to expiring or exceeding a configurable age limit, allowing you to easily avoid these hugely expensive events.
Collecting service data with Heartbeat
Heartbeat powers all of these monitors and feeds information into Elasticsearch and Uptime. Heartbeat is just one of our Beats — lightweight data shippers each designed for a particular use case.
Heartbeat allows you to easily monitor services for their availability with active probing. Given a list of URLs, Heartbeat asks questions such as: Is the endpoint alive? Is the response code sent back the expected one? Do the headers match what I need them to be? Does the payload match a key phrase? Heartbeat ships this information and response time to the rest of the Elastic Stack for further analysis
That’s Elastic Uptime in a nutshell. Let’s take a look at it in action with an example that monitors HTTP availability.
Example: Monitoring HTTP availability
To keep things simple, we’ll be running our deployment on Elastic Cloud. You can start a free trial and follow along to try out Uptime yourself. Also, we’ll run Heartbeat from three different Google Compute Engine (GCE) virtual machines (VMs), each in a different geographical location.
Heartbeat installation and configuration
Installing and configuring your first Heartbeat instance is simple:
- Go to the Try it yourself section of our Uptime Monitoring landing page.
- Since we'll be using a free trial of Elasticsearch Service, stay on the Hosted set of instructions.
- Follow the steps in 1. Set up Elastic Cloud to get your deployment up and running. Be sure to write down your cluster ID and password. You'll need it in a bit.
- Once your Elastic Cloud deployment is up and running, follow the steps in 2 Set up Heartbeat to install Heartbeat on your first VM. This step conveniently provides the steps to download and unpack Heartbeat and helps you store your Elastic Cloud credentials in the keystore.
There are several options for installing Heartbeat. We’re going to download the compressed file and run it locally, but you can also choose to install it with a package manager that your system supports.
First, download Heartbeat. In this case we are using wget, but you can also use curl:
wget https://artifacts.elastic.co/downloads/beats/heartbeat/heartbeat-7.8.0-linux-x86_64.tar.gz
Then uncompress the download:
tar xzf heartbeat-7.8.0-linux-x86_64.tar.gz
Change into the uncompressed directory and store the connection credentials in the Heartbeat keystore:
./heartbeat keystore add HEARTBEAT_ES_PWD
The first time you run this it will ask you if you wish to create a keystore. Enter y to create it.
When prompted, enter your elastic user password. Then store your Elastic Cloud deployment Cloud_ID:
./heartbeat keystore add HEARTBEAT_CLOUD_ID
Here's what a successful keystore creation will look like:
jeffvestal@vestal-uptime-us-central1:~/elastic/heartbeat-7.8.0-linux-x86_64$ ./heartbeat keystore add HEARTBEAT_ES_PWD
The keystore does not exist. Do you want to create it? [y/N]: y
Created keystore
Enter value for HEARTBEAT_ES_PWD:
Successfully updated the keystore
jeffvestal@vestal-uptime-us-central1:~/elastic/heartbeat-7.8.0-linux-x86_64$ ./heartbeat keystore add HEARTBEAT_CLOUD_ID
Enter value for HEARTBEAT_CLOUD_ID:
Successfully updated the keystore
Configure your first monitor
To configure your first monitor:
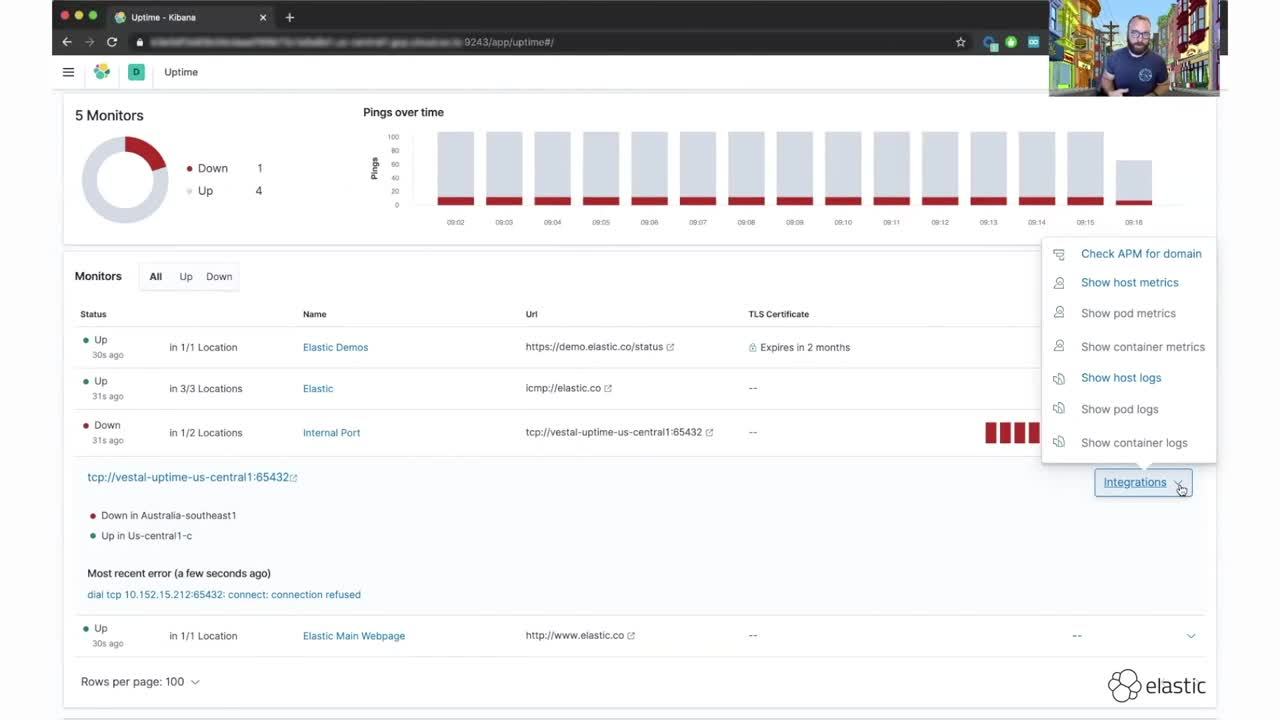
- Go to our Integrations page to see all the available inputs for Elastic Observability.
- Search for HTTP Check.
- Click on Synthetics to go to the setup guide for Heartbeat and the HTTP Check monitor.
Heartbeat’s HTTP monitor provides a lot of options, including checking specific response codes, checking for required headers, using regular expressions to match the body output, and more. For this particular check we’ll stick with standard settings, which record the response code and request duration. Here are the checks we're going to configure:
- Website: We want to know when elastic.co is having issues to ensure our customers don’t experience disruption when visiting our website. So let's configure an ICMP monitor to ensure elastic.co is available for an additional layer of monitoring.
- Demo site: Elastic’s demo site is a live cluster where you can test out the latest features in the Elastic Stack. This URL returns the status of the demo cluster, so we will verify that a response code of 200 is returned, ensuring visitors are able to access the cluster.
- Github repo: At Elastic we manage all of our code in GitHub, so a disruption to their site can cause a disruption to our development cycle. We’ll keep an eye on github.com with an additional HTTP check.
It’s common in a company’s environment to have ports and services that are only accessible from within a network. These types of ports can’t be monitored by traditional uptime services that run outside a company’s network. Running Heartbeat within your network allows you to monitor those ports and services. To demonstrate this I have a simple Python script listening on a port for TCP connections. I’ll set up a TCP monitor to verify that the port is up and responding.
heartbeat.yml
You can either edit the heartbeat.yml config file directly and configure all your monitors in there, or you can create a separate file for each monitor in the ./monitors.d/ directory. For this demo, we’ll edit heartbeat.yml directly.
There are two sections you need to edit: heartbeat.monitors and processor.add_observer_metadata with location information. To edit the .yml file, you can run:
vim heartbeat.yml
Your heartbeat.monitors section will look like this:
heartbeat.monitors:
- type: http
  id: www.elastic.co
  name: Elastic Main Webpage
  schedule: '@every 5s'
  hosts: ["http://www.elastic.co"]
- type: http
  id: www.github.com
  schedule: '@every 10s'
  name: GitHub
  urls: ["https://github.com"]
- type: http
  id: elastic-demo
  schedule: '@every 10s'
  name: Elastic Demos
  urls: ["https://demo.elastic.co/status"]
  check.response.status: 200
- type: icmp
  id: elastic-icmp
  schedule: '*/10 * * * * * *'
  name: Elastic
  hosts: ["elastic.co"]
- type: tcp
  id: internal-tcp-port
  schedule: '@every 10s'
  name: Internal Port
  hosts: ["vestal-uptime-us-central1"]
  ports: 65432
The processors section allows you to filter and enhance the data you collect. While Uptime will still collect data from multiple locations without this enrichment, adding this processor will allow the map within Uptime to display where each check is running as well as allowing for geo correlation with other observability data.
processors:
  - add_observer_metadata:
      # Optional, but recommended geo settings for the location Heartbeat is running in
      cache.ttl: 5m
      geo:
        # Token describing this location
        name: us-central1-c
        # Lat, Lon "
        location: "41.26194, -95.860833"
For a more extensive example configuration you can check out the demo config from the Uptime development team.
Test and start up Heartbeat
You can run a quick syntax check after saving your configuration file.
~/elastic/heartbeat-7.8.0-linux-x86_64$ ./heartbeat test config
After that, run setup:
./heartbeat setup
To run ICMP checks on Linux, you need to run a command with elevated privileges granting Heartbeat privileges. Your exact path to heartbeat will differ, but mine is:
sudo setcap cap_net_raw+eip /home/jeffvestal/elastic/heartbeat-7.8.0-linux-x86_64/heartbeat
You can now start Heartbeat:
~/elastic/heartbeat-7.8.0-linux-x86_64$ ./heartbeat run
Heartbeat will run in the foreground with this method. When you put this in production, you will most likely want systemd to manage the process. With Heartbeat running without any errors, let's take a look at the Uptime app to confirm we see data.
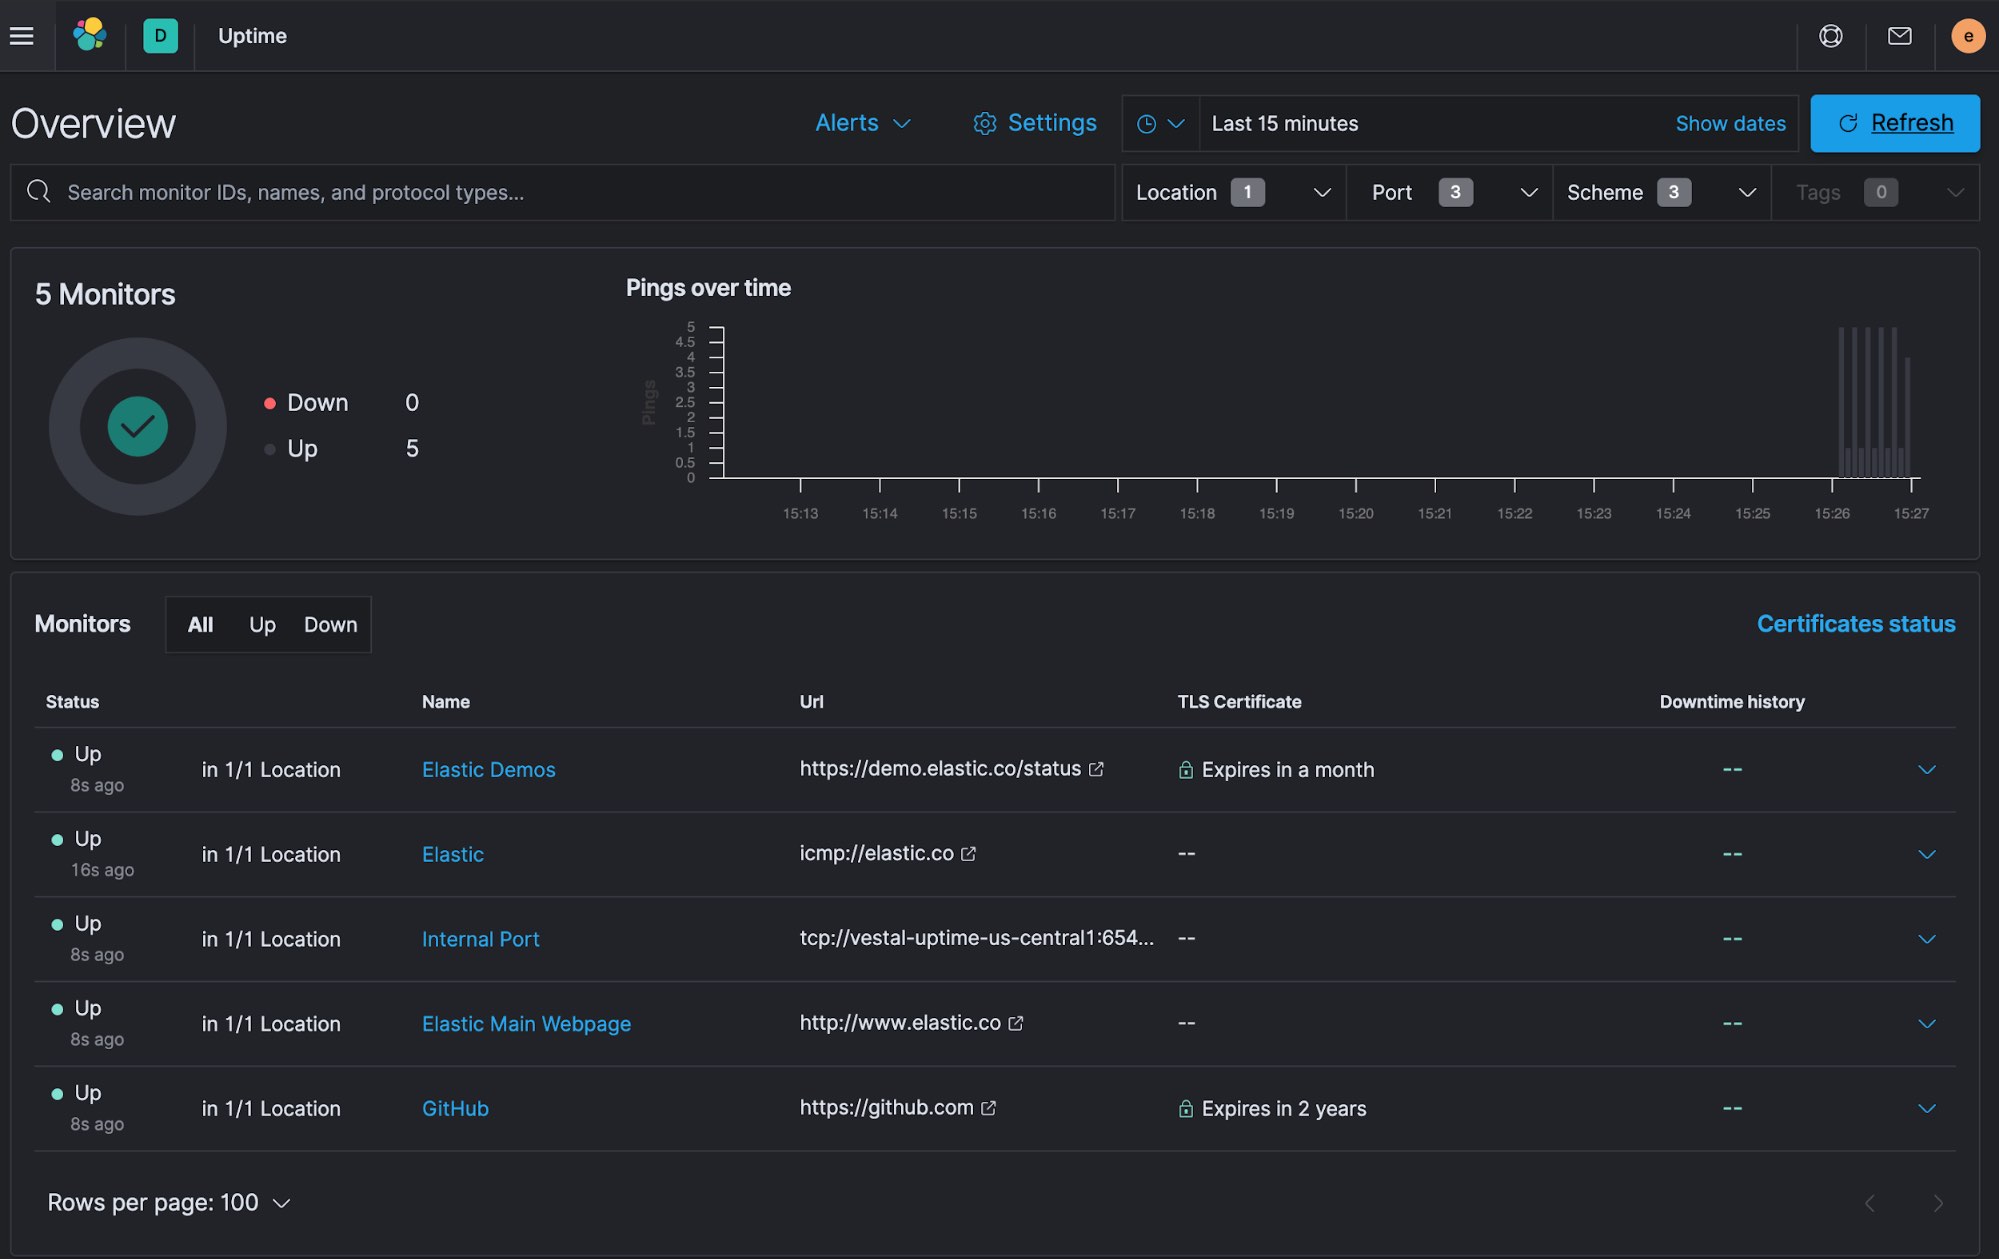
Success! You can see our five monitors all listed out and the first few bars of data appearing in the Pings over time chart.
Configure hosts in other locations
To demonstrate the geo capabilities of Heartbeat, let’s run the same checks from London as well as Australia. This will allow you to monitor the responses from multiple locations around the world and identify if there are issues isolated to a particular region versus something related to where our services are running.
There are many deployment options. Create two additional VMs, one in London and one in Australia, and repeat the install and configuration process. Once configured, start Heartbeat up on each host.

With all three Heartbeat locations up and running, let's look back at Uptime and verify we see all three locations.
Success! You can see the first monitor checks from all three locations.
Fast forward
With the monitors configured, I then let Heartbeat run through a long weekend to collect some data. Your data will naturally look different than mine. Conveniently for this blog, my monitors managed to detect some outages during the long weekend. I'll go through the results in detail below, but if you prefer a video recap, you can watch this before continuing on:
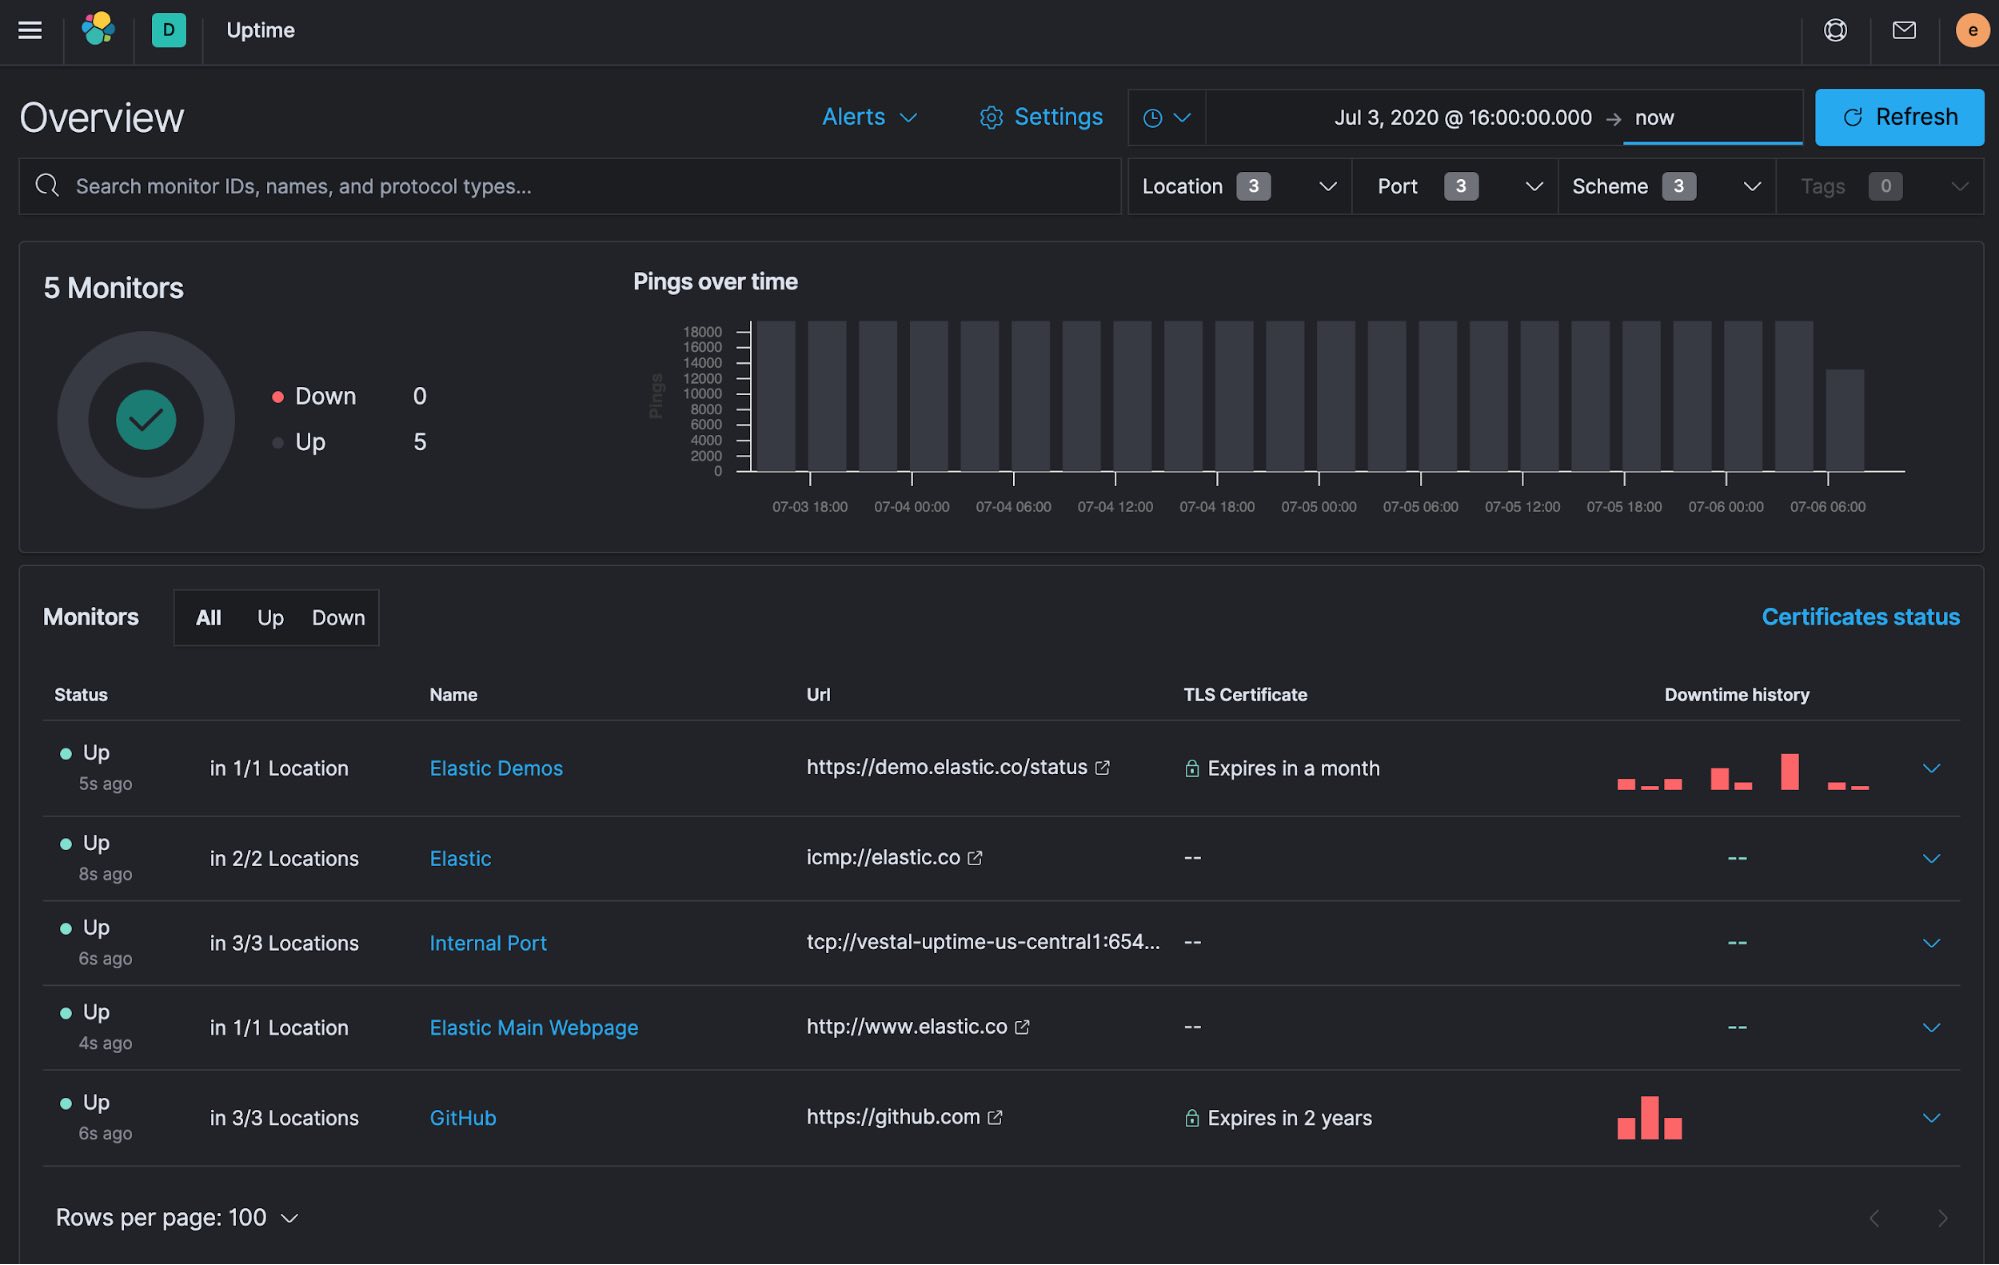
From the Overview page, you can quickly see that all five of my monitors are currently Up, but two of them detected some issues during the last couple days.
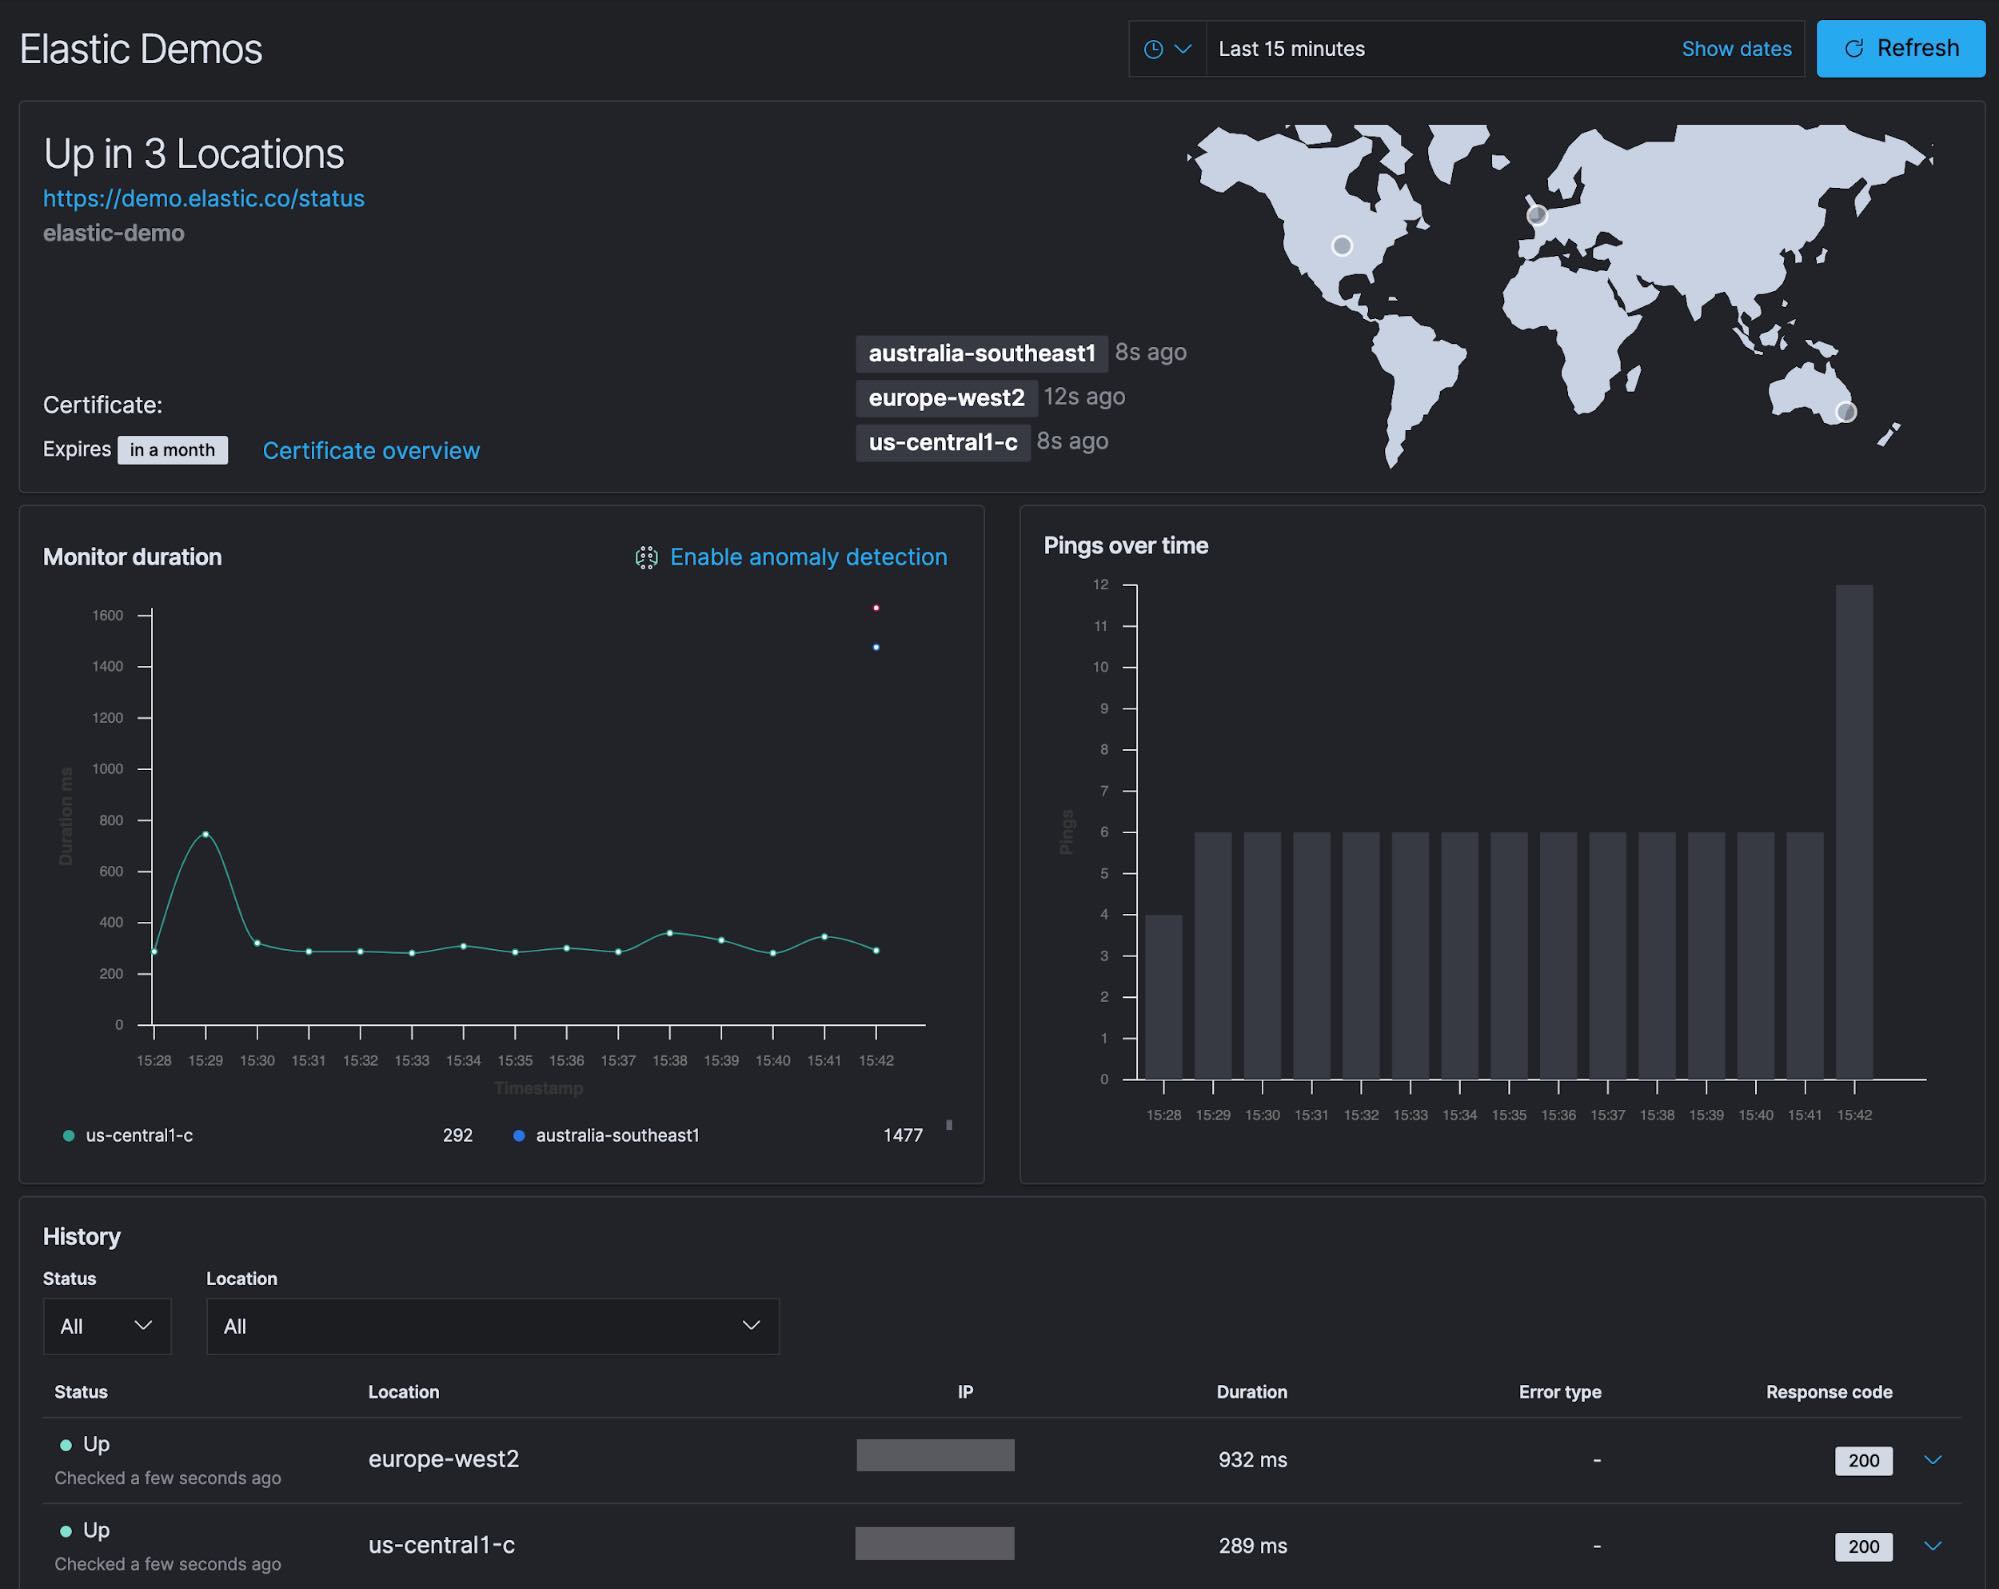
You can click into the Elastic Demos monitor and see more details to investigate further.
From the specific monitor detail screen, you’re presented with several panels of information. You can see the locations of the three monitors we configured in the US, Europe, and Australia and that they are all currently Up.
- In the top panel, you also see that the certificate for the site expires in a month.
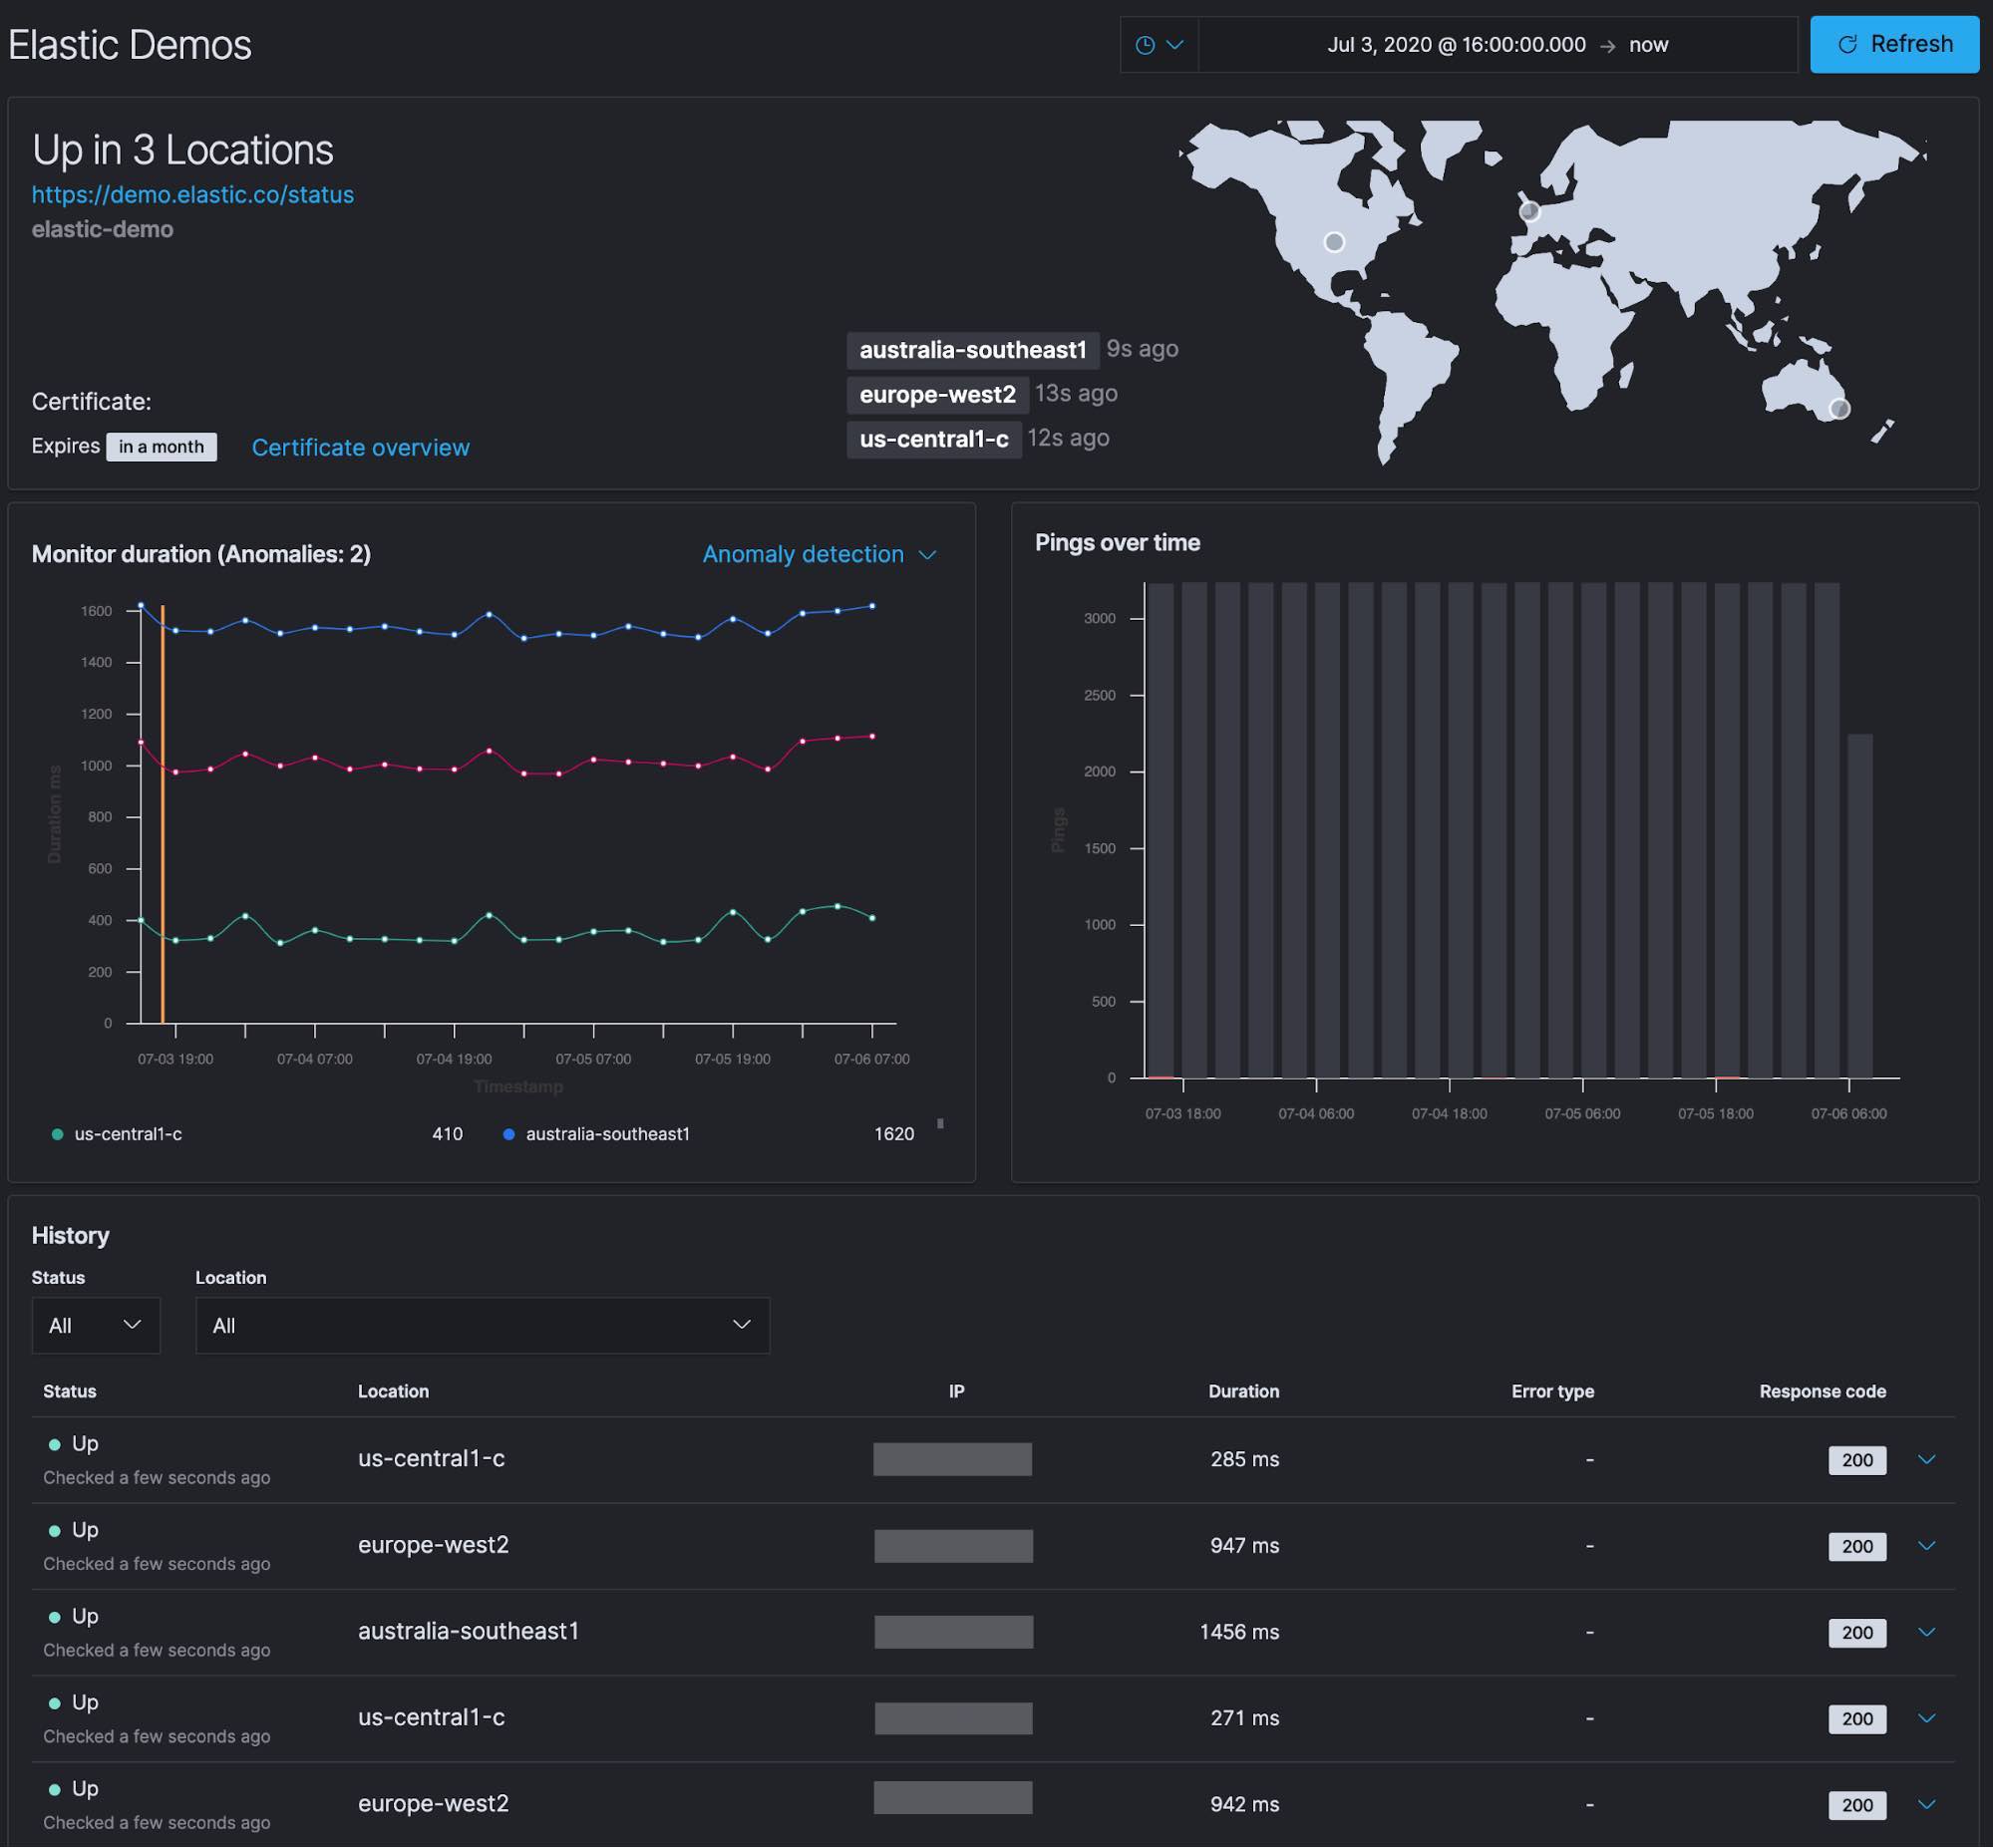
- Below that is the Monitor duration timing for each check that was performed. Included on this chart is the anomaly detection (machine learning) integration. We will discuss anomaly detection and alerting in an upcoming blog.
- To the right of the Monitor duration panel is the Pings over time chart.
- Below that is the history of each monitor check that was performed.
When you are investigating an issue and are primarily interested in when a monitor returned a Down status, you can easily select Down from the Status menu to filter only for those statuses. You can expand one of the rows by clicking on the arrow on the right to get more information.
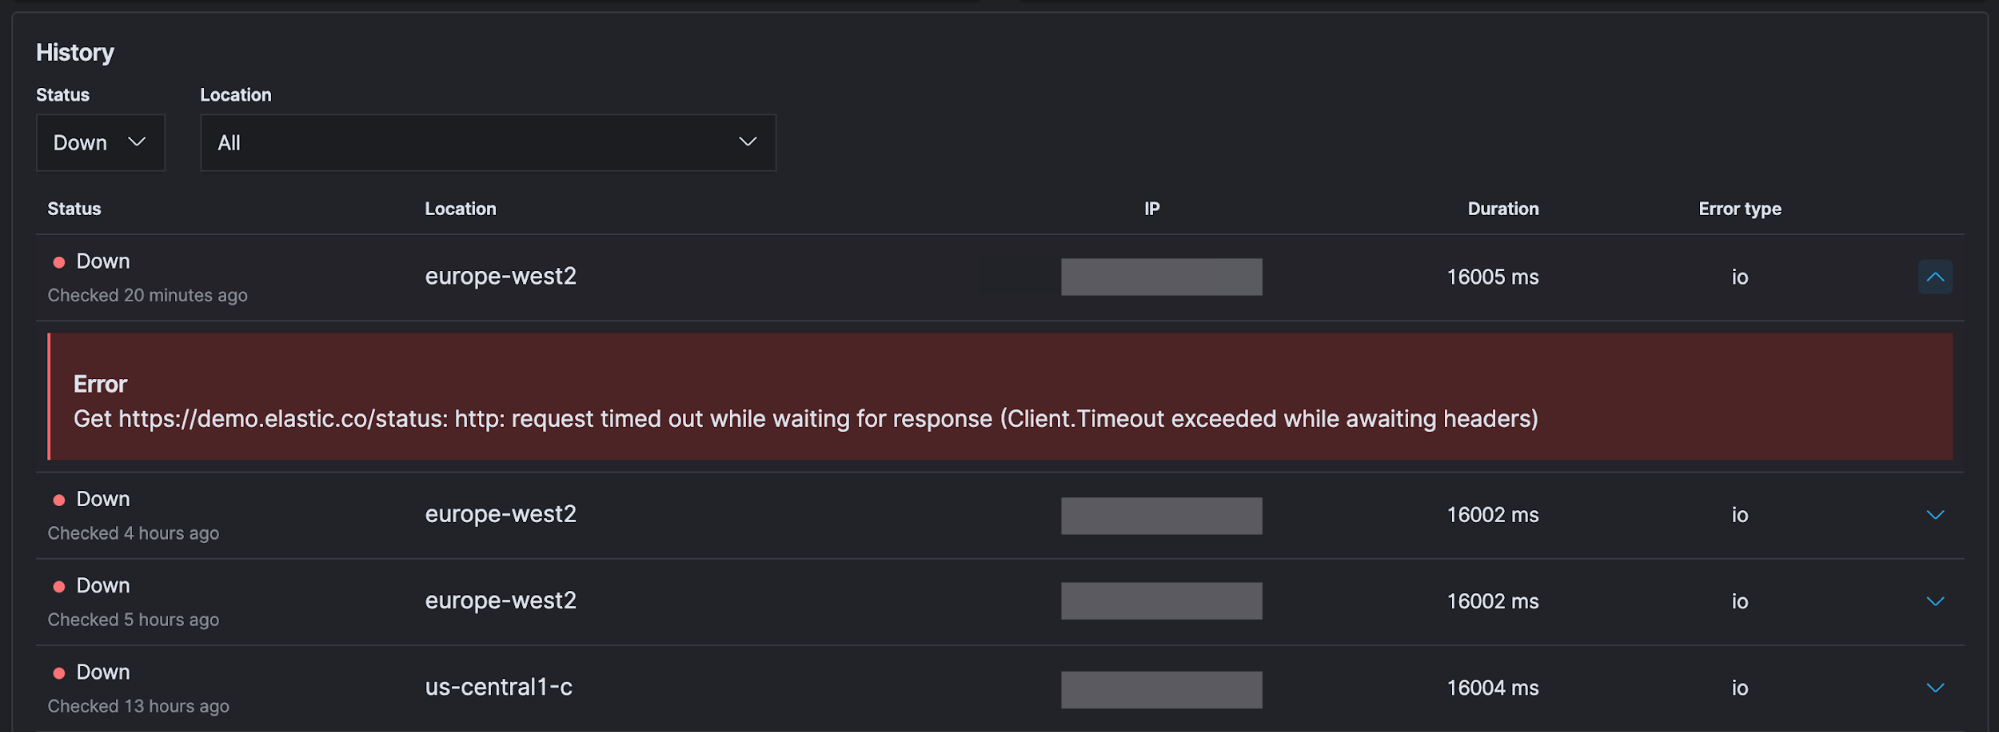
Depending on the type of monitor and configuration settings, you will get different information. In this case the monitor timed out waiting for the page to load.
Go beyond uptime data
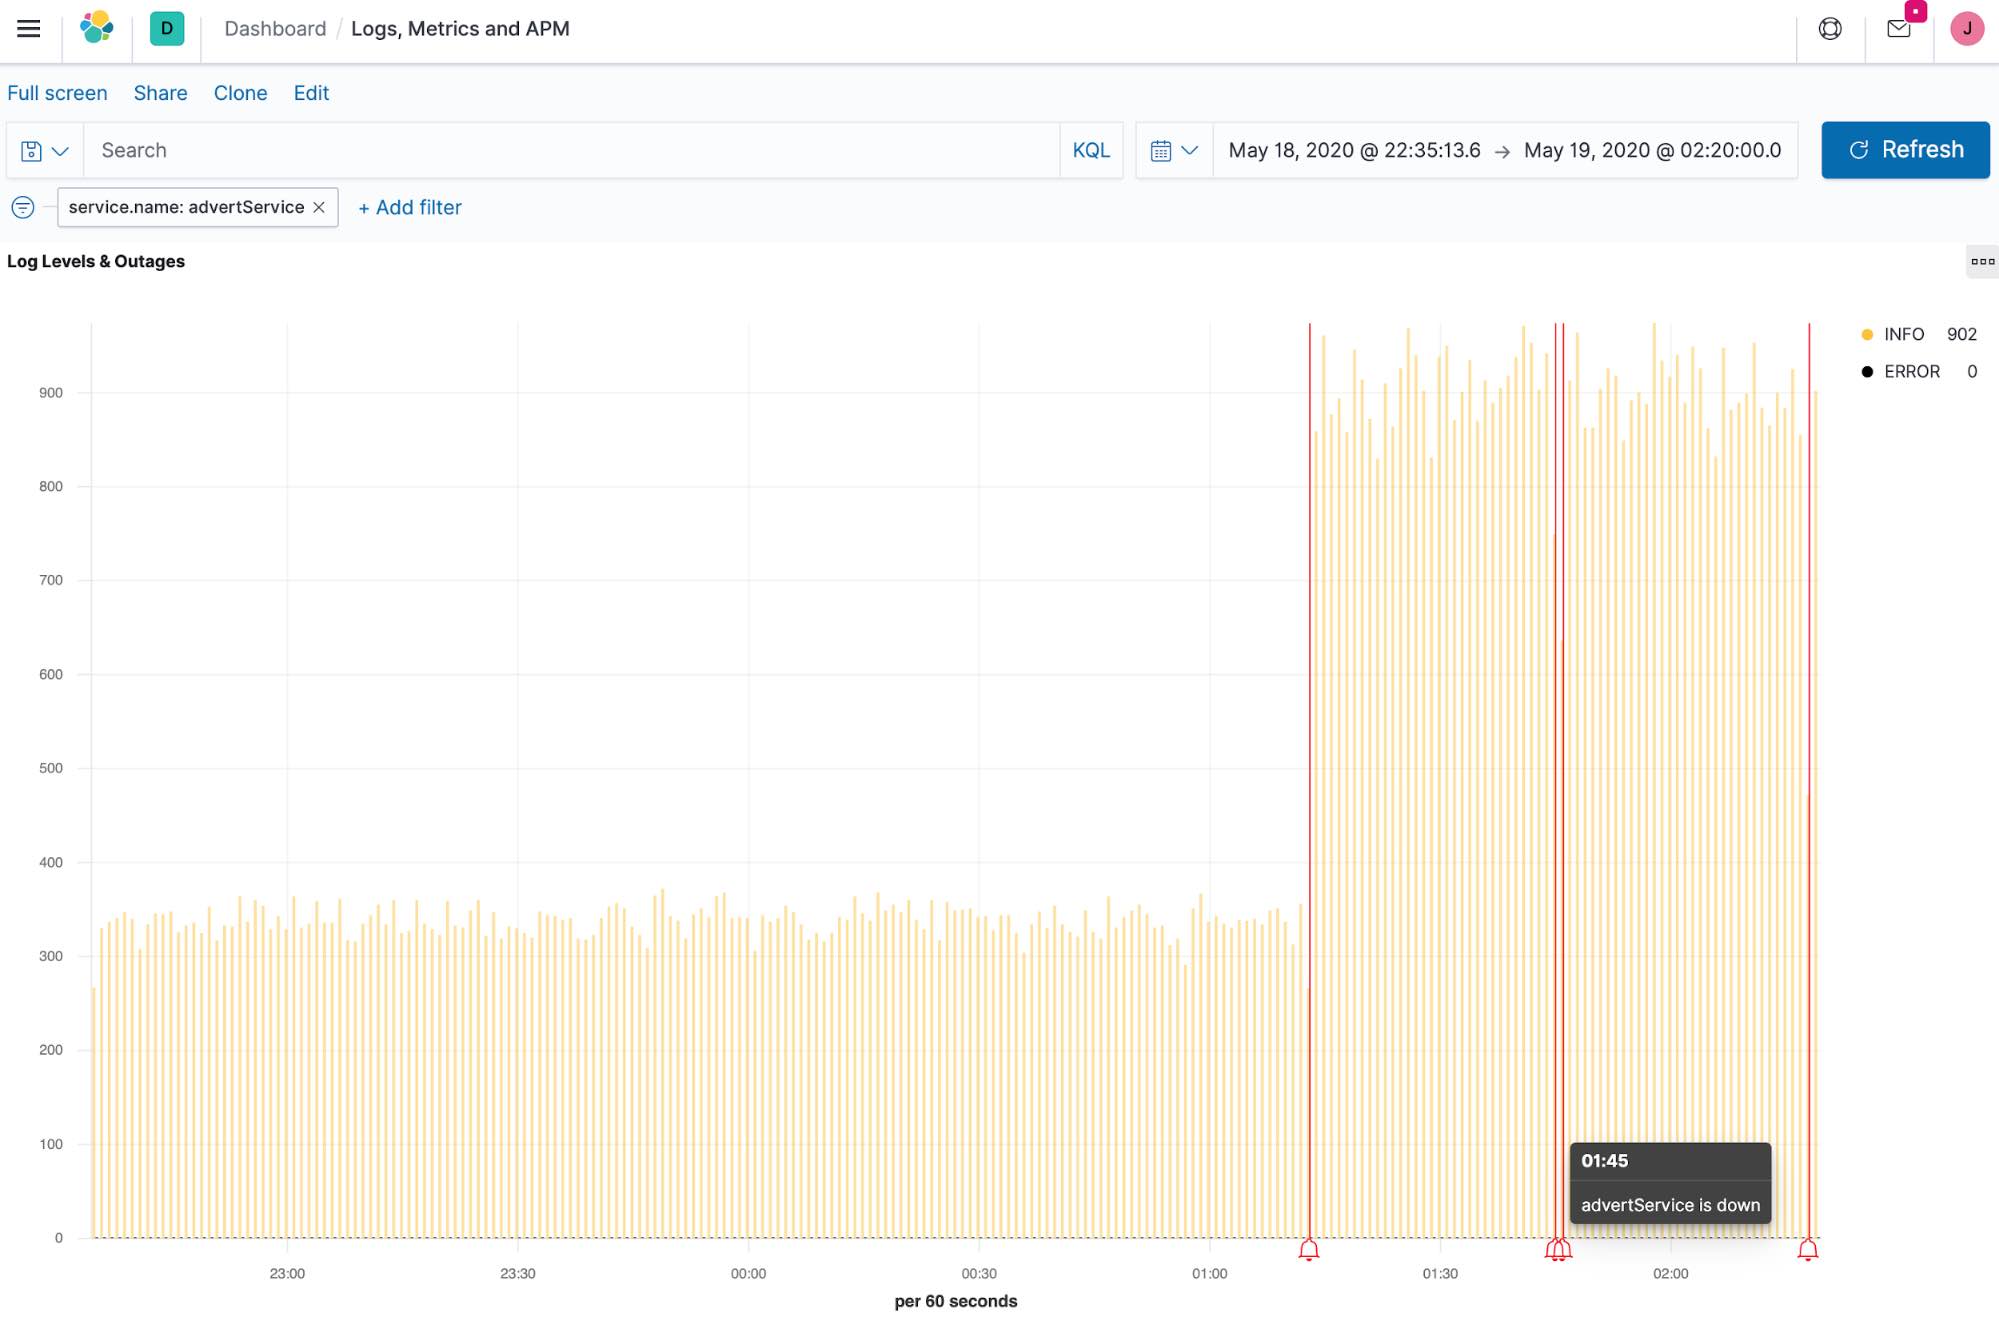
One of the greatest advantages of Elasticsearch is that every new data source is just another index — whether it’s uptime data, application performance monitoring (APM) data, logs, or metrics (collectively known as observability data). With Elastic, data doesn’t get siloed off based on its source or type, or even its original intended use. By combining these disparate data sources, you can create custom visualizations that show logging levels and downtime alerts on a single dashboard. And the Elastic Common Schema (which all the Beats use by default) makes that process even easier.
On the chart below, you can see the log rate for a service running in Kubernetes as well as annotations noting when an endpoint for that service was detected to be down by Heartbeat (red bells). By combining data from multiple sources, you add context that can help you reduce the mean time to detection (MTTD) when issues occur.
Up next: Uptime anomaly detection and alerting
By setting up a few Heartbeats, we were able to answer the question of availability. Is the elastic.co website up so visitors can learn about the Elastic Stack? Are visitors able to easily try out the latest Elastic features on the Elastic demo site? Is GitHub online so Elastic developers can push the latest features? And, is my internal TCP port responding so I can write this blog? We also saw the value of combining our uptime data with logs, metrics, and APM traces so you can monitor and react to events happening anywhere in your environment.
In the next blog, we will explore the anomaly detection integration with Elastic Uptime and set up alerting with uptime data. Before you check out that post, try Elastic Uptime for free today with your own services.