Kibana 8.8: Dark mode, custom branding, ML in Discover, and reduced alert noise


 Share on Twitter
Share on Twitter

 Share on LinkedIn
Share on LinkedIn

 Share on Facebook
Share on Facebook

 Share by Email
Share by Email

 Print this page
Print
Today we are pleased to announce the general availability of Kibana 8.8, which lets you set dark mode individually and choose custom branding — the top frequently requested enhancements! In this and future releases, we embed machine learning more tightly within the workflows where it arises, starting in 8.8 with log categorization in Discover, random sampler in Lens, and selecting all rows while inspecting data-frame analytics results, making these valuable features easier to discover and use. Finally, you can suppress automated notifications during maintenance windows and with other conditions, reducing alert noise, and we keep enhancing collaboration on cases, including attach files and activities to cases.
These new features allow customers to:
- Replace Elastic logo, organization name, and browser icon with your own
- Set dark mode individually
- Access log pattern categorization from Discover
- Suppress alerts during defined maintenance periods
Below, we provide more details on these impactful capabilities.
Elastic Kibana 8.8 is available now on Elastic Cloud — the only hosted Elasticsearch offering to include all of the new features in this latest release. You can also download the Elastic Stack and our cloud orchestration products, Elastic Cloud Enterprise and Elastic Cloud for Kubernetes, for a self-managed experience.
What else is new in Elastic 8.8? Check out the 8.8 Elasticsearch blog to learn about several enhancements relating to vector search that make it a lot easier to achieve superior performance even on specialized domains, as well as allow you to combine the dramatic innovations available in generative AI with the power of Elasticsearch.
More flexibility in the user experience!
Customers are now able to embed Elastic within a corporate portal environment with their own branding without the need for messy CSS hacks used to accomplish this in the past.
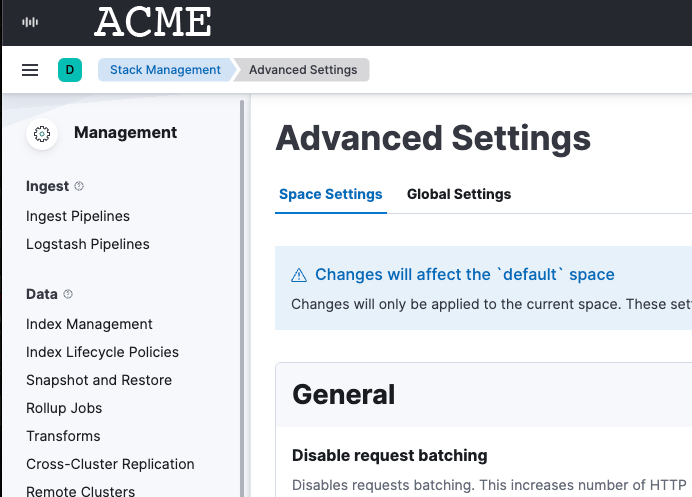
The logo, organization name, page title, and browser icon can be customized globally via the new “Global Settings” tab in the Advanced Settings section of Stack Management. Making these changes requires Kibana admin access and an enterprise license, and the changes apply to all spaces.
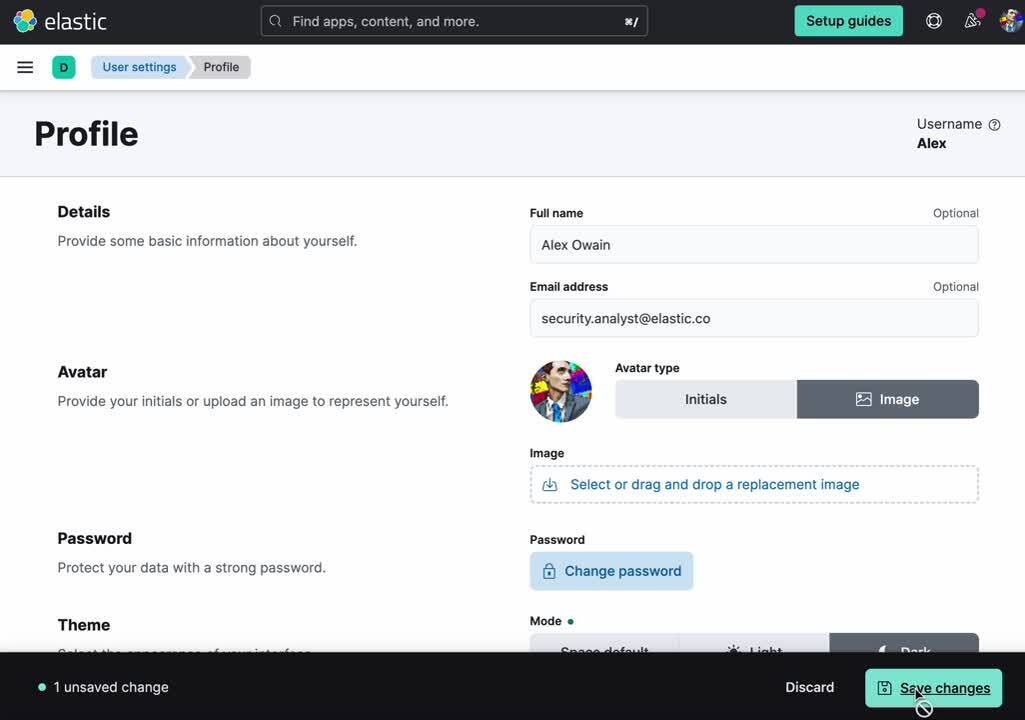
Continuing our user-first effort for personalization and collaboration, we are releasing the ability for users to customize the theme by setting dark mode individually. Users can choose between dark mode, light mode, or the default theme in the space.
Access machine learning where you need it
You can now run a pattern analysis directly from Discover, making it easy to explore your machine learning log pattern data. In Discover, hover over a field to run and load the pattern analysis, then select one or more patterns to filter for or filter out, displaying only the logs you’re interested in.
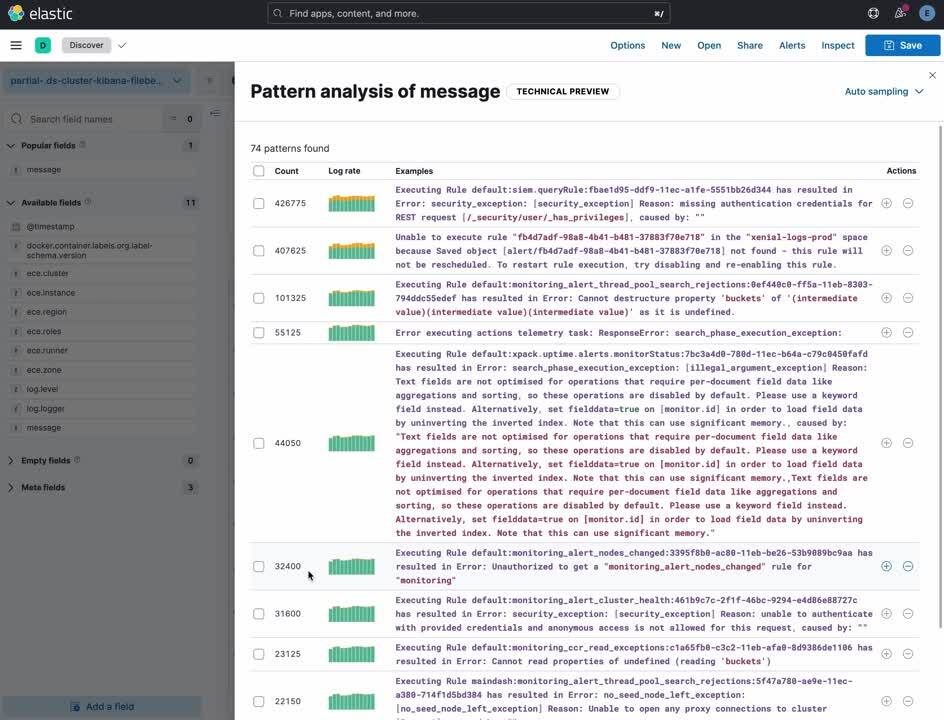
This feature is available for Platinum licensed clusters and is also planned to be a part of the new Observability Discover experience for Logs Exploration.
You can now also link directly to Discover from the results data grid filtering for the row’s field/values for all visible columns. This link can be found in the Actions column in the data grid of the results view. You can create a link to Kibana Discover, Kibana Dashboards, or an external URL, along with the ability to test the configured custom URL.
More control on alerts and collaboration on cases
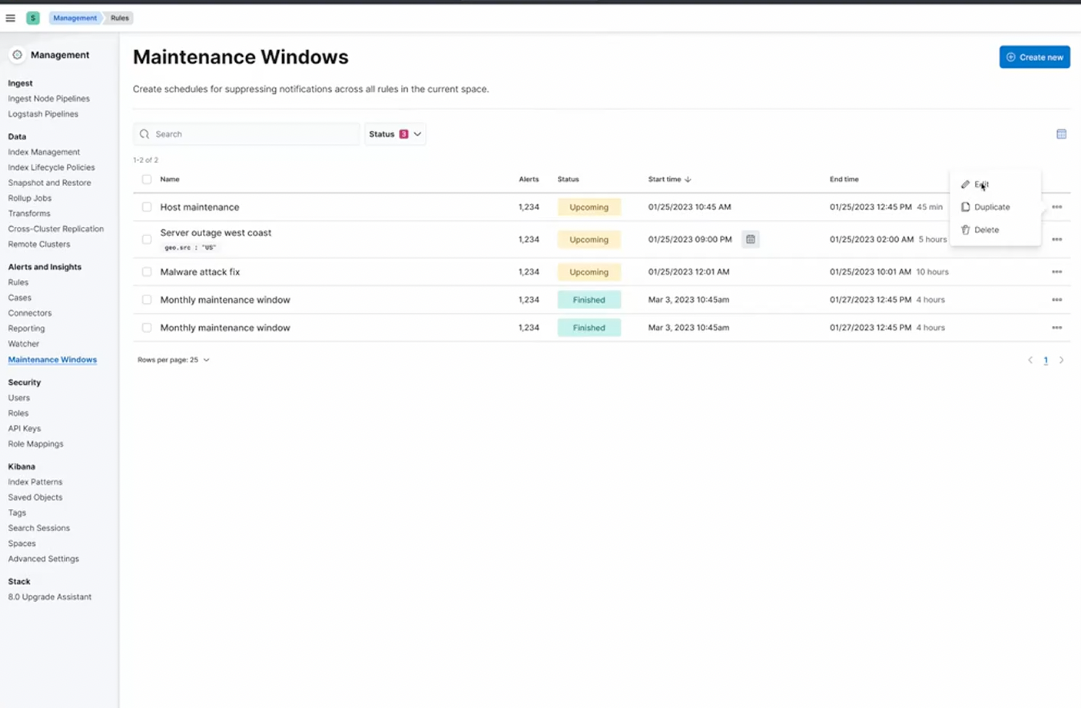
Schedule single or recurring maintenance windows to reduce alert noise and suppress notifications. For example, if you have a planned outage or event, a maintenance window prevents false alarms during this period (requires Platinum subscription).
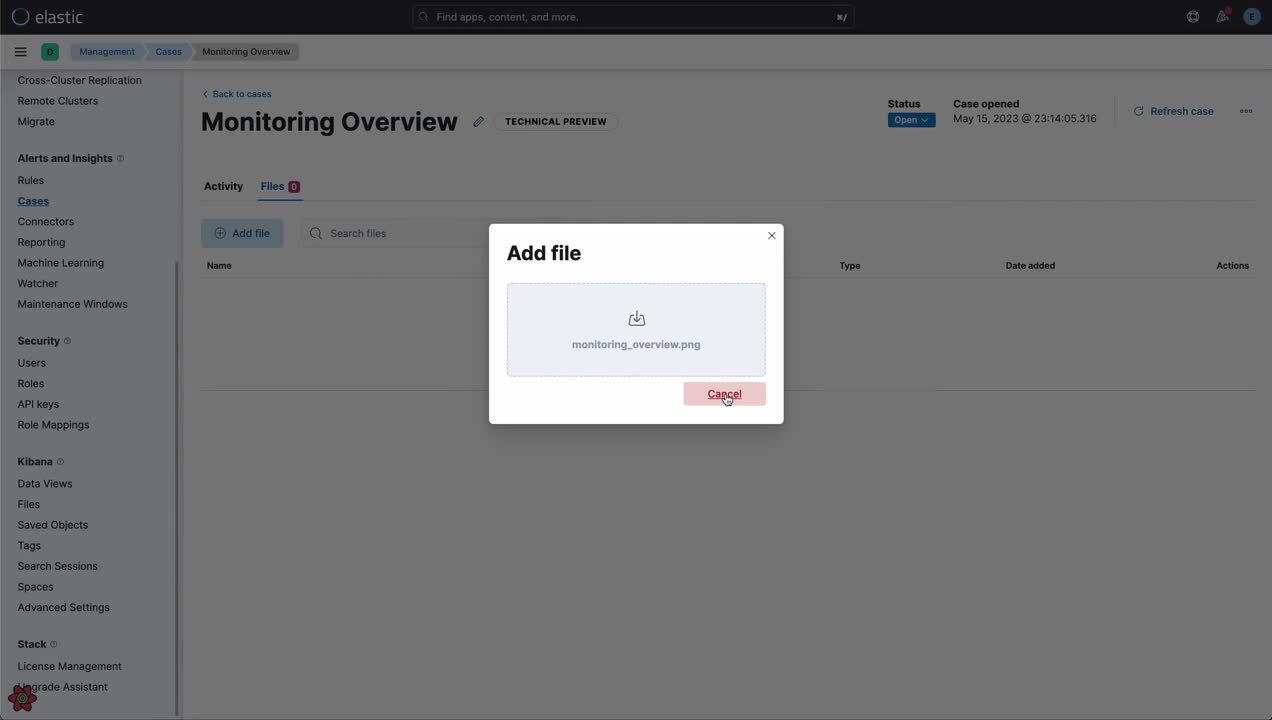
In 8.8, the case view has been enhanced in order to help users manage different artifacts within the case. The case view includes a new Activities tab with subtabs for Comments, History (user and system actions, like alert assignment or user assignment), and All activities. In addition, pagination, filtering, and sorting those views are now supported. And now you can attach files to cases for better investigation processes. With the new capability, you can upload IOCs and other files to support alert and case triage.
Wait . . . there’s more!
Elastic 8.8 includes many other enhancements, including easier configuration and management of machine learning jobs with visibility into memory occupied by models, as well as the ability to view statistics of selected fields from within the various machine learning model wizards, sparing you from switching between wizards and Kibana. Find out more at What’s New in 8.8 Kibana and all the exciting new features in Elasticsearch 8.8, including Elastic Learned Sparse EncodeR that delivers semantic search with superior relevance out of the box, improved hybrid scoring with Reciprocal Rank Fusion (RRF), and ability to use facets with vector search results, at What’s New in 8.8 Elasticsearch.
Try it out
Read about these capabilities and more in the release notes.
Existing Elastic Cloud customers can access many of these features directly from the Elastic Cloud console. Not taking advantage of Elastic on cloud? Start a free trial.
The release and timing of any features or functionality described in this post remain at Elastic's sole discretion. Any features or functionality not currently available may not be delivered on time or at all.
Share
- Share on Twitter
Share on Twitter
- Share on LinkedIn
Share on LinkedIn
- Share on Facebook
Share on Facebook
- Share by Email
Share by Email
- Print this page
Print