Visualizing security data with Canvas
Editor’s Note: Elastic joined forces with Endgame in October 2019, and has migrated some of the Endgame blog content to elastic.co. See Elastic Security to learn more about our integrated security solutions.
As we have explored in prior blog posts, Endgame uses Elasticsearch as its main data store for its alerts and investigation workflows. Moreover, a number of our customers and prospects rely on Elasticsearch to collect, analyze and visualize their security data. Last June, we announced the exciting news that Endgame entered into an acquisition agreement with Elastic, however even prior to these discussions, it became clear that our customers would see significant value in being able to integrate their Endgame data into their instance of Elastic. Endgame offers integrations into other SIEM and similar products (such as Splunk and ServiceNow), and soon, we hope to make Elastic Stack Integration (Beta) available to our customers in an upcoming release. With this feature, Endgame can stream all endpoints and events directly into a user’s Elastic Stack. This feature allows users to store and search Endgame data directly in Elastic and use the variety of applications offered by Elastic.
As this year’s Product Design Intern, I thought it would be a great opportunity to explore this feature for my summer project. I wanted to highlight one of Elastic’s applications, Canvas, and explore its capabilities using data streamed from Endgame. Canvas is an application that allows users to create highly customizable dashboards using real-time data. Compared to Elastic’s other visualization apps, Canvas’ built-in editing controls and powerful expression editor gives users complete control to create useful and dynamic dashboards. This seemed like the perfect tool for me to use as a designer.
With Black Hat in early August, I had only a few weeks to come up with a design idea, implement it, and have it presentation-ready for the conference.
The Alert Dashboard
Dashboards give a high-level overview about the overall health of an environment and provide metrics for easy report generation that many security teams are required to make. While current platform features like Reporting fulfill these needs, I decided to take this opportunity to improve upon our dashboards without the limitation of designing within the current Endgame platform. Since Elastic doesn’t currently have a way to visualize security alerts within their stack, I thought an alert dashboard would be a good place to start.
Preparation
The first step to creating an alert dashboard was gathering information to decide what to include. I referenced existing dashboards and reporting metrics we use to make this decision. I also had the opportunity to interview some of our actual users and gather their impressions. Through these discussions, I learned that managers were the ones who gained the most value from dashboards and wanted an overview of the health of their security environment.
I used this research to decide what type of visualization matched the type of information users wanted to see. Afterwards, I created a rough template of how to organize these elements. With this preparation, I had a good sense of what I wanted the final dashboard to look like.
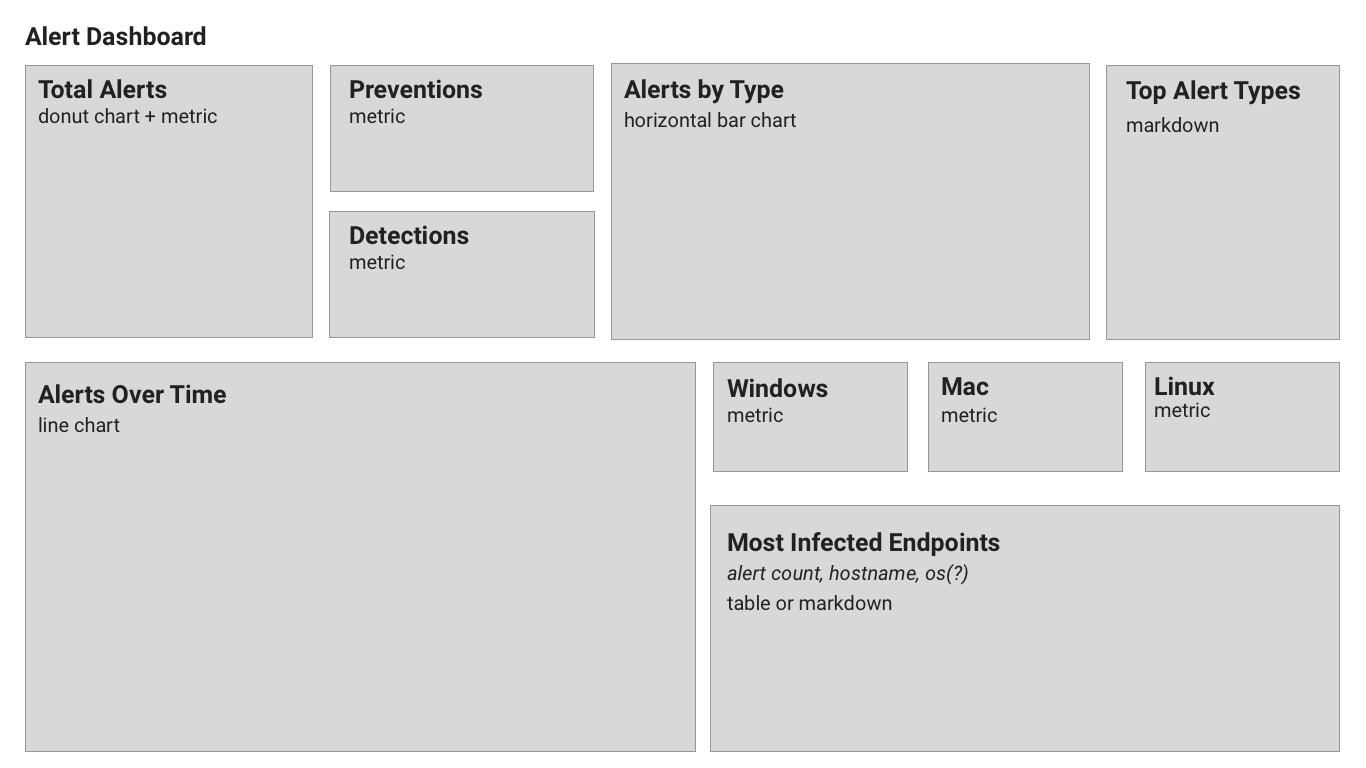
Design Process
The first step to creating an alert dashboard was to parse through the data streamed into the Elastic Stack and create the metrics I wanted. Even with only a beginner’s background in SQL, it was relatively simple for me to compose queries for the metrics I wanted displayed. Elastic also has several introductory tutorials about Canvas that are helpful to those unfamiliar with SQL.
After all the visualizations were made, the next step was the fun part: styling them! Canvas has several in-app controls to edit an element’s color palette, text styling, and more. However, for those who really want absolute customization, there’s an option to directly edit an element’s CSS stylesheet. I wanted to emulate the feel of the current Endgame platform, so I used Endgame branding and color choices throughout my design.
The Finished Product
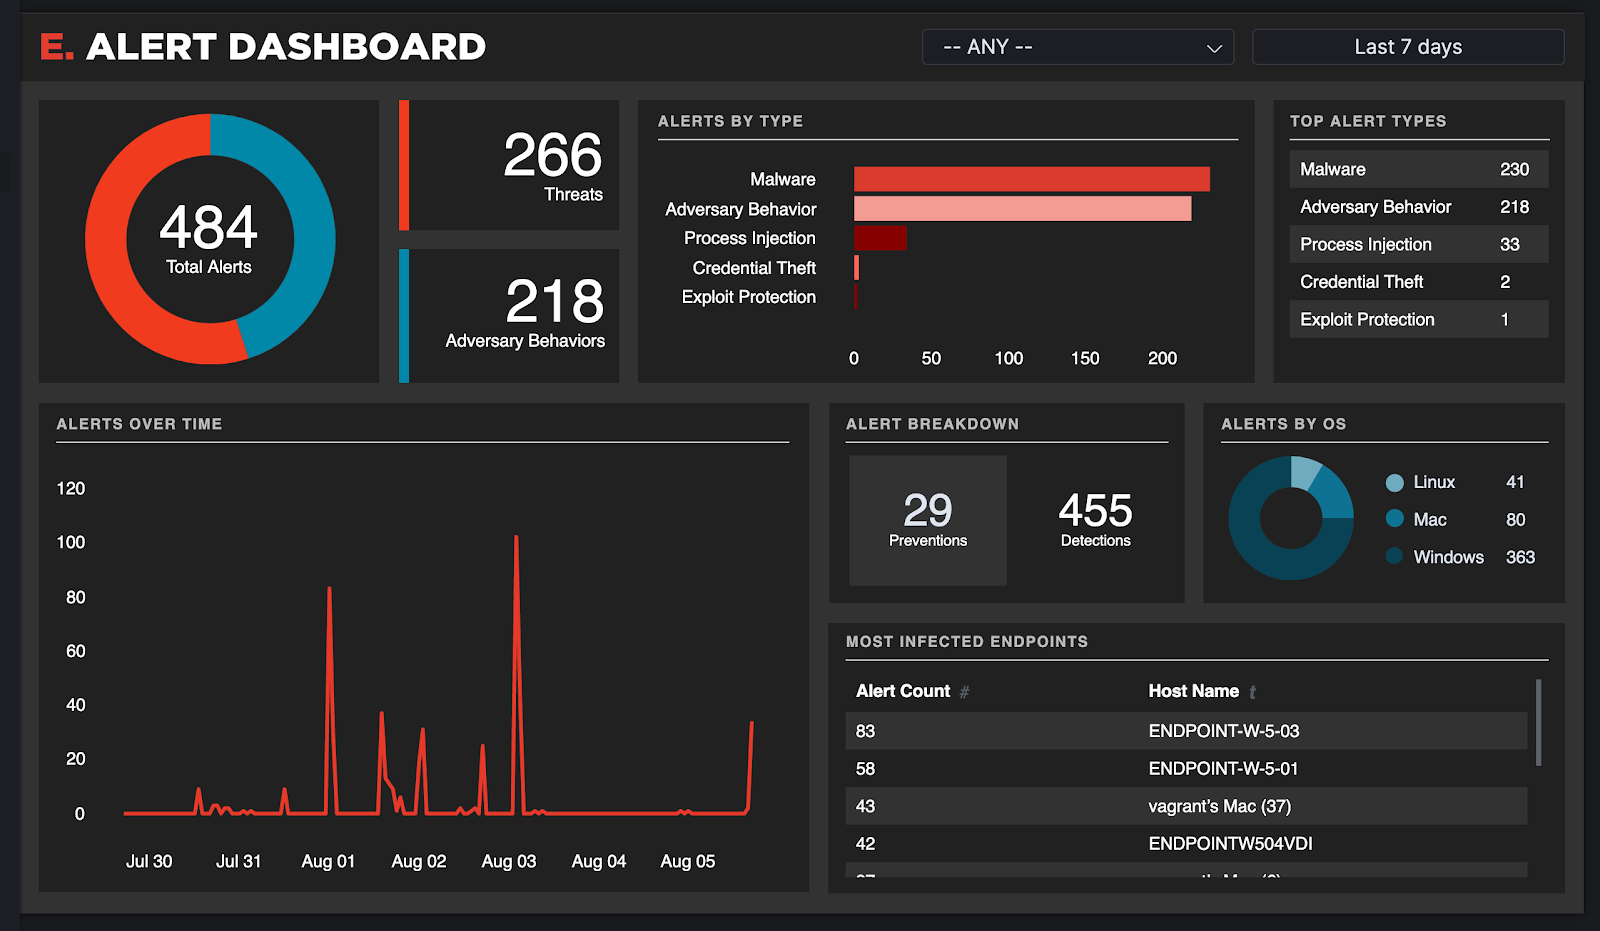
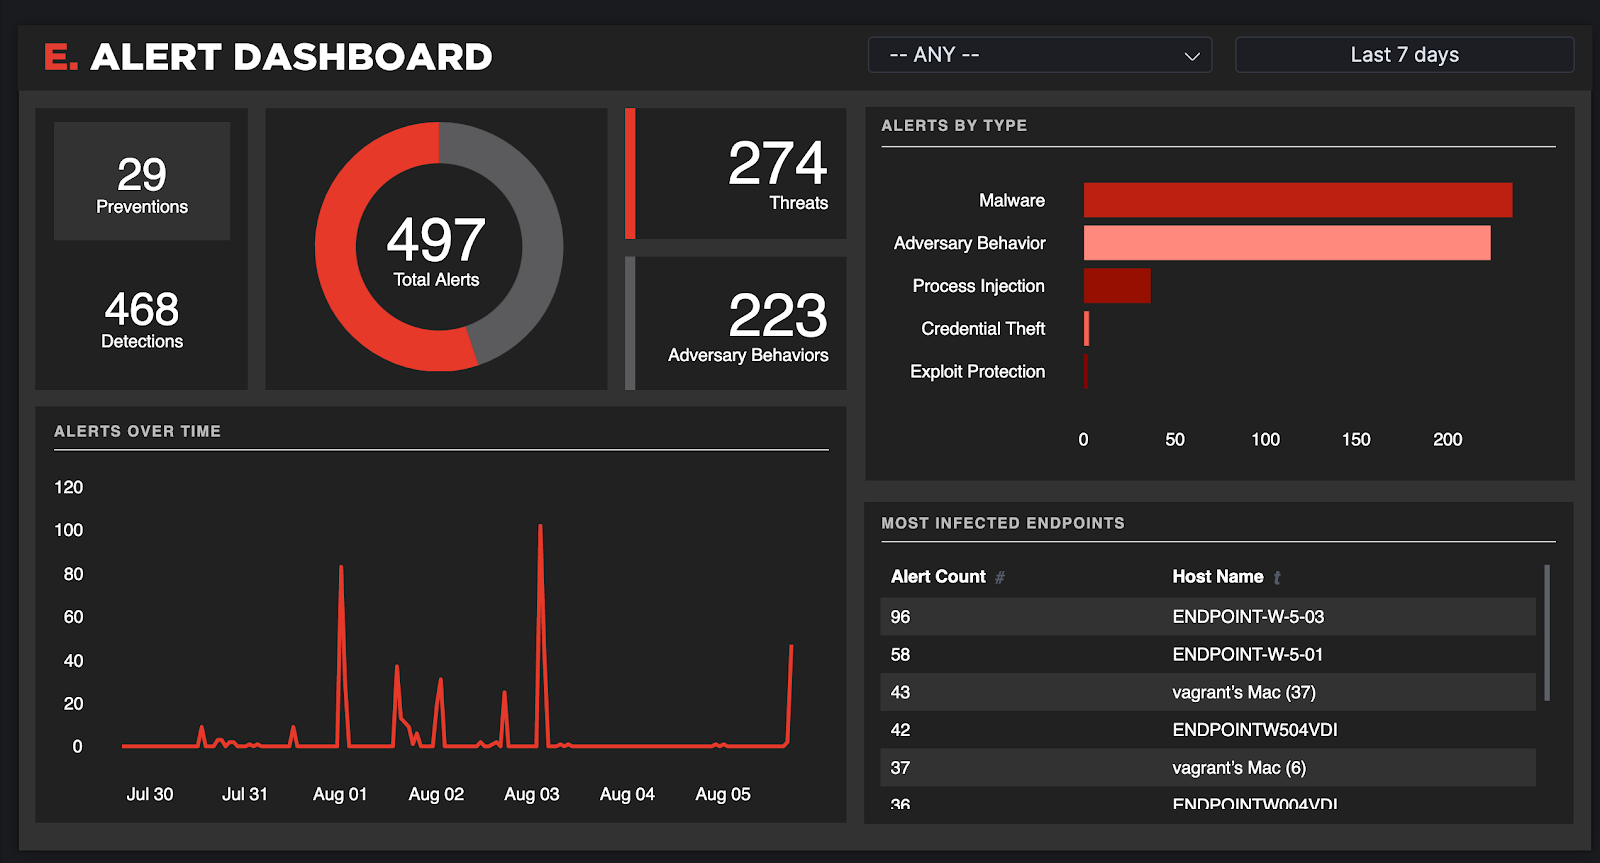
After several iterations and helpful feedback from my co-workers, the alert dashboard was finished! I created two versions that contained similar visualizations with varying color palettes and organization.
Customization Capabilities
I created these dashboards to be displayed at the 2019 Black Hat conference earlier this month. They were one of the talking points of the Elastic Integration demo.
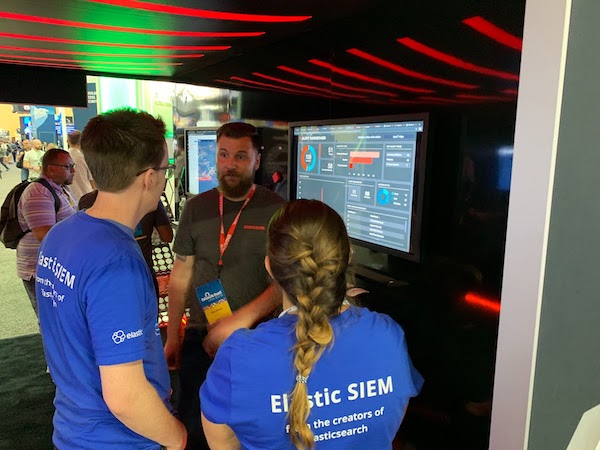
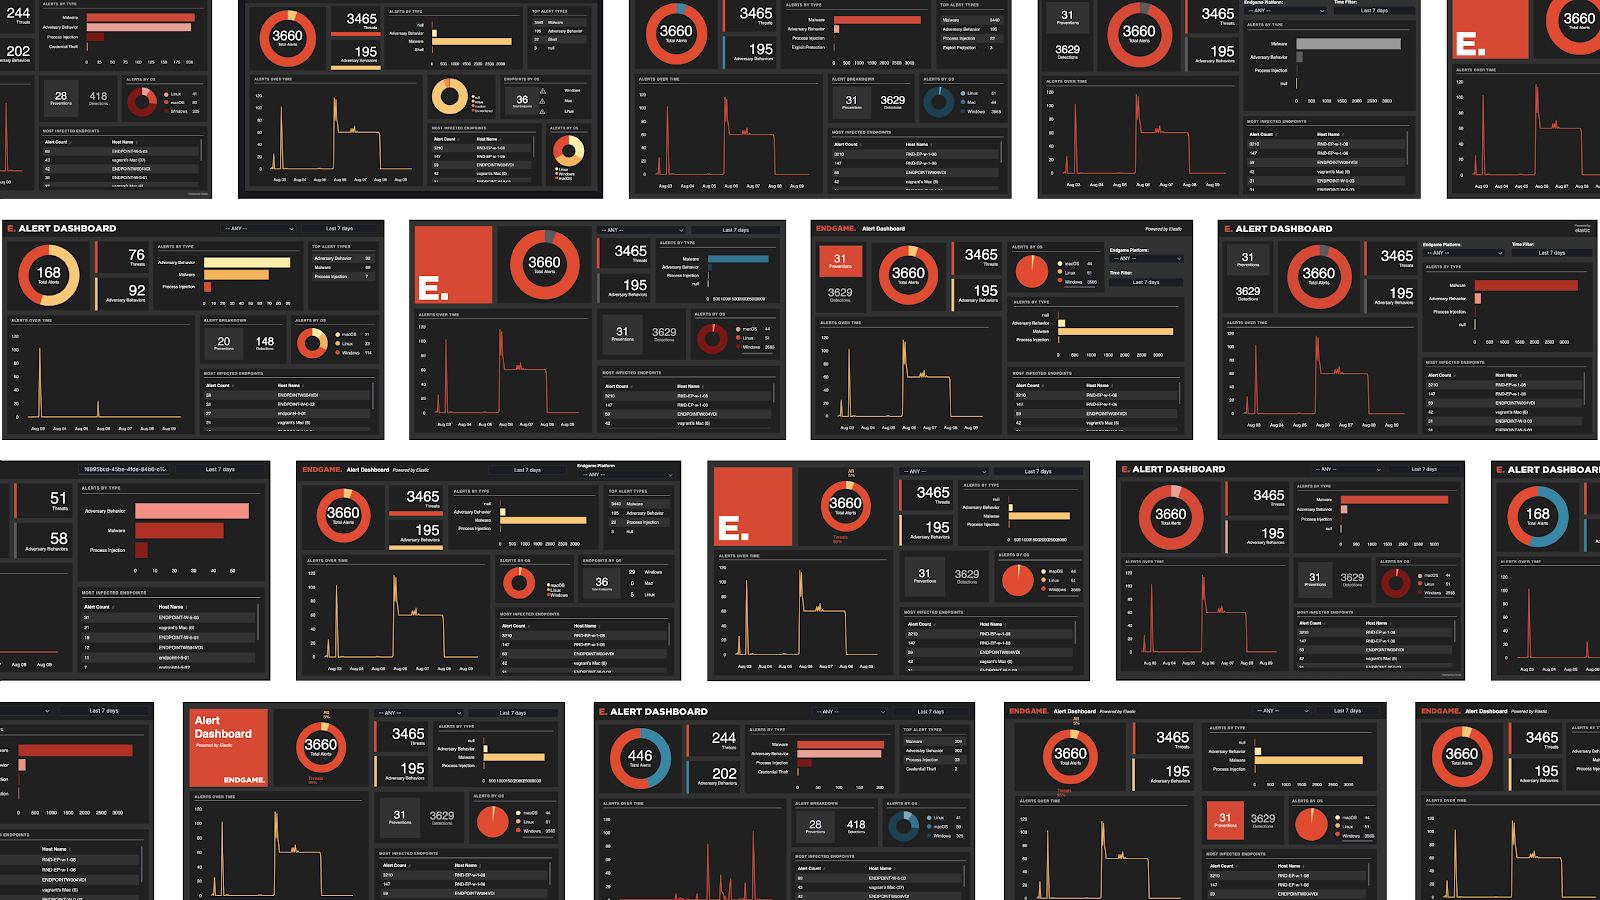
However, while I created two versions of the alert dashboard for Black Hat, there are infinite possibilities for how the dashboard could look. One of the best parts of Canvas is its limitless customization capabilities. I came up with almost a dozen different layouts. Any of these dashboards would be great depending on how users want to visualize their information. For example, some users want as much information as possible and to see a detailed breakdown of each element. Others might want a general picture and only desire to see the highest level metrics and trends.
Next Steps
It was an incredibly fun project to create a new alert dashboard from scratch. As a summer intern, it was awesome to see my dashboard prominently displayed at Black Hat. After exploring the Canvas application, I can say even those without a design or technical background are able to make visually striking dashboards with valuable data.
If you’re interested in learning more about the Elastic Stack Integration (Beta), feel free to reach out here. Either way, this is an exciting look into the possibilities of what will come out of the Endgame and Elastic partnership, so look forward to what happens next!